
Abstract
The aim of this study is to investigate the perception of managers from transition countries, as regards the management accounting information system. The research was conducted between May 2015 and March 2016 among businesses operating in Poland and Romania. The data were processed by means of cluster analysis. The findings indicate that the financial information used in operational management is highly rated by managers. Of the three profiles of managers distinguished, those defined as supporters and neutrals dominate in both countries.
1. Introduction
According to the Institute of Management Accountants, management accounting ‘involves partnering in management decision making, devising planning and performance management systems, and providing expertise in financial reporting and control to assist management in the formulation and implementation of an organization’s strategy’ (Definition of Management Accounting, Citation2008). Hence, a management accounting information system (M.A.I.S.) is a major source of information for management and managerial decision making (Mia & Chenhall, Citation1994). This kind of information is provided by management accountants and used by managers operating in different organisations and economics (Arsov & Bucevska, Citation2017). Byrne and Pierce (Citation2007), Fleischman, Walker, and Johnson (Citation2010) and Pierce and O’Dea (Citation2003) emphasised the difference in the perception of M.A.I.S. between management accountants and managers. However, how the perception of M.A.I.S. is shaped among managers depending on economic conditions and management accounting development in business organisations can also be investigated.
The objective of the study is to present the perception of M.A.I.S. among Polish and Romanian managers. As a result, three different profiles of managers operating in the studied companies were distinguished.
This empirical study shows not only which management accounting tools (i.e., whether operational or strategic tools) are used in business, and what type of information is used in the management process (financial or non-financial information), but also how these aspects are perceived by managers in the decision-making process. In turn, the separation into three separate profiles may indicate whether further professional development of managers in the area of management accounting, or organisational changes in M.A.I.S.s are necessary, for example by increasing access to strategic decision making. Poland and Romania were chosen for the study because they have much in common, for example similarities in the development of their economies, including joining the European Union, and, in recent years, the dynamics of their economic development (Kacprzyk & Doryń, Citation2017; The Growth of Polish and Romanian Economy, Citation2018). These two transition countries were selected because such countries are most often identified with socio-political conditions consisting of privatisation, liberalisation of markets, weaker market capital or inefficient bureaucracy and regulations, and rapid changes (Joseph, Citation2008). These points have influenced the shape of business, for example accounting systems in organisations in Poland and Romania. As emphasised by Anderson and Lanen (Citation1999), the accounting system should, as a result of these changes, move towards satisfying the needs of external and internal users, rather than concentrating on traditional bookkeeping, which is a tendency actually shown by both countries. Especially after 1990, and more intensively after 2000, management accounting has aroused enormous interest in research and business (e.g., Zarzycka, Citation2016). It is worth noting that the impact of market globalisation, as well as the growth of foreign investments, has made a major contribution to the implementation of Western practices in the field of management in transition countries (Alawattage, Hopper, & Wickramasinghe, Citation2007).
Previous research findings on the perception of M.A.I.S. refer mainly to developed countries, where M.A.I.S. is an inseparable part of business practice. Considering the globalisation processes in economies and accounting, it may be concluded that management accounting practice has the same dimension in most countries. Grandlund and Lukka (Citation1998) stated that the convergence of management accounting practice outweighs any worldwide divergence processes nowadays. In this context, this study investigates whether this view is valid, not only at the macro but also at the micro level.
The remainder of the paper is organised as follows: the second section includes a literature review, structured on three relevant topics: M.A.I.S. and its dimension, a perception concept, and management accounting development in transition countries. The literature review is followed by a presentation of the research methodology, as well as by the description of the study’s findings using cluster analysis. The conclusions are presented in the final section.
2. Literature review
2.1. The management accounting information system as a part of the management information system
M.A.I.S. in organisations provides data for both management performance and decision making (Grandlund & Lukka, Citation1998). However, an effective decision requires high-quality and useful information. The usefulness of management accounting information for management was characterised by Chenhall and Morris (Citation1986), based on different attributes, which are timeliness, aggregation, integration and scope.
M.A.I.S. should be perceived as a management information system, because management accounting is analysed with reference to the effectiveness of using information for management, thus improving its efficiency. The user perception of the importance, usefulness and efficiency of information has already been a topic in the management literature (Pierce & O’Dea, Citation2003). The management information system helps managers to reach the targets specified in the given functional area, with a knock-on impact on the goals of the company. Kim (Citation1989) described that these targets can be expressed in terms of decision-making efficiency, performance, interpersonal relations and job satisfaction. Adeoti-Adekeye (Citation1997) defined four elements characterising the management information system: focus on the information designed for the manager in the organisation, structural flow of information, data integration as part of the business function in the organisation and reporting. These can be linked to M.A.I.S. and, partly, to the proposal of Chenhall and Morris (Citation1986), especially in the case of data integration and reporting. In turn, Bjørnenak and Olson (Citation1999) indicated that M.A.I.S. can be classified, considering its role and functionality in the organisation, according to its scope and system.
DeLone and McLean (Citation2003) proposed the information system success model, which impacts the individual user through its application and the subsequent satisfaction levels, and, as a result, provides benefits for an organisation. Considering the fact that this model presents elements for the success of an information system, expressed in the satisfaction of its users, it was included in the context of M.A.I.S. and was then compared with the approaches of other studies to create a theoretical framework (see ). Selected elements of this model are highlighted, which are system quality, information quality and system use (DeLone & McLean, Citation2003). A similar combination of elements for measuring the success of M.A.I.S. was presented by Kim (Citation1989).
Figure 1. M.A.I.S. and its dimensions based on the D&M information system success model. Source: Authors.
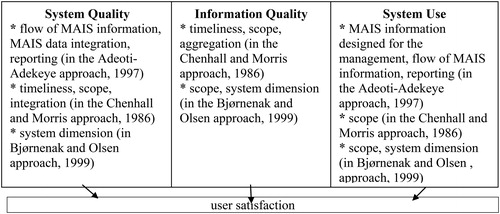
A large part of the elements presented in the context of M.A.I.S. and imposed on the D&M information system success model refers to the issue of system use, and hence information use by addressees. This perspective can be translated directly into the satisfaction or dissatisfaction of M.A.I.S. users. However, it should be noted that both the acceptable quality assurance of this system and the quality of information will have a significant impact on system use, and, as a result, on the perception, satisfaction and assessment of the system’s effectiveness by its users.
Byrne and Pierce (Citation2007), Fleischman et al. (Citation2010), Pierce and O’Dea (Citation2003) and Van der Veeken and Wouters (Citation2002) studied the perception of M.A.I.S. by management accountants and managers. They pointed to the gap between the information needs of managers and the output of management accountants, leading to the emergence of conflicts in organisations. This study focuses on the users of M.A.I.S. The users’ perspective has already been investigated by Bruns and McKinnon (Citation1993), Simon, Guetzkow, Kozmetsky, and Tyndall (Citation1954), but these studies refer to the entire accounting system and consider only those enterprises operating in highly developed countries, where management accounting is well known in business, as well as in research and education. Therefore, the findings of the present study regarding the situation in transition countries will contribute to the existing management accounting literature.
2.2. Perception of the management accounting information system
Cutting (Citation1987) investigated the meaning and nature of the information, as well as the manner in which the information impacts the perceptual system. Information and perception are complementary concepts. Etymologically, to inform means ‘to install a form within’ and, on this basis, perception is understood as installing external elements in the mind of the perceiver (Cutting, Citation1987). Perception is widely associated with thinking (Cutting, Citation1987).
The subject matter of information and perception finds its foundation in the Social Perception Theory, because it allows the examination of differences in perception between providers and users (Baron & Byrne, Citation1991). The theory focuses on how different people perceive others, in particular, in terms of what they see as important (Ristiono & Michalak, Citation2018). It was also employed to highlight and explain the differences in the perception of information systems between users and providers (Fleischman et al., Citation2010; Laudon & Laudon, Citation2006), as well as in the context of the users themselves (Sadić, Puśkak, & Beganović, Citation2016).
Perception can be discussed in the contexts of speech perception and visual perception (Cutting, Citation1987).Therefore, it can be stated that the perception of M.A.I.S. by managers will depend on interpersonal conditioning, their knowledge, the extent of managers’ influences on decisions, as well as internal features, top-down formal structures and standards (Baron & Byrne, Citation1991). On the one hand, in the same environment (i.e., with the same specificity) managers may have a similar perception of M.A.I.S., while on the other hand their individual predispositions (knowledge, education background, experience) may lead to a different perception.
The perception of M.A.I.S. will translate into the assessment of its usability and value (Sadić et al., Citation2016). Whether the information will be highly appreciated depends on whether management accounting and the shared information meet the expectations of managers. Managers need M.A.I.S. to ensure the accuracy and reliable measurement of outcomes. Simon et al. (Citation1954) described that managers use information for three purposes: problem solving, score carding and attention directing. The higher the support for M.A.I.S. in a company, the better the evaluation (positive perception) of the usage thereof by managers in terms of the completion of their tasks and achievements; or, in other words, user satisfaction.
The perception of M.A.I.S. by managers may vary depending on different circumstances, which may include the economy of a given country, the state of management accounting practice development and knowledge about management accounting. In particular, this may be noticeable in transition countries, in particular, post-trade.
2.3. Management accounting in transition countries
Granlund and Lukka (Citation1998) investigated whether management accounting differs across countries. Relying on previous research, they pointed out differences resulting from economic, cultural and institutional conditions. However, a global harmonisation in management accounting practices at the macro level is observed, though this refers only to the main concepts, ideas, techniques, M.A.I.S. designs and goals of using management accounting information (Granlund & Lukka, Citation1998).
Many researchers from transition countries, especially from Central and East European countries, studying management accounting after 1990, indicated great interest in this concept among practitioners, hence its dynamic development in organisations operating in these geographical areas, for example, Lithuania – Strumickas and Valanciene (Citation2009), Estonia – Lääts and Haldma (Citation2012), Poland – Szychta (Citation2008, Citation2018); Romania – Albu and Albu (Citation2012) and Jinga and Dumitru (Citation2015) or Czech Republic – Šiška (Citation2016).
What is specific for management accounting development in transition countries is the fact that these countries were under Russian control until 1990, at which time management accounting was mainly known as a cost accounting procedure and played only a marginal role in state-owned enterprises. From this point on, however, management accounting practice started to develop, especially in Poland, in line with the Anglo-Saxon and German approach (Szychta & Dobroszek, Citation2016) and, later, in Romania following the French approach and International Financial Reporting Standards implementation (Feleaga,Citation1996; Jianu & Jianu, Citation2012).
To assess the usefulness of M.A.I.S. for management in organisations operating in Poland and Romania, it is worth gauging the implementation state of management accounting tools and tasks. Traditional tools of management accounting, including traditional costs and performance systems (full costing system), operational budgeting and calculation still dominate in business practice in Poland (see Nita, Citation2014). A higher interest in modern methods can be noticed, however, mainly in activity-based costing (in Wnuk-Pel, Citation2014) and target costing, as well as kaizen costing, life cycle costing or open book accounting (in Szychta, Citation2008, in press 2018). In the case of Romania, the empirical study by Glavan, Braescu, Dumitru, Jinga, and Laptes (Citation2007) and Jinga, Dumitru, Dumitrana, and Vulpoi (Citation2010) showed that managers are satisfied with the financial data from financial accounting to support management. This confirms that management accounting does not play an important role there. Albu and Alexe (Citation2009) investigated the use of modern tools of management accounting, such as customer performance analysis, financial and non-financial measures for the management of employees and activity-based costing, employed mainly in large and private foreign capital.
Despite the findings presented above indicating that M.A.I.S.s are better developed in Poland, in both countries managers use mainly financial information in their managerial tasks.
3. Research questions and methodology
3.1. Objective of the study and research questions
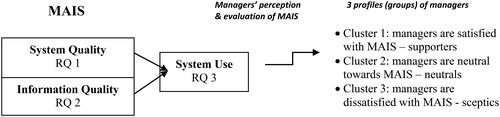
The objective of the study was focused on the perception of M.A.I.S. among Polish and Romanian managers. To present the findings, the authors applied elements of the D&M information system success model, a perception concept, having an impact on the evaluation of M.A.I.S. and hence on managers’ satisfaction (see ). The study started from the following research questions:
Figure 2. Combination of elements of D&M information system success model with RQs. Source: Authors.
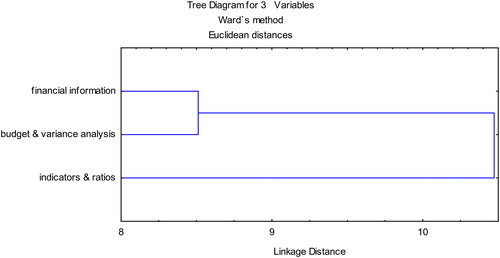
Graph 1. A dendrogram of managers’ perception of the importance of selected information of management accounting. Source: Authors.
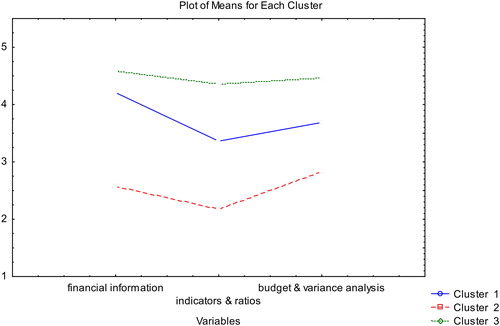
Graph 2. The grouping of managers with the k-means method in respect of the perception of the importance of selected management accounting information. Source. Authors.
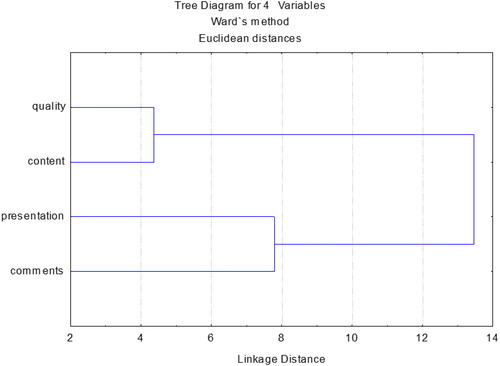
Graph 3. A dendrogram on managers’ perception in terms of the characteristics of M.A.I.S. provided in the form of reports. Source: Authors.
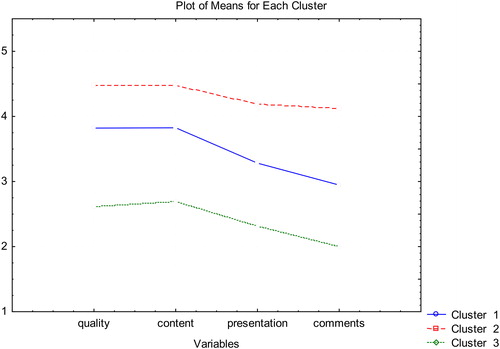
Graph 4. The grouping of managers with the k-means method in the context of characteristics of M.A.I.S. provided in the form of reports. Source: Authors.
RQ 1: How do managers perceive the importance of management accounting information for management?
RQ 2: How do managers perceive the specific characteristics of the received management accounting information in the form of reports?
RQ 3: To what extent do managers use M.A.I.S. for the performance of the indicated management activities?
RQ 1 covers the quality system, and it can be combined with importance, integration, aggregation or functionality for operational or strategic management. RQ 2 has been assigned to information quality, referring to such elements as accuracy and consistency. This applies to data quality, functionality, integration, reliability, and also completeness and relevance. RQ 3 relates to information use, referring to frequency of use.
The selected theoretical bases, i.e., information system success model, perception, including Social Perception Theory, were aligned with the cluster analysis method applied in the empirical section.
3.2. Research methodology
The research data were collected as a result of an empirical study in the form of a survey, conducted between May 2015 and March 2016, based on randomly selected businesses across various industries operating in Poland and Romania and characterised by the varied origins of their funding capital. The survey used in the study was an online questionnaire, structured into four different sections: the first two outlined a brief characterisation of the company, as well as the respondents themselves, the third section inquired about the existence and form of M.A.I.S. within the companies, while the fourth section included questions meant to capture the perception of the managers on the information delivered by management accounting. The questionnaire consisted of a total of 26 half-open and closed questions. The questions included single- and multiple-choice questions, span and matrix questions. These were based on earlier research conducted on: the purposes for which the information is used, on the suitability of the information, on the suitability of the information and on the qualitative characteristics of the information (e.g., Bruns & McKinnon, Citation1992a, Citation1992b; Chenhall & Morris, Citation1986; Mendoza & Bescos, Citation2001; Pierce & O’Dea, Citation2003).
The questionnaire was sent to managers (mainly operations managers). The companies, of various size, were randomly selected for the research. Mostly large and medium enterprises were included in the analysed sample. However, because of the difficulties encountered in gathering enough data (explained by the fact that domestic companies do not willingly participate in scientific research, while foreign branches often need the consent of the headquarters to do so), small companies were also included in the study, but to a lesser extent than medium and large organisations.
An analysis of the collected questionnaires showed that 154 were completed correctly, providing high-quality data for the analysis. Out of the 154 questionnaires, 116 originated from Poland and 38 from Romania. Each questionnaire corresponded to one respondent participating in the study; however, there were cases in which the questionnaires were completed by different managers from within the same company. The disproportion between the numbers of questionnaires sent shows the slightly better access to companies from Poland for the researchers.
In order to thoroughly analyse the set of data obtained from the conducted survey, cluster analysis was applied. This method allows for the segregation of the observed data into specific groups so that the degree of association of certain objects with others belonging to the same group is as high as possible, while association with objects from other groups is as low as possible. This tool systematises, to a large extent, the gathered information into specific structures and, consequently, gives an overview of the surveyed objects. Cluster analysis is a very commonly used approach in analysing research data collected in sociological, marketing or psychological research to group specific phenomena or objects, such as consumers, clients, and managers (e.g., Khan, Bakkappa, Metri, & Sahay, Citation2009; Saunders, Citation1980). Accounting, including management accounting (e.g., Ingram & Margetis, Citation2010; Nimtrakoon & Tayles, Citation2015) may also be subjected to grouping. In addition to cluster analysis, descriptive statistics (occurrence frequency of the phenomenon, mean standard deviation, variance) were used in the presentation of the findings. For cluster analysis purposes, the variables were classified by means of the agglomerative (hierarchical) method, in which Euclidean distance was applied in order to calculate the distance between objects, and Ward’s method, considered one of the most efficient, as the method to combine the objects and classes (Online Manual on Statistics, Citation2016).
3.3. Research sample
The companies from Poland and Romania involved in the study were mainly manufacturing enterprises (52%, 61% respectively), with about 30% of the companies being service providers, while slightly over 10% were trade companies. Over 60% of the surveyed companies from both Poland and Romania could be classified as large in terms of their number of employees. The majority of the companies from Poland and Romania had foreign capital: 42%, 57%, respectively, of the study population. The prevailing share of foreign capital may indicate that the enterprises participating in the study were branches of foreign companies. This may have an impact on the M.A.I.S.s dimension, because this system when used in a subsidiary is often based on operational tools (mainly reporting and budgeting), or on managers’ perception.
The educational level of the surveyed managers should also be noted. Some 98% of the Polish managers hold a master’s degree, 40% have completed an MBA and 9% hold a PhD, while 68% of the Romanian managers hold a master’s degree with only 13% having an MBA. These results show the slightly higher education level of managers from Poland than for those from Romania. This aspect is significant for the interpretation of the findings, since it may have a bearing on the satisfaction and perception of management accounting information. For example, those managers without the depth of educational background may not obtain information from modern management accounting tools, as they may not be familiar with these opportunities.
Among the studied organisations, management accounting tasks were mostly performed within a distinct department; yet, the companies often prefer to integrate management accountants with employees from other departments. Only two of the Polish companies outsourced management accounting.
4. Findings – managers’ perception of the management accounting information system
The cluster analysis and other selected indicators of descriptive statistics (to confirm the frequency of responses) were used to analyse and present the findings. Taking into account the similarity of the respondents’ answers in the areas of RQ1, RQ2 and RQ3, the findings were then integrated for Poland and Romania.
4.1. The importance of selected management accounting information – RQ 1
For the analysis, the following variables were taken into account and grouped: financial information (financial results, costs, revenues, financial ratios), budgetary data with variance analysis and non-financial indicators (on quality, operations, customer satisfaction, employee satisfaction) (Definition of Management Accounting, Citation2008). After the first stage of clustering, the variables formed two clusters. The first one was composed of financial and budgetary data, while the second includes non-financial indicators and ratios (see ).
The division shows that the answers of managers in respect of the perceived importance of the financial information and budget & variance analysis are in line. These two clusters may indicate two groups of managers, i.e., those applying financial information and budgetary data (cluster 1) and those using non-financial indicators (cluster 2) for their tasks. In addition, it may be determined that the perceived importance of financial and budgetary data was similar, meaning that if respondents evaluated the importance of financial information as high, they generally also rated the importance of budgetary information and information on variance as high.
The above conclusions are complemented with the results on the grouping of managers with the k-means method (where k = 3), as shown in .
In the classification into three clusters, three divisions are obvious: managers who perceive and rate the importance of studied variables in their professional work as low (cluster 2), moderate (cluster 1), and high (cluster 3). Hence, the surveyed managers will be classified into sceptics, neutrals and supporters. The differences in the responses of these three groups are presented in .
Table 1. The three clusters of managers perceiving and assessing selected management accounting information moderately, low or high.
It is worth noting that the size of the first cluster (managers viewing and assessing an importance of studied variables) is the largest (62 persons vs. 20 from the second cluster and vs. 44 from the first cluster).
4.2. Managers’ perception of specific characteristics of internal reports – RQ 2
The agglomerative method was also used for the cluster analysis in respect of the perception of the selected characteristics of M.A.I.S. provided in the form of reports. For the purpose of cluster analysis, these characteristics were grouped into four categories (quality, content, presentation and comments – see ). The first category ‘quality’ contained an assessment of comprehensibility, clarity and timeliness of M.A.I.S. ‘Content’ measures satisfaction with the completeness, relevance and the degree of details. ‘Form of presentation’ focuses on the appraisal of standardisation, graphical presentation and technical tools used to provide information to users. Finally, ‘comments’ evaluates the quality of comments and future references.
After the first stage of clustering, two clusters were formed: quality and content (cluster 1) and presentation of data and comments (cluster 2). The first cluster is composed of quality and substantive aspects, since the accuracy and the appropriate selection of data are reflected in the quality of the reports. The second cluster is formed by visual and explanatory aspects which create added value to internal reports, facilitating their accurate reading by managers and supporting them in the process of ongoing assessment of the business situation and decision making (see ).
The confirms that the managers’ perception in respect of such elements as quality and content are similar. Comparable results were obtained in the case of the perception of elements of reports such as presentation and comments. This means that if managers, based on their perception, rate the quality as high, they also rate the content of the reports as high. In the second group, if managers evaluate the presentation of data (the form) as high, they also rate comments in the internal reports as high.
The higher level of aggregation may suggest a division of the managers into two homogeneous groups, i.e., the first cluster of managers who perceive the quality and content of the reports as high, and the second cluster of managers who perceive the presentation of data and comments as high. At this point it is possible to divide the surveyed managers into those who put an emphasis on the traditional aspects of reports, i.e., their appropriate content and quality – ‘traditionally oriented managers’, and the managers for whom the appropriate form of presentation (e.g., graphs) and comments are essential – ‘modern managers’.
The above conclusions are complemented with the result of the managers grouping with the k-means method (where k = 3), as shown in .
The division into three clusters indicates the arrangement of the managers into those who evaluate studied characteristics as low (cluster 3) – sceptics; moderately (cluster 1) – neutrals; or as high (cluster 2) – supporters.
Accurate information on the differences in responses of the three groups seen in is presented in .
Table 2. The three clusters of managers perceiving and assessing selected characteristics of M.A.I.S. provided in the form of reports moderately, low or high.
It is worth highlighting that the size of group 1 (65 respondents), making a moderate evaluation of the elements of internal reports, differs significantly from the sizes of cluster 2 (38 respondents) and 3 (23 respondents). This means that in the majority of cases, the managers perceived the analysed characteristics of M.A.I.S. neither as high nor low.
4.3. Managers’ perception on the use of management accounting – RQ 3
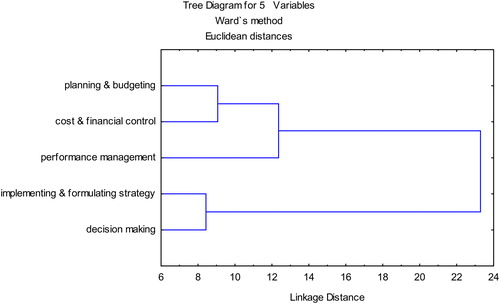
The agglomerative method presents an interesting overview of the perception on the use of management accounting for the performance of management tasks. The managers evaluated selected management accounting services according to the following scale: I do not use it; I use it to a small extent; I use it to some extent; I use it to a great extent; it is indispensable for me. The following management activities were indicated in the survey: long-term planning, budgeting, strategy implementation performance measurement, profitability, departmental decisions, make or buy decisions, investment decisions, research and development decisions, cost reduction and its control, and internal project decisions. Using cluster analysis, these areas were grouped into planning & budgeting (budgeting, long-term planning), costs and financial control (profitability, costs reduction and its control), performance measurement, formulating & implementing strategy, decision making (departmental decisions, make or buy decisions, investment decisions, research and development decisions, internal project decisions). These tasks were distinguished based on the definition of management accounting provided by I.M.A. (Definition of Management Accounting, Citation2008).
At the lowest level of the agglomeration within the cluster analysis, the clusters were created with the following features: planning and budgeting and cost and financial control (cluster 1), performance management, including its measurement (cluster 2), formulation and implementation of strategy and decision making (cluster 3). At the higher agglomerative level there were two main clusters. The first cluster consists of traditional tasks of management accounting (of a control nature), i.e., planning and budgeting, costs and financial control, and performance management (including its measurement). The second cluster includes the tasks from the scope of decision making and formulation and implementation of strategy (tasks associated with strategic thinking and decision making) (see ).
The graph confirms that the perception of managers that use management accounting information to perform control tasks are close to each other. Similar results have been obtained with respect to the use of this information for strategic tasks and decision-making purposes.
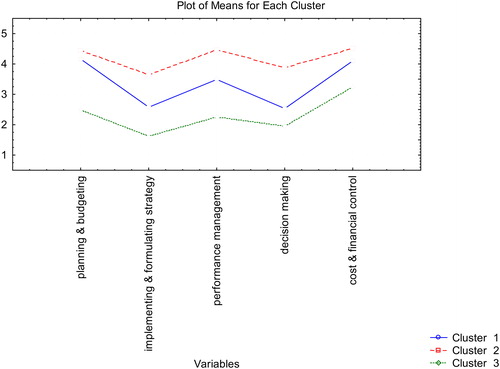
The above conclusions are complemented with the result of managers’ grouping with the k-means method (where k = 3), as shown in .
In the classification into three clusters there is a clear distinction between managers who perceive and rate studied variables which support their management activities as low, moderate or high. These can be divided into: sceptics, with a low evaluation (cluster 3); neutrals, with a moderate evaluation (cluster 1); and supporters, with a high evaluation (cluster 2). is complemented by the data presented in .
Table 3. The three clusters of managers perceiving and assessing M.A.I.S. use moderately, low or high.
The findings indicate that the cluster of managers rating the usefulness of studied variables as high is the largest (54 cases vs. 44 for cluster 1 and 28 for cluster 3). Moreover, as a rule, managers belonging to the group of respondents assessing the usefulness of M.A.I.S. for control purposes higher than those persons from the second and third group, also rated the usefulness of this system for decision making and implementation of strategy tasks as high.
4.4. Summary of findings
The application of cluster analysis for the verification of the data enabled the authors to obtain interesting findings about information and system quality and system use with reference to M.A.I.S. The selected and studied variables were dependent on managers’ perception, and thus their evaluation.
The findings enable the identification of two groups of managers: those traditionally applying financial information and budgetary data and those using non-financial indicators for managerial tasks. The perception of the selected kinds of information allowed identification of those managers who use the traditional, financial information, and those who use the more qualitative information for management processes. It is worth pointing out that non-financial information (including indicators) is more useful in a dynamic environment or for companies introducing innovative concepts such as just in time or total quality management (Chenhall, Citation2006), meaning it is used mainly in developed M.A.I.S. In this scope, managers declared overall moderate and higher levels of importance of financial information and budgetary data with variance analysis, while in the case of non-financial indicators the level is lower. This may confirm the fact that M.A.I.S.s supporting management processes in companies located in transition countries are less developed. These findings are only partially consistent with Fleischman et al. (Citation2010), as these authors show that users of management accounting actually place more emphasis on planning & budgeting and management reporting but rank financial accounts lower. In addition, Bruns and McKinnon (Citation1992a, Citation1992b) suggest that managers sometimes consider non-financial indicators more useful than financial ones in order to make a relevant diagnosis of a situation. However, Pierce and O’Dea (Citation2003) confirm that managers seek traditional types of information. Taking into consideration the contention of Johnson and Kaplan (Citation1987) that management accounting is dominated by the requirements of financial reporting, it is assumed that the researched managers repeat this approach, declaring a high or moderate valuation of the financial data and revealing their greater satisfaction with it.
This study distinguished the clusters of managers who evaluated management accounting information for control tasks as high and those who make such an assessment for the use of this information for decision-making purposes and for strategy implementation. The number of managers who perceived management accounting information for the realisation of studied tasks as high or moderate was larger than those who perceived it as low. However, the relatively lower assessment of management accounting information usefulness for decision making and implementing strategy is in contrast with the frequently encountered opinion that information is mainly useful and valuable in the context of decision making (e.g., Chenhall & Morris, Citation1986), but is in line with Bruns and McKinnon (Citation1992a, Citation1992b), who state that managers needing to make decisions search for other sources of information. The research also identified two groups of managers: those satisfied with the quality and content of the reports and those content with the presentation of the data and comments. This is in line with Pierce and O’Dea (Citation2003), who pointed to graphic representation as one of the most unsatisfactory elements of the reports prepared by management accounting departments. Moreover, excessive concentration on financial data means that information is past-oriented and lacks references to the future. Thus, this decreases the information’s usefulness with regard to operational activities and management processes, as stated by Johnson and Kaplan (Citation1987), thereby leading to a low level of satisfaction among managers. In addition, the same situation occurs in the case of the comments provided by M.A.I.S., i.e., that they are insufficient and there is a lack of guidance for the future.
5. Conclusions
The aim of the research was to explore managers’ perception of M.A.I.S. in businesses operating in transition countries. Taking into account the similarity of the Polish and Romanian respondents’ answers, findings were integrated for Poland and Romania and cluster analysis enabled grouping of the integrated data according to similarities and thus to present differences between clusters. Based on this, three profiles of managers were distinguished: sceptics, neutrals and supporters. The findings show that perception, and therefore the evaluation of the studied variables, in the context of M.A.I.S. is different. Clusters of managers who rated M.A.I.S. elements as high, moderately and low were distinguished. In the vast majority of cases, the managers assessed the studied variables at a moderate level. This means that they were neither very satisfied with M.A.I.S. nor dissatisfied. Slight differences were recognised in the case of RQ 2, where the support cluster had a large size for both countries.
Generally, this study reveals that M.A.I.S.s providing mainly financial information are used for operational management in Poland and Romania. However, there are some managers, especially in Poland, who have a better perception of the value of modern management accounting methods and tools and their importance for strategic management. The mentioned differences between perception, and thus evaluation, of M.A.I.S. between Polish and Romanian managers may result from different management accounting development in these countries and the influence on them of other countries’ economies. In order to understand managers’ perception of M.A.I.S., one needs to understand management accounting practice and its development. The description of this issue in the first section of the article indicated that management accounting practice is better developed in Poland than in Romania, given the German influence in this area (e.g., more German subsidiaries with management accounting departments). Moreover, this research showed that the studied Polish managers are slightly better educated than Romanian managers, which might impact on their understanding of new solutions (tools, I.T.) of M.A.I.S. However, the more traditional, operational solutions are employed in both countries, owing to the fact that the strategic ones are used in the headquarters located in Germany or France, etc.
In addition, three groups of managers have been identified: supporters, sceptics and neutrals. No clear differences have been observed between the manager profiles, in either of the two countries. Most of them react neutrally, meaning they evaluate the studied M.A.I.S.s as average for their informational needs and management tasks. It can be stated that despite some differences between the two countries with regard to the development of management accounting practice (in Poland because of the influence of German businesses, in Romania as a result of I.F.R.S. implementation), the perception of M.A.I.S.s by managers is much the same. The separate groups of managers indicate the avenues of their further development. For example, supporters should develop their strategic and network management competences using the strategic tools and methods of management accounting. In turn, the sceptics should improve their awareness of know-how of management accounting to find ways for the better use of available M.A.I.S. for their management tasks in the future. In the case of the neutrals, use of M.A.I.S. should be developed further, and this group of managers should have greater opportunity to use M.A.I.S. (better access), both for operational as well as strategic management. In this way they may see the higher added value of it.
The present study indicated that management accounting practice on the one hand aims to homogenise at the macro level, while on the other hand, mainly at the micro level, it highlights differences between individual countries in this respect.
5.1. Limitation and future research
This study makes a contribution to the research on management accounting, in spite of its limitations. First, only selected elements of the D&M information system success model were used, which precludes the evaluation of M.A.I.S. in terms of its successes. Moreover, the small number of responses should be acknowledged, which does not allow universal conclusions to be made. Second, the study did not discuss the results separately for the small and medium enterprises and large organisations, as no differences were observed. Neither did the study focus on small and medium enterprises, although this could be a direction for future research, allowing the investigation of the separate management accounting needs of managers from small and medium enterprises as well as large organisations. Third, the use of questionnaire-based surveys only is generally not sufficient for thoroughly assessing the perception of managers. Therefore, future research should be completed by an interview-based approach that enables better understanding of the perception of management accounting and the information it provides to businesses. It will also be worth expanding the study to managers from organisations operating in other countries, for example developed countries, and to compare the usefulness of M.A.I.S. in the context of operational and strategic management.
Disclosure statement
No potential conflict of interest was reported by the author(s).
Graph 5. A dendrogram on managers’ perception of M.A.I.S. use for the performance of management activities. Source: Authors.
Graph 6. The grouping of managers with the k-means method in the context of M.A.I.S. use for the performance of management activities. Source: Authors.
References
- Alawattage, C., Hopper, T., & Wickramasinghe, D. (2007). Introduction to management accounting in less developed countries. Journal of Accounting & Organizational Change, 3(3), 183–191. doi: 10.1108/18325910710820256
- Adeoti-Adekeye, W. B. (1997). The importance of management information systems. Library, 46(5), 318–327.
- Albu, N., & Albu, C. N. (2012). Factors associated with the adoption and use of management accounting techniques in developing countries: The case of Romania. Journal of International Financial Management and Accounting, 23(3), 245–276.
- Albu, C. N., & Alexe, S. (2009). The role of organizational learning in performance management. Contabilitatea, Expertiza si Auditul Afacerilor, 9, 42–46.
- Anderson, S. W., & Lanen, W. (1999). Economic transition, strategy and the evolution of management accounting practices: case of India. Accounting, Organizations and Society, 24(5–6), 379–412.
- Arsov, S., & Bucevska, V. (2017). Determinants of transparency and disclosure – evidence from post-transition economies. Economic Research-Ekonomska Istraživanja, 30(1), 745–760. doi: 10.1080/1331677X.2017.1314818
- Baron, R., & Byrne, D. (1991). Social psychology. Understanding human interaction (6th ed.). Boston, MA: Allyn and Bacon.
- Bjørnenak, T., & Olson, O. (1999). Unbundling management accounting innovations. Management Accounting Research, 10(4), 13–32. doi: 10.1006/mare.1999.0110
- Bruns, W. J., & McKinnon, S. M. (1992a). The information mosaic. Boston, MA: Harvard Business School Press.
- Bruns, W. J., & McKinnon, S. M. (1992b). Management information and accounting information: What do managers want? In M. J. Epstein (Ed.), Advances in management accounting (Vol. 1, pp. 55–80). Greenwich: Jail Press Inc.
- Bruns, W. J., & McKinnon, S. M. (1993). Information and managers: A field study. Journal of Management Accounting Research, 5, 84–108.
- Byrne, S., & Pierce, B. (2007). Towards a more comprehensive understanding of the roles of management accountants. European Accounting Review, 16(3), 469–498. doi: 10.1080/09638180701507114
- Chenhall, R. H. (2006). The contingent design of performance measures. In A. Bhimani (Ed.), Contemporary issues in management accounting (pp. 92–116), Oxford: Oxford University Press.
- Chenhall, R. H., & Morris, D. (1986). The impact of structure, environment, and interdependence on the perceived usefulness of management accounting systems. The Accounting Review, 61(1), 16–35. doi: 10.1016/0361-3682(94)90010-8
- Cutting, J. E. (1987). Perception and information. Annual Review of Psychology, 38, 61–90. doi: 10.1146/annurev.ps.38.020187.000425
- Definition of Management Accounting. (2008). Practice of management accounting. https://www.imanet.org.cn/uploads/resource/2015-11/1447061510-17551.pdf.
- DeLone, W. H., & McLean, E. R. (2003). The DeLone and McLean model of information system success: A ten-year update. Journal of Management Information Systems, 19(4), 9–30.
- Feleaga, N. (1996). Controverse contabile. Dificultati conceptuale si credibilitatea contabilitatii. Bucharest: Economica.
- Fleischman, G., Walker, K., & Johnson, E. (2010). A field study of user versus provider perceptions of management accounting system services. International Journal of Accounting & Information Management, 18(3), 252–285. doi: 10.1108/18347641011068992
- Glavan, M. E., Braescu, M., Dumitru, V., Jinga, G., & Laptes, R. (2007). The relevance and quality of the accounting information in the managerial decisions. Accounting and Management Information Systems, 6(Supplement), 103–115.
- Granlund, M., & Lukka, K. (1998). It’s a small world of management accounting practices. Journal of Management Accounting Research, 10, 151–179. doi: 10.1016/j.mar.2010.10.004
- Granlund, M., & Lukka, K. (1998). Towards increasing business orientation: Finnish management accountants in a changing cultural context Management Accounting Research, 9(2), 185–211.
- Ingram, M., & Margetis, S. (2010). A practical method to estimate the cost of equity capital for a firm using cluster analysis. Managerial Finance, 36(2), 160–167. doi: 10.1108/03074351011014569
- Jinga, G., & Dumitru, M. (2015). The Change in Management Accounting from an Institutional and Contingency Perspective: A Case Study for a Romanian Company. International Journal of Social, Behavioral, Educational, Economic, Business and Industrial Engineering, 9, 6, 1913–1920.
- Jinga, G., Dumitru, M., Dumitrana, M., & Vulpoi, M. (2010). Accounting systems for cost management used in the Romanian economic entities. Accounting and Management Information Systems, 9, 242–267.
- Jianu, I., & Jianu, G. (2012). The told and retold story of Romanian accounting. Journal of Accounting and Management Information Systems, 11(3), 391–423.
- Joseph, G. (2008). A rationale for stakeholder-based management in developing nations. Journal of Accounting & Organizational Change, 4, 136–161. doi: 10.1108/18325910810878946
- Johnson, H. T., & Kaplan, R. (1987). Relevance lost: The rise and fall of management accounting. Boston, MA: Harvard Business School Press.
- Kacprzyk, A., & Doryń, W. (2017). Innovation and economic growth in old and new member states of the European Union. Economic Research-Ekonomska Istraživanja, 30(1), 1724–1742. doi: 10.1080/1331677X.2017.1383176
- Khan, A. K., Bakkappa, B., Metri, B. A., & Sahay, B. S. (2009). Impact of agile supply chains' delivery practices on firms' performance: Cluster analysis and validation. Supply Chain Management: An International Journal, 14(1), 41–48. doi: 10.1108/13598540910927296
- Kim, K. K. (1989). User satisfaction: A synthesis of three different perspectives. Journal of Information Systems, Fall, 1–12.
- Laudon, K., & Laudon, J. (2006). Management information system. Managing the digital firm. Upper Saddle River, NJ: Prentice-Hall.
- Lääts, K., & Haldma, T. (2012). Changes in the scope of management accounting systems in the dynamic economic context. Economics and Management, 17(2), 441–447. doi: 10.5755/j01.em.17.2.2164
- Mia, L., & Chenhall, R. (1994). The usefulness of MAS functional differentiation and management effectiveness. Accounting, Organization and Society, 19(1), 1–13. doi: 10.1016/0361-3682(94)90010-8
- Mendoza, C., & Bescos, P. L. (2001). An explanatory model of managers’ information needs: Implications for management accounting. European Accounting Review, 10(2), 257–289. doi: 10.1080/09638180126636
- Nimtrakoon, S., & Tayles, M. (2015). Explaining management accounting practices and strategy in Thailand: A selection approach using cluster analysis. Journal of Accounting in Emerging Economies, 5(3), 269–298. doi: 10.1108/JAEE-02-2013-0012
- Nita, B. (2014). Sprawozdawczość zarządcza. Analizy i raporty wewnętrzne w controllingu. Warszawa: Wydawnictwo Naukowe PWN.
- Online Manual on Statistics. (2016). Stat soft electronic statistics textbook. http://www.statsoft.com/Textbook.
- Pierce, B., & O’Dea, T. (2003). Management accounting information and the needs of managers: Perceptions of managers and accountants compared. The British Accounting Review, 35(3), 257–290. doi: 10.1016/S0890-8389(03)00029-5
- Ristiono, R. J., & Michalak, J. M. (2018). Employee perceptions of organizational culture’s influence on their attitudes and behaviour. Journal of East European Management Studies, 23(2), 277–294. doi: 10.5771/0949-6181-2018-2-295
- Sadić, S., Puśkak, A., & Beganović, A. (2016). Information support model and its impact on utility, satisfaction and loyalty of user. The European Journal of Applied Economics, 13(2), 30–44.
- Saunders, J. A. (1980). Cluster analysis for market segmentation. European Journal of Marketing, 14(7), 422–435. doi: 10.1108/EUM0000000004918
- Simon, H. A., Guetzkow, H., Kozmetsky, G., & Tyndall, G. (1954). Centralization vs. decentralization in organizing the controller’s department, Houston, TX: Controllership Foundation.
- Šiška, L. (2016). The contingency factors affecting management accounting in Czech companies. Acta Universitatis Agriculturae et Silviculturae Mendelianae Brunensis, 64(4), 1320–1383. doi: 10.11118/actaun201664041383
- Strumickas, M., & Valanciene, L. (2009). Research of management accounting changes in lithuanian business organizations. Engineering Economics, 3(63), 26–32
- Szychta, A. (2008). Etapy ewolucji i kierunki integracji metod rachunkowości zarządczej. Łódź: Wydawnictwo UŁ.
- Szychta, A. (2018). Management accounting practices in developing countries since the 1990s: The case of Poland. Zeszyty Teoretyczne Rachunkowości, 2018(99), 119. doi: 10.5604/01.3001.0012.2936
- Szychta, A., & Dobroszek, J. (2016). Perception of management accounting and controlling by Polish authors in publications in 1990–2016. Advances in Economics Business and Management Research, 27, 450–467.
- The Growth of Polish and Romanian Economy. (2018) https://businessinsider.com.pl/finanse/makroekonomia/dynamika-pkb-polski-w-2018-r-prognozaoecd/brr2wljand https://businessinsider.com.pl/finanse/makroekonomia/rumunia-najszybszy-wzrost-gospodarczy-w-ue/hk85w58.
- Van der Veeken, H. J. M., & Wouters, M. J. F. (2002). Using accounting information systems by operations managers in a project company. Management Accounting Research, 13(3), 345–370. doi: 10.1006/mare.2002.0188
- Wnuk-Pel, T. (2014). Management accounting innovations. The case of ABC in Poland. Łódź: Wydawnictwo Uniwersytetu Łódzkiego.
- Zarzycka, E. (2016). Koncepcje i tendencje rozwoju zawodu specjalisty rachunkowości zarządczej. Wymiar krajowy i międzynarodowy. Łódź: Wydawnictwo Uniwersytetu Łódzkiego.