
 ?Mathematical formulae have been encoded as MathML and are displayed in this HTML version using MathJax in order to improve their display. Uncheck the box to turn MathJax off. This feature requires Javascript. Click on a formula to zoom.
Abstract
Reducing corruption has been one major challenge facing government and policy makers in Nigeria. This study employs the ARDL, CCR and FMOLS methods to assess the determinants of corruption in Nigeria over the period 1984–2016. The result of the cointegration test indicates that corruption and its determinants (economic development, political rights, military expenditure, rents, civil liberties and openness) have a long-run relationship. The results of the ARDL, CCR and FMOLS estimation demonstrate that economic development, political rights, military expenditure, rents, civil liberties and openness, are the main determinants of corruption in the long-run. Higher-economic development, greater civil liberties, more openness and higher military expenditure are related to lower corruption, but higher rents and political rights are associated with higher corruption. Based on these outcomes, this study recommends policies to promote economic development, civil liberties, political rights and openness, including reducing the reliance on the oil sector to curb corruption in Nigeria.
1. Introduction
Although nations across the globe face numerous challenges, corruption has been identified as a major problem both developed and developing countries continue to contend with. Corruption scandals have surfaced in countries with different political systems and varying levels of income (Ades & Di Tella, Citation1997). Evidences of corruption, however, abound in developing countries and transition nations (Aidt, Citation2003). In addition, it has been established that corruption is not only widespread in Sub-Saharan Africa (SSA) countries, the economies and citizens of the region are the worst hit by corruption (Gyimah-Brempong, Citation2002; Gyimah-Brempong & de Camacho, Citation2006).
There are two opposing views on the role corruption plays on the economy of a country. The first group argued that corruption tends to slowdown economic growth via reduction in human capital development in the form less spending on education and healthcare, misallocation of resources, inadequate domestic investment, less provisions of social amenities and transfers to the poor, and high inequality and poverty, among other things (see Abu, karim & Aziz, Citation2015a; Del Monte, & Papagni, Citation2007; Gupta, Davoodi, & Alonso-Terme, Citation2002; Gyimah-Brempong, Citation2002; Gyimah-Brempong & de Camacho, Citation2006; Habib & Zurawicki, Citation2001; Mauro, Citation1995; Mo, Citation2001; Nguyen & van Dijk, Citation2012; Wei, Citation2000). On the other hand, a few researchers including Leff (Citation1964) and Huntington (1968) opined that corruption promotes economic growth by increasing efficiency in countries where bureaucrats/government officials are inefficient and constitute barriers to investment growth. Thus, by bribing government or public officials, businessmen/investors spend less time in queue to obtain business permits and licences, including contract approvals. This leads to an increase in efficiency of the system, causing investment and production of goods and services to rise and consequently boosting economic growth.
There is no consensus among economists on the precise or comprehensive definition of corruption (Aidt, Citation2003). The meaning of corruption differs from one place to the other, and what is considered as corruption in a particular society might be viewed as the norm in another (Gyimah-Brempong, Citation2002). For example, Transparency International sees corruption as the abuse of entrusted power for private gain. On his part, Jain (Citation2001) considered corruption as the use of the power of public office for personal gain in such a manner that contravenes the rules of the game. In addition, Jain (Citation2001) categorised corruption into three namely – grand corruption which involves political elite, bureaucratic corruption which involves bureaucrats, and legislative corruption which involves how a legislator’s private interest influences legislative votes. These forms of corruption vary only in terms of the individual who engages in it. The consequence of any of this type of corruption is the same, and that is the misallocation of resources and reducing efficiency of the system (Gyimah-Brempong, Citation2002).
Nigeria like many developing countries has continued to face many social and economic problems. These include poor public spending on education and healthcare, high unemployment, low incomes and high level of poverty, rising insecurity, kidnapping, cattle rustling, and cultism, to mention just a few. A major factor that has been blamed for the poor standards of living in Nigeria is the massive corruption in the public sector. For instance, Abu (Citation2015) submitted that corruption is deep-rooted in almost every segment/section of the Nigerian economy including the various arms of government (that is, executive, legislature and judiciary). The ruling All Progressive Congress (APC) won the 2015 and 2019 Presidential elections on the promise that it will tackle corruption head-on, fight insecurity as well as developing the economy. In addition, the President (Muhammadu Buhari) has repeatedly said that ‘if Nigerians don’t kill corruption, corruption will kill Nigeria’. It is not surprising therefore, that the government is investigating alleged embezzlement of over $2billion that was meant to prosecute the war against insurgency and Boko-Haram by cabinet members and high-ranking government officials including political associates of the previous administration, the People’s Democratic Party (PDP). To this end, the former National Security Adviser (NSA) and Spokesperson of the PDP were apprehended and are currently standing trial. Similarly, the former Chief Justice of Nigeria (CJN) was suspended and he is been prosecuted for failing to declare his assets (properties and cash running into millions of dollars). Recently, the government anti-corruption fight paid-off as two former state Governors were convicted and sentenced to fourteen years in prison, respectively, on account of defrauding and/or embezzling funds belonging to their states.
In addition, the private sector which was believed to be less corrupt has been found culpable, as certain firms were allegedly used to siphoned or launder stolen monies by government officials. In line with this, some banks’ executives have been arraigned while others have been convicted. Similarly, foreign firms operating in Nigeria such as Halliburton and Sagem have been fingered in corruption related cases in the past. Moreover, the various reports of reputable international organisations such as the Transparency International (TI), Political Risk Service Group (PRS) and the World Bank (WB) have suggested that corruption thrives in Nigeria, with public officials using their power of office for private gain. In particular, the TI corruption perception index and ranking, the PRS International Country Risk Guide (ICRG) corruption index and the WB control of corruption indicator over the years show that Nigeria is one of the most corrupt nations in the world.
Despite its negative consequences, economists are yet to properly understand the steps that should be taken to reduce corruption (Ades & Di Tella, Citation1997). Furthermore, whereas researchers have established that corruption influences certain macroeconomic variables which include trade, underdevelopment, savings, investment, and growth, they have paid less attention to corruption determinants until recently (for example see Ali & Isee, Citation2003; Swaleheen, Citation2008; Zhang, Cao, & Vaughn, Citation2009). Moreover, most studies that were conducted to ascertain the determinants of corruption focused on a group of countries, employing either cross-section or panel data (see Ades & Di Tella, Citation1997; Ali & Isee, Citation2003; Elbahnasawy & Revier, Citation2012; Evrensel, Citation2010; Fisman & Gatti, Citation2002; Goel & Nelson, Citation2005; Iwasaki & Suzuki, Citation2012; Park, Citation2003; Serra, Citation2006; Triesman, Citation2000, Citation2007; Zhang et al., Citation2009).
Additionally, empirical research on the determinants of corruption at individual country level is very scanty. Interestingly, Nguyen and van Dijk (Citation2012) advocated for country-specific studies on corruption, because it can aid our understanding on why and how corruption affects the economy, and therefore provide policy prescription to governments to remedy the situation. In the same vein, Ali and Isee (Citation2003) opined that once the main drivers of corruption have been established, appropriate policy conclusions can be drawn from an empirical exercise, leading to the design and implementation of policies to checking and/or reducing the harmful impacts of corruption. Furthermore, Athukorala and Sen (Citation2004) argued that cross sectional studies are based on highly restrictive assumptions, and any results from them might not be acceptable by all. Therefore, they emphasised the need for studies that are country-specific.
Despite the high level of corruption in Nigeria, little has been done to empirically examine the determinants of corruption. Although the recent study by Akinpelu, Ogunseye, Bada, and Agbeyangi (Citation2013) on the determinants of corruption in Nigeria deserves some commendations, however, the study has certain weaknesses. In particular, the authors employed the Johansen’s cointegration approach even though the variables used in their analysis had a mixture of I(0) and I(1). In addition, the authors employed a small sample size. We believed that an appropriate estimation technique should be the Autoregressive Distributed Lag (ARDL) method. Also, it is a known fact that using time series data for estimation purpose can lead to problems such as serial-correlation and heteroscedasticity. But Akinpelu et al. (Citation2013) did not conduct any of these diagnostic tests making one to doubt the reliability of the reported results. Moreover, factors such as political rights and civil liberties that have been found to be important determinants of corruption in the literature were left out by Akinpelu et al. (Citation2013).
The present study is important and contributes to the existing literature for a number of reasons. First, this study employs different methods of analysis namely the ARDL, Canonical Cointegration Regression (CCR) and Fully Modified Ordinary Least Squares (FMOLS) to examine the determinants of corruption in Nigeria from 1984 to 2016. These methods have several advantages over the conventional cointegration technique used by Akinpelu et al. (Citation2013). These advantages are discussed in the econometric techniques section of this study. In addition, by using several estimation techniques (i.e., ARDL, CCR and FMOLS), we can ascertain the consistency and robustness of the results. Second, this study performs diagnostic tests including serial-correlation and heteroscedasticity, which Akinpelu et al. (Citation2013) failed to conduct to check the reliability of the results generated. Third, this study is the first to explore the role of political rights and civil liberties on corruption in Nigeria. Fourth, once the main factors that are responsible for high corruption in Nigeria have been established, then we can suggest appropriate policies to reduce corruption in Nigeria.
The objective of this study is to examine the determinants of corruption in Nigeria. Following the introduction, section two is the theoretical and empirical literature review. The third section consists of the model formulation and the data. Section four is the econometric techniques while results and discussion are taken up in the fifth section. The sixth section is for conclusion.
2. Literature review
2.1. Theoretical literature
There is no comprehensive theory that explains the linkage between corruption and its potential determinants. This makes it a bit difficult to come up with a theoretical model or employ an empirical method that is agreed to all researchers in examining the factors that affect corruption (Alt & Lassen, Citation2003; Goel & Nelson, Citation2011). Nevertheless, researchers have relied on a few theories when attempting to investigate the determinants of corruption. One of the theories is the tax compliance theory (Mookherjee & Png, Citation1989; Reinganum & Wilde, Citation1985). The theory proposes that one way to reduce corruption is through appropriate levels of auditing. Another theory that has been employed is the compensation theory (Becker & Stigler, Citation1974). The theory argues that payment of wages/salaries above the market clearing wages/salaries including monitoring the activities of the agents (government officials) from time to time can help to control corruption. There is also the social support theory (Cullen, Citation1994) which has its root in Lin’s (Citation1986) theory of mental illness and Braithwaite’s (1989) theory of shaming and reintegration. The theory suggests that high levels of social support raise citizens’ wellbeing and as a result lower crime rates (corruption) in a society.
In addition, two other approaches to checking or controlling corruption which have been proposed in the literature are the lawyer’s approach of Italy’s Judge, Antonio Di Pietro (Citation1994), and the economist’s approach of Rose-Ackerman (Citation1978), Ades and Di Tella (Citation1997) and Bliss and Di Tella (Citation1997). The lawyer’s approach advocates the enactment of stronger new laws including greater enforcement of existing laws to check corruption. It also argues that the judiciary should be given the power to grant immunity from prosecution offenders who cooperate during investigations. Last, the economist’s approach believes that corruption can be curbed via promotion of competition among firms and/or government officials.
Furthermore, the literature of criminal activity determinants (Becker, Citation1968) has been emphasised by authors such as Billger and Goel (Citation2009) and Goel and Nelson (Citation2010). Becker (Citation1968) suggested that individuals who give and take bribes weigh the benefits and costs of participating in criminal (or corrupt) activities. Examples of the benefits of engaging in corrupt acts include the favours that monopolist-bureaucrats can give as well as reducing red tape (Guriev, Citation2004; Shleifer & Vishny, Citation1993). On the other hand, some of the costs of corruption include arrest and punishment of corrupt individuals (Billger & Goel, Citation2009). Although, saddled with the responsibility of monitoring the activities of bureaucrats, anti-corruption agencies can also be corrupt (Banerjee, Citation1997).
Recently, scholars have also borrowed the ideas of the dynamic economic interaction model of social tolerance among groups proposed by Cerqueti, Correani, and Garofalo (Citation2013) to suggest ways corruption can be tackled (see Shi & Pan, Citation2018; Shi, Pan, & Peng, Citation2017). In explaining the social tolerance theory, Shi and Pan (Citation2018) opined that in an attempt to get integrated and be tolerated by the society, corrupt government officials must distribute aggregate wealth in a manner that the larger proportion/share of the wealth goes to the ordinary members of the society compared to the value that corrupt government officials receive. They further advised that corruption can be reduced via reforming economic and political institutions.
2.2. Empirical literature
Several efforts have been made to examine the major determinants of corruption. A considerable number of the studies focused on a group of countries, and employed either cross-section or panel data in their analysis. In essence, studies focusing on corruption determinants at individual country level are not many. For instance, Kolstad and Wiig (Citation2015) analysed the effect of democracy on corruption in a cross-country study during the 1946–2008 period, using the Ordinary Least Squares (OLS) and Instrumental Variable (IV) techniques. The results confirm that democracy reduces corruption. Other factors that reduce corruption include income level (captured by log of GDP per capita), democracy duration and democracy in conflict. In addition, Busse and Gröning (Citation2013) employed the two-step system-Generalized Method of Moments (system-GMM) estimator to analyse the relationship between governance and natural resource in 129 countries from 1984 to 2007. The results suggest that exports of natural resources promote corruption, while income level has a negative relationship with corruption.
Moreover, Elbahnasawy and Revier (Citation2012) examined corruption determinants in 150 countries over the 1998-2005 period using the Hausman and Taylor’s technique to estimate a random effects model that incorporates both the effects of corruption determinants that vary over time and those that are time-invariant. The results demonstrate that greater law enforcement and high-income level reduce corruption. Similarly, greater freedom of expression and accountability do have a negative and significant effect on corruption. On the other hand, corruption is not significantly affected by factors which include ethnic fractionalisation, natural resource abundance, dominant religious tradition, population size and political stability.
Furthermore, Kotera, Okada, and Samreth (Citation2012) examined the effect of government size and democracy on corruption across countries using OLS, IV and GMM estimators. The results suggest that income level, government size and democracy including government size-democracy interaction are negatively related to corruption. On their part, Iwasaki and Suzuki (Citation2012) employed random effects and fixed effects models to examine the determinants of corruption in transition economies using panel data covering the 1996–2006 period. The authors found that progress in the rule of law, democratisation and marketisation are effective ways to control corruption. Similarly, Nur-Tegin and Czap (Citation2012) used the Leamer’s Extreme Bounds Analysis and OLS with White-corrected robust standard errors to analyse the linkage between corruption and democracy, autocracy and political stability, across countries over the 2000–2009 period. The results reveal that corruption is less in unstable democracies compared to stable autocracies. In addition, income per capita has a positive effect on the corruption index.
Also, Arezki and Bruckner (Citation2011) investigated the impact of oil rents on corruption and state stability in a sample of 30 oil exporting nations using the least squares and system-GMM estimators over the 1992–2005 period. The authors found that an increase in oil rents has a positive and significant effect on corruption. Furthermore, oil rents do have a negative and significant impact on political rights, but a positive and significant relationship with civil liberties. Moreover, Goel and Nelson (Citation2011) evaluated corruption determinants in states in the U.S. using various estimation techniques. The results indicate that higher judicial employment encourages corruption. Besides, Southern states appear to be more corrupt, but higher Protestant population as well as corrections employment are not significant in influencing corruption. Geographically, Southern states were found to be more corrupt. In addition, Evrensel (Citation2010) examined corruption determinants in a sample consisting of 154 developed and developing countries, using cross-section OLS to analyse data that were 1998–2000 averages. The empirical results confirm that countries with slow economic growth, high-inflation rates, totalitarian political regimes, ineffective judicial systems and low levels of education, have high levels of corruption.
Moreover, Goel and Nelson (Citation2010) investigated the corruption effect of history, geography and government in a sample of almost 100 countries. The results of estimation reveal that democracy, income per capita, urbanisation, use of English common law system, and government size, are associated with lower corruption. Furthermore, Billger and Goel (Citation2009) assessed the determinants of corruption using recent cross-sectional data for almost 100 countries. The results of the OLS and quantile regression analyses indicate that greater economic freedom and larger government size do not reduce corruption significantly in the most corrupt countries. In addition, greater democracy appears to reduce corruption. Also, Triesman (Citation2007) examined the causes of corruption in a cross-national study, using the OLS regressions with White-corrected standard error and IV technique. The author’s findings suggest that more developed countries, with a free and widely read press, a long history of liberal democracy, more openness to trade, and a high proportion of women in government, are less corrupt. On the other hand, corruption is high in countries that experience unpredictable inflation, disruptive business regulations, and depend on fuel exports.
In addition, Del Monte and Papagni (Citation2007) evaluated the determinants of corruption in 20 regions of Italy over the period 1963–2001 using the Two Stage Least Squares (TSLS) approach. The results reveal that economic variables (i.e., government consumption and economic development) and political and cultural influences (i.e., party concentration, presence of voluntary organisations, and absenteeism at national elections) are significant determinants of corruption in Italy. Moreover, Serra (Citation2006) studied the determinants of corruption in 62 developed and developing counties using the Leamer’s Extreme-Bounds Analysis. The author discovered that corruption level is less in rich and more democratic countries, including countries that are predominantly Protestant. On the other hand, corruption is high in politically unstable countries. Another important determinant of corruption is a country’s colonial heritage.
Furthermore, Glaeser and Saks (Citation2006) employed the OLS and IV methods to assess the determinants and effects of corruption across states in the U.S. during the 1976–2002 period. The results show that corruption is less in wealthy and more educated states. In addition, racial fractionalisation and income inequality are important determinants of corruption, while corruption is not related to government size. Additionally, Gokcekus and Knörich (Citation2006) employed OLS and IV techniques to examine the effect of the level and quality of openness on corruption in 133 countries. The results show that both the level and quality of openness have a reducing impact on the level of corruption. In the same vein, high-income level as well as a free and open press have a significant effect on corruption. Goel and Nelson (Citation2005) found that the level of development, democracy and economic freedom do have a negative and significant effect on corruption in the U.S.
In addition, Gatti (Citation2004) investigated if the existence of obstacles to trade and capital flows is related to high corruption. The author did not find any clear association between corruption and openness. Furthermore, Brunetti and Weder (Citation2003) investigated the effect of a free press on corruption in 128 countries over the 1994–1998 period, using OLS and TSLS techniques. The results demonstrate that a higher press freedom leads to lower corruption. Similarly, Ali and Isee (Citation2003) examined the determinants of corruption in a cross-country study, using the OLS and TSLS. The authors found that education (secondary school enrolment), economic freedom, federalism and the rule of law have a negative and significant on corruption. However, government size and foreign aid have a positive and significant effect on the level of corruption. Furthermore, the coefficient of foreign aid and government expenditure interaction suggests that the marginal effect of government expenditure on corruption increases with the level of foreign aid.
Moreover, Fisman and Gatti (Citation2002) employed both OLS and TSLS methods to examine the effect of decentralisation on corruption in a sample of countries. The results demonstrate that decentralisation, government size and income per capita have a negative and significant effect on corruption. But population has a positive effect on corruption. Also, Triesman (Citation2000) attempted to answer the question ‘why perceived corruption appears to be higher in some countries than others, using the business risk surveys for the 1980s and 1990s periods. Employing the OLS and Weighted Least Squares (WLS) estimators, the author found that corruption is lower in more developed countries with high imports, predominantly protestant and a history of British rule. In addition, longer exposure to democracy tends to lower corruption, and corruption appears to be high in federal states. In addition, Ades and Di Tella (Citation1999) employed OLS, TSLS and fixed effects estimators to examine the effect of rents (fuels and mineral exports) and competition on corruption across countries. The results show that rents is associated with high corruption, and high competition (share of trade in GDP) reduces corruption. Furthermore, real-GDP per capita significantly reduces corruption.
Similarly, Ades and Di Tella (Citation1997) evaluated the effects of openness and independence of the judiciary including their interaction on corruption across countries using regression analysis. Other variables included in the corruption model are the level of development of the country (measured by income per capita, GDP), schooling, and political competition. The results suggest that corruption is higher in countries that are closed to foreign competition, and lack independence of the judiciary. Also, the results demonstrate that corruption tends to be less as a country opens up to foreign trade especially if it lacks a well-developed judicial system. A summary of empirical literature is reported in .
Table 1. A Summary of empirical literature on the determinants of corruption.
Looking at the existing literature, it is obvious that empirical studies on the determinants of corruption focused mainly on a group of countries, employing cross-sectional and/or panel data. However, country-specific studies on corruption determinants are relatively scarce. Moreover, the only empirical study on Nigeria by Akinpelu et al. (Citation2013) employed an inappropriate estimation method, that is, the Johansen cointegration method to estimate a small sample. In addition, Akinpelu et al. (Citation2013) failed to conduct important diagnostic tests such as serial-correlation and heteroscedasticity tests, making us to doubt the reliability of their results. Moreover, their study left out important variables such as political rights and civil liberties which have been found to affect corruption. Thus, this study contributes to the existing literature by examining the determinants of corruption in Nigeria, using three methods of estimation including the ARDL, CCR and FMOLS techniques. These methods are more appropriate compared to the conventional cointegration method employed by Akinpelu et al. (Citation2013). Furthermore, this study conducts post estimation tests including serial-correlation and heteroscedasticity tests to validate the reliability of the estimated results. Last, the methods were used to ascertain the consistency and robustness of the results that are generated.
3. Model specification and data
To examine the drivers of corruption in Nigeria, this study considers certain variables which have been cited in the literature as potential factors influencing the level of corruption in a country.
One of the determinants of corruption (COR) is the level of economic development (GDPC) measured by GDP per capita. Theoretically, at high-income level countries have the financial resources to deploy to fight corruption (Busse & Gröning, Citation2013). For example, if anti-graft agencies are properly funded, it will facilitate detection, investigation, arrest and prosecution of offenders. In addition, the propensity to pay and collect bribes is less in wealthy countries because there is more equity in income distribution (Asongu, Citation2013; Serra, Citation2006).
Moreover, rich countries invest more resources in educating their citizens. When people are well educated, they are more aware of their rights and duties, including having less desire to engage in corrupt acts (Goel & Nelson, Citation2010). Some studies have established that economic development (proxied by GDP per capita) has a negative and significant effect on corruption (see Goel & Nelson, Citation2010; Knack & Azfar, Citation2003; Lederman, Loayza, & Soares, Citation2005; Montinola & Jackman, Citation2002; Serra, Citation2006; Triesman, Citation2000, Citation2007).
The level of democracy measured by political rights (POL) and/or civil liberties (CIV) can also affect the level of corruption (Billger & Goel, Citation2009; Goel & Nelson, Citation2010; Serra, Citation2006; Triesman, Citation2007; Zhang et al., Citation2009). Political rights enable people to participate freely in the political process, as well as exercising the right to vote, competing for public office and electing representatives who enact policies and at the same time are accountable to the electorate. In the same vein, civil liberties promotes freedom of expression, rights to association and organisation, including personal autonomy and application of rule of law. Moreover, democracy aids human development and it increases social supports for the wellbeing of the populace (Zhang et al., Citation2009). These in turn reduce corruption in a country. On the other hand, corruption tends to be high in undemocratic nations because checks and balances are inadequate. On their part, Goel and Nelson (Citation2010) opined that corruption is less in democratic countries since there is high tendency that corrupt government officials or politicians might lose their office if they are caught.
In addition, greater democracy encourages political competition, and elected officials are not only accountable to the electorate but can be punished/sactioned by the electorate if they do not keep to promises including fighting corruption (Aidt, Citation2003; Aidt & Dutta, Citation2001; Asongu, Citation2013; Del Monte & Papagni, Citation2007; Ferejohn, Citation1986). Similarly, Kunicová (Citation2006) contended that undemocratic nations can provide grounds for rent-seeking activities and as a result raise corruption level. Some researchers have used sum or averages of political rights and civil liberties as a measure of democracy in their analysis (for instance, see Billger & Goel, Citation2009; Goel & Nelson, Citation2005, Citation2010; Kotera et al., Citation2012). Yet others employed only political rights as a proxy for democracy (Ades & Di Tella, Citation1997, Citation1999). But Arezki and Bruckner (Citation2011) seperated political rights and civil liberties in their study. Studies have discovered that democracy is negatively and significantly related to the level of corruption (see Billger & Goel, Citation2009; Goel & Nelson, Citation2010; Triesman, Citation2007). In line with Arezki and Bruckner (Citation2011), this study looks at the effect of the individual measure of democracy, that is, POL and CIV, on corruption.
Economic rents (RENT) can influence the magnitude of corruption in a country. It has been argued that a country’s level of corruption will be high, especially if there are larger economic rents for government officials to appropriate or capture (Ades & Di Tella, Citation1999; Gatti, Citation2004; Bulte & Damania, Citation2008; Lane & Tornell, Citation1996; Leite & Weidman, Citation1999; Triesman, Citation2007). For instance, Ades and Di Tella (Citation1999) hypothesised that if an economy is dependent on natural resources or raw materials (such as fuels, metals and minerals) and export these resources mainly, it will promote rents and consequently corruption will be high. Since the exploitation and management of natural resources is conducted mainly by multinationals and public enterprises, it provides opportunities for rents-seeking activities and corruption by both foreign firms and local leaders (Gatti, Citation2004; Leite & Weidman, Citation1999; O’Higgins, Citation2006).
Moreover, proceeds from the sale of these resources are usually not declared and a greater proportion of it (proceeds) is stolen due to the involvement of many intermediaries. Moreso, because the proceeds are foreign currency dominated, the incentives for stealing and hiding these revenues in secret foreign accounts are high (O’Higgins, Citation2006). Unfortunately, these activities often go undetected. Prior studies have established that rents encourage corruption (see Ades & Di Tella, Citation1999; Arezki & Bruckner, Citation2011; Triesman, Citation2000).
Military expenditure (MLE) can dictate the movement in the level of corruption. In Nigeria (and other ECOWAS countries) where military dictators headsway for many years, they institutionalised corruption (Abu & Karim, Citation2015; Abu, Karim, & Aziz, Citation2015b). The Transparency International (Citation2002) cited in d’Agostino, Dunne, and Pieroni (Citation2012) submitted that allegations of corruption against the military sector are expected from time to time due to the relatively low competition in the military sector. The monopolistic nature of the sector provides the grounds or avenue for secrecy in the award or approval of contracts, leading to rent-seeking and corruption. The implications of rent-seeking and corruption include the high cost of conducting military services and crowding out of private sector investment, all of which slow down the growth of the economy. The study by d’Agostino et al. (Citation2012) concluded that rent-seeking in the military sector promotes corrupt activities, which in turn hinders the performance of the economy.
Openness to trade (OPEN) measured by total trade (or sum of exports and imports) to GDP ratio can also influence the level of corruption (Ades & Di Tella, Citation1999; Gatti, Citation2004; Gokcekus & Knörich, Citation2006; Krueger, Citation1974; Serra, Citation2006). If a more corrupt country engages in trade with a less corrupt country, the highly corrupt country will be encouraged to reduce its level of corruption over time. For instance, with trade domestic firms are subject to competition with their foreign counterparts. This competition can force the domestic economy to reduce rent-seeking behaviour, and as a result lower the level of corruption (Ades & Di Tella, Citation1999). On the other hand, trade protection/restriction does not only reduce the volume of trade, it might provide opportunities for collusive interactions between private agents (or importers) and public (or customs) officials. This collusion can lead to payment and collection of bribes (Ades & Di Tella, Citation1999; Gatti, Citation2004; Krueger, Citation1974). Studies have found that the level of openness is negatively and significantly related to corruption (see Ades & Di Tella, Citation1997, Citation1999; Gokcekus & Knörich, Citation2006).
Based on the issues discussed above, the corruption model is specified as:
(1)
(1)
where L denotes the logarithm of the variables. Time series data were used for the period 1984-2016. The period was chosen due the availability of data particularly on corruption. The data are measured as follow. COR is proxied by the Political Risk Service International Country Risk Guide (ICRG) corruption index, GDPC is measured as real-GDP per capita, RENT is measured as mineral rents as a % of GDP, MLE is measured as military expenditure, OPEN is measured as the sum of imports and exports to GDP ratio, while POL and CIV were proxied by the Freedom House’s political rights and civil liberties indexes, respectively. The data on the variables were collected from various sources as follows. The data on military expenditure, GDP per capita, imports and exports, GDP, and mineral rents were collected from the World Development Indicators; political rights and civil liberties from the Freedom House, and corruption from the ICRG.
4. Econometric techniques
4.1. Unit root test
Prior to the estimation of the relationship between corruption and its potential determinants, a unit root test was conducted to establish the stationarity property of the variables. Two tests were employed to perform the unit root test. They are the Augmented Dicker Fuller (ADF) and Philips–Perron (PP). The unit root (stationarity) test results reported in illustrate that OPEN and CIV are stationary at level (i.e., they have no unit root). That is, the variables are I(0). On the other hand, COR, LGDPC, POL, LMLE and RENT, are stationary only after taking their first difference. In essence, the series are I(1). Therefore, the series/variables are a combination of I(0) and (1).
Table 2. Results of unit root tests.
4.2. ARDL-bounds testing to cointegration
Given that the series are I(0) and I(1), the ARDL bounds testing method to cointegration (Pesaran & Shin, Citation1999; Pesaran, Shin, & Smith, Citation2001) was employed to check if there is cointegration or long-run relationship between corruption and its determinants.
The ARDL method has several advantages over other cointegration techniques including the residual-based technique (Engle & Granger, Citation1987) and the maximum likelihood test (Johansen, Citation1988; Citation1991; Johansen & Juselius, Citation1990). These advantages have been discussed in details (see Abu, Citation2017, Citation2019). First, the ARDL technique can be used to investigate the existence of cointegration between variables whether the order of integration is I(0), I(1), or a combination of both. Second, whereas the residual-based technique such as the Johansen cointegration approach requires a large sample for validity, the ARDL method is superior when investigating cointegration using small samples. Third, the ARDL method permits the variables to have different lags, but this is not often the case when using the conventional cointegration methods. Last, the ARDL method employs a single reduced-form equation to estimate the short-run and long-run parameters of the model simultaneously, while the conventional cointegration techniques use a system of equations.
The ARDL model is specified as follows:
(2)
(2)
The procedure of the ARDL approach starts with the conduct of bounds test for the null hypothesis of no cointegration (H0) against the alternative hypothesis (H1) for the individual equation stated as follows:
In deciding whether there is cointegration between/among the series, the computed F-statistic is compared with upper critical bounds value [I(1)] or lower critical bounds value [I(0)]. If the computed F-statistic is greater than the [I(1)], we conclude that the series are cointegrated. But if the computed F-statistic is smaller than the [I(0)], we conclude that there is no cointegrating relationship between the series. In addition, if the F-statistic falls between the [I(1)] and [I(0)], then our inference would be inconclusive.
If it is established that a cointegrating or long-run relationship exists between the variables, then the long-run coefficients can estimated using the long-run model that is expressed as follows:
(4)
(4)
Additionally, if it is confirmed that a long-run relationship exists between the variables, then the short-run coefficients can be estimated by using the error correction model that is specified as follows:
(5)
(5)
The is the error correction variable. The coefficient of the
lagged by one period,
, represents the speed of adjustment back to equilibrium in the long-run following a deviation from the equilibrium in the short-run.
4.3. Alternative estimation techniques (CCR and FMOLS)
In order to check the consistency and robustness of the results that are generated using the ARDL, two other estimation techniques were employed. The methods are the Canonical Cointegration Regression (CCR) of Park (Citation1992) and the Fully Modified Ordinary Least Squares (FMOLS) of Hansen and Phillips (Citation1990).
The CCR and FMOLS like the ARDL method have certain advantages over the conventional cointegration techniques (see Alhassan & Fiador, Citation2014; Montalvo, Citation1995; Narayan & Narayan, Citation2004; Singh, Citation2015). For example, the CCR and FMOLS methods solve problems of endogeneity bias and serial-correlation. In addition, both techniques generate more efficient results in small samples compared to the conventional cointegration methods.
The FMOLS, as a single cointegrating vector, is used to estimate long-run relationships. The FMOLS modifies the least squares by taking into consideration the serial-correlation and endogeneity effects in the regressors that emanate from the presence of the cointegrating relationship. The procedure begins with the conventional OLS estimation, and it makes a nonparametric correction that accounts for the endogeneity and serial-correlation that might arise in the OLS residuals (Singh, Citation2015). The CCR method implements the OLS estimation by transforming variables using the long-run covariance matrix of the error terms so that the OLS estimator is asymptotically efficient (Beard, Jackson, Kaserman, & Kim, Citation2010). The CCR and FMOLS estimations were performed using Bartlett Kernel with Newey-West fixed bandwidth.
5. Results and discussion
5.1. Results of bounds testing to cointegration
The results of the bound testing to cointegration in reveal that the F-statistic (18.4932) is larger than the [I(1)].
Table 3. Results of bounds tests to cointegration.
This finding implies that the variables are cointegrated. Thus, there is a long-run relationship between corruption and its determinants.
5.2. Results of selected long-run and short-run models
In estimating the ARDL model the optimal lag-length (2,2,1,2,2,2,2) was suggested by the Akaike Information Criterion (AIC). The results of the selected long-run and short-run models are shown in .
Table 4. Results of ARDL model.
The results demonstrate that economic development has a positive and significant effect on the corruption index at 1%, in the long-run. A 1% increase in economic development leads to an improvement in the corruption index (a reduction in corruption) by 2.53 point. Similarly, economic development has a positive and significant effect on the corruption index at 1%, in the short-run. A 1% increase in economic development leads to an increase in the corruption index (a reduction in corruption) by 1.41 point. This finding is consistent with the outcomes of prior studies (see Busse & Gröning, Citation2013; Elbahnasawy & Revier, Citation2012; Goel & Nelson, Citation2010; Knack & Azfar, Citation2003; Kolstad & Wiig, Citation2015; Kotera et al., Citation2012; Lederman et al., Citation2005; Montinola & Jackman, Citation2002; Serra, Citation2006; Triesman, Citation2000, Citation2007).
The results also illustrate that political rights has a negative and significant effect on the corruption index at 5%, in the long-run. An increase in political rights by 1 index point leads to a deterioration in the corruption index (an increase in corruption) by 0.09 point. In the same vein, political rights do have a negative and significant effect on the corruption index at 1%, in the short-run. An increase in political rights by 1 index point leads to a deterioration in the corruption index (an increase in corruption) by 0.05 point. This finding suggests that greater political rights do not to reduce corruption. Past studies indicated that political rights have no significant relationship with the level of corruption (see Ades & Di Tella, Citation1997). In the same vein, Ades and Di Tella (Citation1999) submitted that the lack of political rights appears to be related to lower corruption. Furthermore, Serra (Citation2006) reported a very weak relationship between political rights and corruption. Moreover, Triesman (Citation2007) argued that democracy might encourage corruption is the short-term as the depth of democracy increases.
Military expenditure has a positive and significant effect on the corruption index at 1%, in the long-run. A 1% increase in military expenditure leads to an improvement in the corruption index (a reduction in corruption) by 0.40 point. But military expenditure has a negative and significant effect on the corruption index at 1%, in the short-run. A 1% increase in military expenditure leads to a deterioration in the corruption index (an increase in corruption) by 0.27 point. This finding is in line with the claim that rent-seeking in the military sector encourage corrupt acts (see d’Agostino et al., Citation2012).
Rents has a negative and significant effect on the corruption index at 1%, in the long-run. A 1% increase in mineral rents leads to a deterioration in the corruption index (an increase in corruption) by 24.33 point. Similarly, rents has a negative and significant effect on the corruption index at 5%, in the short-run. A 1% increase in mineral rents leads to a deterioration in the corruption index (an increase in corruption) by 2.94 point. This finding is consistent with the outcome of prior research (see Ades & Di Tella, Citation1999; Arezki & Bruckner, Citation2011; Triesman, Citation2007).
Openness has a positive and significant effect on the corruption index at 5%, in the long-run. A 1% increase in openness leads to an improvement in the corruption index (a reduction in corruption) by 3.26 point. Also, openness has a positive and significant effect on the corruption index at 5%, in the shortrun. A 1% increase in openness leads to an improvement in the corruption index (a reduction in corruption) by 0.38 point. This outcome support the ones discovered in previous studies (see Ades & Di Tella, Citation1997, Citation1999; Gokcekus & Knörich, Citation2006; Triesman, Citation2007).
Civil liberties has a positive and significant effect on the corruption index at 1%, in the short-run. An increase in civil liberties by 1 index point leads to an improvement in the corruption index (a reduction in corruption) by 0.09 point. This finding is consistent with the outcome of prior studies (see Elbahnasawy & Revier, Citation2012). Thus, greater freedom of expression will reduce corruption.
The coefficient of the error correction term lagged by one period [ECM-1] is –0.9725 and statistically significant at 1%. This illustrates that 97.25% of the deviations from equilibrium is corrected within a year.
The positive association between economic development and low level of corruption suggests that, at high level of income Nigeria can commit huge financial resources to tackle corruption. In addition, proper funding of anti-corruption agencies such as the EFCC and ICPC will strengthen and aid them in their detection of corrupt acts, including investigation and prosecution of offenders. Moreover, at high-income level income inequality is less and people are more educated. The equitable distribution in income implies that individuals can meet their basic needs, and the tendency to engage in corrupt acts will be less. Besides, education promotes awareness and encourages citizens to know their rights and duties. These discourage them from engaging in corrupt practices, as well as encouraging them to participate in any activities that will lead to exposing corrupt individuals.
The negative association between political rights index and corruption index suggests that at higher political rights corruption gets worsen. After many years of military dictatorship, Nigeria returned to democracy in 1999 and there has been a gradual improvement in political rights. In addition, electorates are gradually having their say during political processes and electioneering periods in terms of the right to vote and be voted for. In addition, some elected officials/political office holders have lost their office or failed in their bid to be re-elected on account of poor performance in the office. For instance, the former ruling party (PDP) was voted out office after sixteen (16) years, that is, 1999–2015, on account of poor economic performance, rising insecurity and corruption. However, corruption still persists and remains high particularly in the public sector. There are allegations of corruption, lack of accountability and transparency in the dealings of the state-owned oil firm, Nigerian National Petroleum Corporation (NNPC). Also, many state Governors owe salaries (to their employees) for several months even though the Federal Government has given bail-outs to states to ensure regular payment of workers’ salaries. Recently, the Transparency International reported that corruption is high in Nigeria. In essence, despite the improvement in political rights, corruption remains a serious issue in Nigeria.
The positive relationship between greater civil liberties and lower corruption demonstrates that greater freedom of expression, rights to association and organisation, and entrenchment of rule of law will lower corruption in Nigeria. The emergency of groups such as human rights activists and non-governmental organisations (NGOs) demanding transparency and accountability, including investigation of allegations of corruption against certain government agencies and political office holders might reduce the tendency of government officials to engage in corruption.
The positive linkage between openness and lower corruption level suggests that increases in openness to foreign trade with other countries will expose domestic firms to competition with their foreign counterparts. Moreover, more openness to trade (lesser protection) will reduce the tendency for collusive behaviour between importers and customs officials, leading to a reduction in the payment and collection of bribes, and as a result lowering corruption level.
The negative connection between high rents and worsening corruption indicates that Nigeria’s dependence on natural resources or minerals such as oil and fuels as major revenue sources, encourages rent-seeking behaviour between foreign oil firms operating in Nigeria, the NNPC and top government officials. One major issue that has always been discussed in Nigeria is the lack of transparency and accountability in the dealings and operations of the NNPC.
The short-run negative relationship between military expenditure and rising corruption demonstrates that the monopolistic nature (lack of competition) of the military or defence sector will promote secrecy in contracts awards and approvals. The absence of private sector involvement promotes rent-seeking and corruption. The trial of former NSA and certain senior military officers who served in the last government/administration shows the extent of corruption in Nigeria military. On the other hand, the long-run positive association between military expenditure and improvement in the corruption index (lower corruption) suggests that high military spending reduces corruption in Nigeria in the long-run. Thus, given the commitment of the government and anti-graft agencies in the fight against corruption with respect to the military sector, corruption can be brought under control in the future. Therefore, when offenders are arrested and punished, it will deter military personnel from engaging in corrupt practices.
5.3. Results of diagnostic tests
The diagnostic tests results reported in show that the LM test statistic and corresponding probability value for serial-correlation, normality, and heteroscedasticity are 4.8476(0.0559), 0.7738(0.6791), and 3.0977(0.0529), respectively.
Table 5. ARDL diagnostic tests.
These findings indicate that the ARDL model does not have serial-correlation and heteroscedasticity problems, including passing the normality test at 5%.
Furthermore, the cumulative sum of recursive residuals (CUSUM) and cumulative sum of squares of recursive residuals (CUSUMQ) tests were conducted to ascertain the stability of the parameters over the studied period. If the plots of CUSUMQ breaks in the lower or upper bounds, instability of the parameters will be said to have occurred (Greene, Citation2003; Tang & Lean, Citation2007). The plots in and are shown to fall within the boundaries.
Figure 1. Cumulative sum of recursive residuals plots. Source: Authors’ calculation.
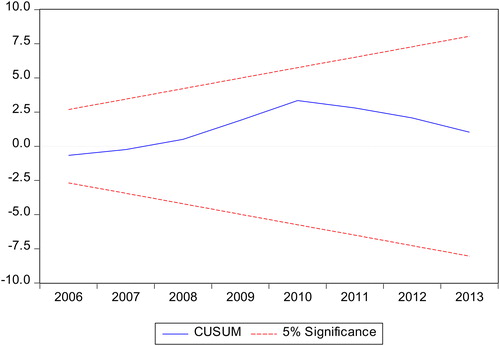
Figure 2. Cumulative sum of squares of recursive residuals plots. Source: Authors’ calculation.
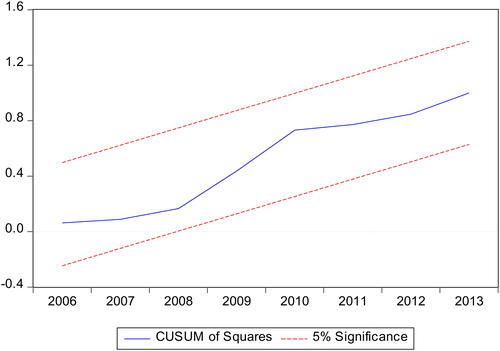
Thus, the results of the stability test confirm that the long-run parameters are stable.
5.4. Results of alternative estimation techniques
The results of CCR and FMOLS estimations () are similar to the ones generated from the ARDL model (except for the openness variable). Both CCR (Panel C) and FMOLS (Panel D) results demonstrate that higher economic development, increases in military expenditure and greater civil liberties are associated with less corruption, while rents and political rights tend to worsen corruption in Nigeria, in the long-run.
Table 6. Results of FMOLS and CCR models.
Overall, the results of the ARDL, CCR and FMOLS estimations are similar in many respects, and thus increase our confidence that the estimates generated are consistent and robust.
6. Conclusion
This study examines the determinants of corruption in Nigeria, from 1984 to 2016. Using the bounds testing method to cointegration, the results show that there is a long-run relationship between corruption and its determinants (economic development, political rights and civil liberties, military expenditure, rents, and openness). The results of the ARDL, CCR and FMOLS estimation illustrate the main determinants of corruption in Nigeria in the long-run to include economic development, political rights civil liberties, military expenditure, rents and openness. Greater economic development, more civil liberties and openness, as well as increases in military expenditure reduce corruption, while increases in rents and greater political rights encourage corruption in the long-run. Furthermore, economic development, civil liberties and openness have a reducing impact on corruption, while political rights, military expenditure, and oil rents encourage corruption in Nigeria in the short-run. Based on these findings, this study recommends policies that will promote economic development, civil liberties and openness, including reducing the reliance on the oil sector to curb corruption in Nigeria.
In particular, government and policymakers should employ policies to promote economic development so as to reduce corruption. This can be achieved via increased investment in public works and infrastructure. In addition, efforts should be made to boost (and sustain growth of) domestic production of goods and services. These will lead to employment creation as well as raising income generating opportunities, and as a result lower corruption.
Second, government should promote civil liberties and freedom of speech. This will encourage the citizens to not only demand for accountability and transparency, but also to expose corrupt government officials. In addition, although political rights appear not to lower corruption in the long-run, authorities should promote political rights. Greater political rights will promote political competition, and encourage citizens to vote and/or be voted for. In addition, electorate can punish corrupt officials via voting them out of office or making sure they are not re-elected.
Third, while one will expect that a policy of reducing military expenditure is required to curb corruption, the ongoing security challenges and attacks on many communities by insurgents, including kidnapping and cattle rustling, among other things, demand an increase in military spending in Nigeria. Proper funding of the military will help to restore peace in Nigeria. Relative peace will promote economic activities and raise income over the long term. As stated earlier, when people earn high income they will be reluctant to engage in corrupt acts. In addition, government should ensure that due process is followed during contracts bidding, approvals and awards with respect to military purchases.
Fourth, efforts should be geared towards diversifying the economy to reduce Nigeria’s reliance on the oil sector as a major revenue earner to the government. In addition, the state-owned oil corporation (NNPC) should be encouraged to embrace transparency and accountability in its entire operations. This will results in a reduction in rent-seeking behaviour and corrupt practices which have become a common feature of the oil sector in Nigeria.
Last, government should take steps to open up the economy more and expose domestic firms to foreign competition. Greater competition in turn will reduce rent-seeking behaviour and corruption.
Disclosure statement
No potential conflict of interest was reported by the authors.
References
- Abu, N. (2015). The effects of corruption and political instability on savings: The case of the Economic Community of West African States (An unpublished PhD Thesis submitted). Othman Yeop Abdullah Graduate School of Business, Universiti Utara Malaysia.
- Abu, N. (2017). Does Okun’s law exist in Nigeria? Evidence from ARDL bounds testing approach. Contemporary Economics, 11(2), 131–144. doi:10.5709/ce.1897-9254.232
- Abu, N. (2019). Inflation and unemployment trade-off: A re-examination of the Phillips curve and its stability in Nigeria. Contemporary Economics, 14(1), 1–20.
- Abu, N., & Karim, M. Z. A. (2015). The causal relationships among corruption, political instability, economic development and foreign aid: Evidence from the Economic Community of West African States. Contemporary Economics, 10(1), 20–33. doi:10.5709/ce.1897-9254.159
- Abu, N., Karim, M. Z. A., & Aziz, M. I. A. (2015a). Low savings rates in the economic community of West African States (ECOWAS): The role of corruption. Journal of Economic Cooperation and Development, 36(2), 63–90.
- Abu, N., Karim, M. Z. A., & Aziz, M. I. A. (2015b). Corruption, political instability and economic development in the Economic Community of West African States (ECOWAS): Is there a causal relationship? Contemporary Economics, 9(1), 45–60. doi:10.5709/ce.1897-9254.159
- Ades, A., & Di Tella, R. (1997). The new economics of corruption: A survey and some new results. Political Studies, 45(3), 496–515. doi:10.1111/1467-9248.00093
- Ades, A., & Di Tella, R. (1999). Rents, competition and corruption. American Economic Review, 89(4), 982–993. doi:10.1257/aer.89.4.982
- Aidt, T. S. (2003). Economic analysis of corruption: A survey. Economic Journal, 113, 632–652.
- Aidt, T. S., & Dutta, J. (2001). Policy compromises: Corruption and regulation in a dynamic democracy. Working Paper, University of Cambridge.
- Akinpelu, Y. A., Ogunseye, T. O., Bada, O. T., & Agbeyangi, B. A. (2013). The socio-economic determinants of corruption in Nigeria. European Journal of Humanities and Social Sciences, 19(1), 923–938.
- Alhassan, A. L., & Fiador, V. (2014). Insurance-growth nexus in Ghana: An autoregressive distributed lag bounds cointegration approach. Review of Development Finance, 4(2), 83–96. doi:10.1016/j.rdf.2014.05.003
- Ali, A. M., & Isee, H. S. (2003). Determinants of corruption: A cross-country comparison. Cato Journal, 22(3), 449–466.
- Alt, J. E., & Lassen, D. (2003). The political economy of institutions and corruption in American states. Journal of Theoretical Politics, 15(3), 341–365. doi:10.1177/0951692803015003006
- Arezki, R., & Bruckner, M. (2011). Oil rents, corruption, and state stability: Evidence from panel data regressions. European Economic Review, 55(7), 955–963. doi:10.1016/j.euroecorev.2011.03.004
- Asongu, S. A. (2013). Fighting corruption in Africa: Do existing corruption-control levels matter? International Journal of Development Issues, 12(1), 36–52. doi:10.1108/14468951311322109
- Athukorala, P., & Sen, K. (2004). The determinants of private saving in India. World Development, 32(3), 491–503. doi:10.1016/j.worlddev.2003.07.008
- Banerjee, A. V. (1997). A theory of misgovernance. The Quarterly Journal of Economics, 112(4), 1289–1332. doi:10.1162/003355300555484
- Beard, T. R., Jackson, J. D., Kaserman, D., & Kim, H. (2010). A time‐series analysis of U.S. kidney transplantation and the waiting list: Donor substitution effects and “dirty altruism”. AUWP Working Paper Series, 2010/01.
- Becker, G. S. (1968). Crime and punishment: An economic approach. Journal of Political Economy, 76(2), 169–217. doi:10.1086/259394
- Becker, G., & Stigler, G. (1974). Law enforcement, malfeasance and the compensation of enforcers. The Journal of Legal Studies, 3(1), 1–19. doi:10.1086/467507
- Billger, S. M., & Goel, R. K. (2009). Do existing corruption levels matter in controlling corruption? Cross-country quantile regression estimates. Journal of Development Economics, 90(2), 299–305. doi:10.1016/j.jdeveco.2008.07.006
- Bliss, C., & Di Tella, R. (1997). Does competition kill corruption? Journal of Political Economy, 105(5), 1001–1023. doi:10.1086/262102
- Braithwaite, J. (1989). Crime, shame, and reintegration. Cambridge: Cambridge University Press.
- Brunetti, A., & Weder, B. (2003). A free press is bad news for corruption. Journal of Public Economics, 87(7–8), 1801–1824. doi:10.1016/S0047-2727(01)00186-4
- Bulte, E., & Damania, R. (2008). Resources for sale: Corruption, democracy and the natural resource curse. B.E. Journal of Economic Analysis & Policy, 8(1), 1–28.
- Busse, M., & Gröning, S. (2013). The resource curse revisited: Governance and natural resources. Public Choice, 154(1–2), 1–20. doi:10.1007/s11127-011-9804-0
- Cerqueti, R., Correani, L., & Garofalo, G. (2013). Economic interactions and social tolerance: A dynamic perspective. Economics Letters, 120(3), 458–463.
- Cullen, F. T. (1994). Social support as an organizing concept for criminology. Justice Quarterly, 11(4), 527–559. doi:10.1080/07418829400092421
- d’Agostino, G., Dunne, J. P., & Pieroni, L. (2012). Corruption, military spending and growth. Defence and Peace Economics, 23(6), 591–604. doi:10.1080/10242694.2012.663579
- Del Monte, A., & Papagni, E. (2007). The determinants of corruption in Italy: Regional panel data analysis. European Journal of Political Economy, 23, 379–396. doi:10.1016/j.ejpoleco.2006.03.004
- Di Pietro, A. (1994, December 1). Ruling sets back Italian graft inquiry. Financial Times, 3.
- Elbahnasawy, N. G., & Revier, C. F. (2012). The determinants of corruption: Cross-country panel data analysis. The Developing Economies, 50(4), 311–333. doi:10.1111/j.1746-1049.2012.00177.x
- Engle, R. F., & Granger, C. W. J. (1987). Co-integration and error correction: Representation, estimation and testing. Econometrica, 55(2), 251–276. doi:10.2307/1913236
- Evrensel, A. Y. (2010). Institutional and economic determinants of corruption: A cross-section analysis. Applied Economics Letters, 17(6), 551–554. doi:10.1080/13504850802297814
- Fisman, R., & Gatti, R. (2002). Decentralization and corruption: Evidence across countries. Journal of Public Economics, 83(3), 325–345. doi:10.1016/S0047-2727(00)00158-4
- Ferejohn, J. (1986). Incumbent performance and electoral control. Public Choice, 50(1–3), 5–25. doi:10.1007/BF00124924
- Gatti, R. (2004). Explaining corruption: Are open countries less corrupt? Journal of International Development, 16(6), 851–861. doi:10.1002/jid.1115
- Glaeser, E. L., & Saks, R. E. (2006). Corruption in American. Journal of Public Economics, 90(6–7), 1053–1072. doi:10.1016/j.jpubeco.2005.08.007
- Goel, R. K., & Nelson, M. A. (2005). Economic freedom and political freedom: Cross-country influences on corruption. Australian Economic Papers, 44(2), 121–133. doi:10.1111/j.1467-8454.2005.00253.x
- Goel, R. K., & Nelson, M. A. (2010). Causes of corruption: History, geography and government. Journal of Policy Modeling, 32(4), 433–447. doi:10.1016/j.jpolmod.2010.05.004
- Goel, R. K., & Nelson, M. A. (2011). Measures of corruption and determinants of US corruption. Economics of Governance, 12(2), 155–176. doi:10.1007/s10101-010-0091-x
- Gokcekus, O., & Knörich, J. (2006). Does quality of openness affect corruption? Economics Letters, 91(2), 190–196. doi:10.1016/j.econlet.2005.11.015
- Greene, W. (2003). Econometric analysis (5th ed.). New Jersey, NJ: Prentice Hall.
- Guriev, S. (2004). Red tape and corruption. Journal of Development Economics, 73(2), 489–504. doi:10.1016/j.jdeveco.2003.06.001
- Gupta, S., Davoodi, H., & Alonso-Terme, R. (2002). Does corruption affect income inequality and poverty? Economics of Governance, 3(1), 23–45. doi:10.1007/s101010100039
- Gyimah-Brempong, K. (2002). Corruption, economic growth, and income inequality in Africa. Economics of Governance, 3(3), 183–209. doi:10.1007/s101010200045
- Gyimah-Brempong, K., & de Camacho, S. M. (2006). Corruption, growth, and income distribution: Are there regional differences? Economics of Governance, 7(3), 245–269. doi:10.1007/s10101-005-0008-2
- Habib, M., & Zurawicki, L. (2001). Country-level investments and the effect of corruption—Some empirical evidence. International Business Review, 10(6), 687–700. doi:10.1016/S0969-5931(01)00038-5
- Hansen, B. E., & Phillips, P. C. (1990). Estimation and inference in models of cointegration: A simulation study. Advances in Econometrics, 8, 225–248.
- Huntington, S. P. (1968). Political order in changing societies. New Heaven, CN: Yale University Press.
- Iwasaki, I., & Suzuki, T. (2012). The determinants of corruption in transition economies. Economics Letters, 114(1), 54–60. doi:10.1016/j.econlet.2011.08.016
- Jain, A. K. (2001). Corruption: A review. Journal of Economic Surveys, 15(1), 71–121. doi:10.1111/1467-6419.00133
- Johansen, S. (1988). Statistical analysis of cointegration vectors. Journal of Economic Dynamics and Control, 12(2–3), 231–254. doi:10.1016/0165-1889(88)90041-3
- Johansen, S. (1991). Estimation and hypothesis testing of cointegration vectors in Gaussian vector autoregressive models. Econometrica, 59(6), 1551–1580. doi:10.2307/2938278
- Johansen, S., & Juselius, K. (1990). Maximum likelihood estimation and inference on cointegration–With applications to the demand for money. Oxford Bulletin of Economics and Statistics, 52(2), 169–210.
- Knack, S., & Azfar, O. (2003). Trade intensity, country size and corruption. Economics of Governance, 4(1), 1–18. doi:10.1007/s101010200051
- Kolstad, I., & Wiig, A. (2015). Does democracy reduce corruption? Democratization, 23(7), 1198–1215. doi:10.1080/13510347.2015.1071797
- Kotera, G., Okada, K., & Samreth, S. (2012). Government size, democracy, and corruption: An empirical investigation. Economic Modelling, 29(6), 2340–2348. doi:10.1016/j.econmod.2012.06.022
- Krueger, A. (1974). The political economy of the rent-seeking society. American Economic Review, 64(3), 291–303.
- Kunicová, J. (2006). Democratic institutions and corruption: Incentives and constraints in politics. In International handbook on the economics of corruption (Vol. 1, pp. 140–160). Northampton, MA: Edward Elgar Publishing.
- Lane, P., & Tornell, A. (1996). Power, growth, and the voracity effect. Journal of Economic Growth, 1(2), 213–241. doi:10.1007/BF00138863
- Lederman, D., Loayza, N. V., & Soares, R. R. (2005). Accountability and corruption: Political institutions matter. Economics and Politics, 17(1), 1–35. doi:10.1111/j.1468-0343.2005.00145.x
- Leff, N. H. (1964). Economic development through bureaucratic corruption. American Behavioral Scientist, 8(3), 8–14. doi:10.1177/000276426400800303
- Leite, C., & Weidman, J. (1999). Does mother nature corrupt? Natural resources, corruption, and economic growth. IMF Working Papers, 99/85. doi:10.5089/9781451850734.001
- Lin, N. (1986). Conceptualizing social support. In N. Lin, A. Dean, & W.M. Edsel (Eds.), Social support, life events, and depression (pp. 17–30). Orlando, FL: Academic Press.
- Mauro, P. (1995). Corruption and growth. The Quarterly Journal of Economics, 110(3), 681–712. doi:10.2307/2946696
- Mo, P. H. (2001). Corruption and economic growth. Journal of Comparative Economics, 29(1), 66–79. doi:10.1006/jcec.2000.1703
- Montalvo, J. G. (1995). Comparing cointegrating regression estimators: Some additional Monte Carlo results. Economics Letters, 48(3–4), 229–234. doi:10.1016/0165-1765(94)00632-C
- Montinola, G. A., & Jackman, R. W. (2002). Sources of corruption: A cross-country study. British Journal Political Science, 32, 147–170.
- Mookherjee, D., & Png, I. (1989). Optimal auditing, insurance and redistribution. The Quarterly Journal of Economics, 104(2), 399–415. doi:10.2307/2937855
- Narayan, S., & Narayan, P. K. (2004). Determinants of demand for Fiji’s exports: An empirical investigation. The Developing Economies, 42(1), 95–112. doi:10.1111/j.1746-1049.2004.tb01017.x
- Nguyen, T. T., & van Dijk, M. A. (2012). Corruption, growth, and governance: Private vs. state-owned firms in Vietnam. Journal of Banking & Finance, 36(11), 2935–2948. doi:10.1016/j.jbankfin.2012.03.027
- Nur-Tegin, K., & Czap, H. J. (2012). Corruption: Democracy, autocracy, and political stability. Economic Analysis and Policy, 42(1), 51–66. doi:10.1016/S0313-5926(12)50004-4
- O’Higgins, E. R. (2006). Corruption, underdevelopment, and extractive resource industries: Addressing the vicious cycle. Business Ethics Quarterly, 16(2), 235–254. doi:10.5840/beq200616224
- Park, H. (2003). Determinants of corruption: A cross-national analysis. Multinational Business Review, 11(2), 29–48. doi:10.1108/1525383X200300010
- Park, J. Y. (1992). Canonical cointegrating regressions. Econometrica, 60(1), 119–143. doi:10.2307/2951679
- Pesaran, M. H., & Shin, Y. (1999). An autoregressive distributed lag modeling approach to cointegration analysis. In Strom, S. (Ed.), Econometrics and economic theory in the 20th century (pp. 371–413). The Ragnar Frisch centennial symposium econometric society monographs (No. 31). Cambridge: Cambridge University Press.
- Pesaran, M. H., Shin, Y., & Smith, R. (2001). Bound testing approaches to the analysis of level relationship. Journal of Applied Econometrics, 16(3), 289–326. doi:10.1002/jae.616
- Reinganum, J. F., & Wilde, L. L. (1985). Income tax compliance in a principal-agent framework. Journal of public economics, 26(1), 1–18.
- Rose-Ackerman, S. (1978). Corruption: A study in political economy. New York, NY: Academic Press.
- Serra, D. (2006). Empirical determinants of corruption: A sensitivity analysis. Public Choice, 126(1–2), 225–256. doi:10.1007/s11127-006-0286-4
- Shi, Y., & Pan, M. (2018). Dynamics of social tolerance on corruption: An economic interaction perspective. Romanian Journal of Economic Forecasting, XXI(2), 135–141.
- Shi, Y., Pan, M., & Peng, D. (2017). Replicator dynamics and evolutionary game of social tolerance: The role of neutral agents. Economics Letters, 159, 10–14. doi:10.1016/j.econlet.2017.07.005
- Shleifer, A., & Vishny, R. W. (1993). Corruption. The Quarterly Journal of Economics, 108(3), 599–617. doi:10.2307/2118402
- Singh, T. (2015). Trade openness and economic growth in Canada: An evidence from time-series tests. Global Economy Journal, 15(3), 361–407. doi:10.1515/gej-2014-0009
- Swaleheen, M. (2008). Corruption and saving in a panel of countries. Journal of Macroeconomics, 30(3), 1285–1301.
- Tang, C. F., & Lean, H. H. (2007). Is Phillips curve stable in Malaysia? New empirical evidence. Malaysian Journal of Economic Studies, 44(2), 95–105.
- Transparency International. (Ed.). (2002). Corruption in the official arms trade. London: Transparency International.
- Triesman, D. (2000). The causes of corruption: A cross-national study. Journal of Public Economics, 76(3), 399–457. doi:10.1016/S0047-2727(99)00092-4
- Triesman, D. (2007). What have we learned about the causes of corruption from ten years of cross-national empirical research? Annual Review of Political Science, 10, 211–244.
- Wei, S.-J. (2000). How taxing is corruption on international investors? Review of Economics and Statistics, 82(1), 1–11. doi:10.1162/003465300558533
- Zhang, Y., Cao, L., & Vaughn, M. S. (2009). Social support and corruption: Structural determinants of corruption in the world. Australian and New Zealand Journal of Criminology, 42(2), 204–217. doi:10.1375/acri.42.2.204