
 ?Mathematical formulae have been encoded as MathML and are displayed in this HTML version using MathJax in order to improve their display. Uncheck the box to turn MathJax off. This feature requires Javascript. Click on a formula to zoom.
Abstract
To understand the development track of credit risk research clearly and discover the hidden internal connections between literatures, this article utilises the scientific information measurement software – CiteSpace – to conduct a scientometric analysis (citation analysis, co-citation analysis and co-occurrence analysis) of 2,384 articles on credit risk from Web of Science (W.o.S.) during 1998 and 2017. According to the research results, some useful conclusions can be drawn as follows: (1) Credit risk research has become interdisciplinary and subject involved are ‘Business Finance’, ‘Economics’, ‘Operations Research Management Science’, ‘Mathematics Interdisciplinary Applications’; (2) The U.S., Europe, and Asia make the majority of contributions and there are numerous collaborations among countries; (3) The key researchers with influence and authority in this field mainly are Merton Robert Cox and Jarrow Robert Alan; (4) ‘Rollover risk’, ‘Arbitrage-free pricing’, ‘Default cycle’, ‘Credit risk evaluation’ and ‘Correlated default’ are the major research area; (5) ‘Crisis’, ‘Contagion’, ‘Monetary policy’, ‘Counterparty risk’ and ‘Systemic risk’ have become major research hotspot currently. Finally, we hope this scientometric analysis can provides some inspiration for credit risk researchers.
1. Introduction
Credit has the dual function of stabilising market order and increasing capital utilisation rate in market economic activities. Good credit is the basic condition for the market to develop steadily, but there will inevitably be credit risk in the transaction process, especially in the era of cloud payment and virtual payment. Credit risk, also known as counterparty risk or performance risk, refers to the risk that the counterparty does not perform on the debt due, which is not only in the loan, but also in the business of guarantee, acceptance and securities investment. The small credit risk affects the operation and efficiency of the market, and the big one will trigger a credit crisis, affecting social and economic development. Credit risk can be said to be one of the most challenging problems the market faces, and relevant research literature is growing rapidly.
Some scholars have made progress in the field of credit risk research by analysing it from various angles. First, some researchers focused on the measurement and evaluation of credit risk. For example, Baesens et al. (Citation2003) proposed neural network rule extraction and decision tables to establish an advanced and user-friendly decision-support systems for credit risk evaluation and management, while Woźniak, Graña, and Corchado (Citation2014) suggested that institutional investors are supposed to assess credit risk by using a combination of quantitative information such as option models and qualitative assessments. Further, Dahiya, Handa, and Singh (Citation2017) presented a feature selection-based hybrid-bagging algorithm (F.S.-H.B.) for improved credit risk evaluation. Second, risk contagion is also one of the research objects of many scholars, including Hatchett, Li, and Wang (Citation2009) presented a simple, solvable model to investigate effects of credit contagion on the default probability of individual firms; Chen, He, and Li (Citation2016) introduced an evolving network model of credit risk contagion and discussed the impact of average fitness of credit risk contagion, the risk aversion sentiments, and the ability to resist risk of credit risk holders on financial market credit risk contagion. Third, some researchers tend to combine credit risk research with specific reality. For instance, Grobys and Haga (Citation2015) proposed a market-wide credit risk factor for the U.S. stock market and investigated its properties that are dependent on economic conditions; Salim, Arjomandi, and Dakpo (Citation2016) used a by-production approach that integrates credit risk to monitor bank efficiency; Cerrato et al. (Citation2017) demonstrated that the market factors are key inputs for the effective management of the systemic credit risk in the banking sector. Apart from this, García-Céspedes and Moreno (Citation2017) proposed a simple multi-period credit risk model and used Taylor expansion approximations to estimate the multi-period loss distribution. Most scholars are professional, but different personal background and subjective preference leads to the lack of quantitative analysis of the literature metrology in this area.
In other words, although there are many publications related to credit risk, few people can understand the overall structure of the credit risk knowledge landscape accurately. Therefore, it is necessary to study credit risk with the help of a quantitative analysis tool CiteSpace. CiteSpace is a Java-based information measurement software which designed to clarify the knowledge evolution structure and to detect emerging trends and transient patterns in the scientific literature. It has been widely used to identify hot topics in the field of science and technology (Small, Boyack, & Klavans, Citation2014), present analyses in recommendation systems (Kim & Chen, Citation2015), introduce the development of aggregation operator (Yu, Citation2015), obtain visualisation in the international energy policy research (Wang, Nathwani, & Wu, Citation2016), review cloud computing algorithms (Ruan, Chan, Zhu, Wang, & Yang, Citation2016), research non-point source pollution (Xiang, Wang, & Liu, Citation2017), make a review of urban planning research for climate change (Jiang, Hou, Shi, & Gui, Citation2017), show the knowledge mapping on hospitality research (Li, Ma, & Qu, Citation2017), and reveal the citation landscape of some specific journals (Yu, Xu, Kao, & Lin, Citation2018).
Currently, CiteSpace is popular in academia, but it is not known that CiteSpace is used to analyse the relevant literature on the credit risk research domain. In order to provide a systematic and objective description for credit risk knowledge development, this study uses CiteSpace software to conduct a quantitative analysis of 2,386 articles from Web of Science (W.o.S.) in 1998–2017. Through research, we hope to achieve the following: (1) to understand the cooperation relationship of authors, institutions and countries in the field of credit risk research; (2) to identify the most cited and most noteworthy references, authors, and journals; and (3) to clarify the structure of knowledge development and emerging trends in the field of discipline.
The remainder of this article is as follows: Section 2 describes data collection and current status (number of publications, subject categories and research directions) in the credit risk research domain. Then a comprehensive analysis of the research results, which includes citation analysis (authors, institutions, and countries), co-citation analysis (documents, authors and journals), and co-occurrence analysis (keywords), is provided in Sections 3, 4, and 5 respectively. Finally, Section 6 summarises the key conclusions and proposes future expectations.
2. The current status of credit risk research
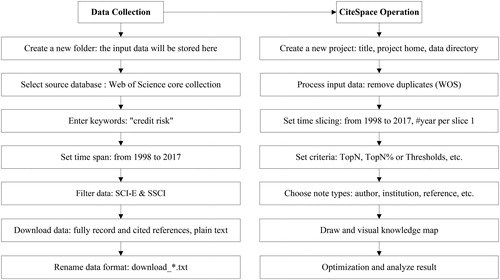
The objective of this study is to carry out a scientometrics analysis of credit risk research. The relevant literature data is obtained through the literature retrieval method (including title, abstract, subject words, keywords and references, etc.), and will be the database for knowledge mapping. It is of great significance to choose a reputable and comprehensive bibliographic database to provide a wide range of high-quality articles as a reliable source. The data selected in this study is from Science Citation Index Expanded (S.C.I.-E.) and Social Sciences Citation Index (S.S.C.I.) in the W.o.S. core collection. This database is relatively comprehensive and the exported data can be identified by CiteSpace directly. Because the CiteSpace software data format requirements are based on W.o.S. text data and it is updated as the data format in the I.S.I. database changes. CiteSpace software can import data from WoS database and PubMed database for visual analysis directly. Meantime, it also provides nine kinds of data converters, namely W.o.S., C.N.K.I., C.S.S.C.I., arXiv, Derwent, N.S.F., S.C.O.P.U.S., S.D.S.S., Project D.X., to convert data from other databases. Furthermore, determining an appropriate keyword to select articles from the bibliographic database is essential. This process should focus on the representativeness and validity of keywords.
The timespan of credit risk research is from 1998 to 2017. The main reason for choosing this period is that 20 years of literature data is representative and there will be no situation that affects the efficiency of the software due to too much data. In addition, since 2018 year is not over yet, in order to maintain data integrity, the deadline is 2017. The specific details are summarised as follows:
By filtering out some record types, such as program files and editing materials, and limiting only in reviews or articles to eliminate the ‘noise’ of databases, a total of 2,386 related articles were published with credit risk terms in the titles, index terms, or abstracts, from 1998 to 2017. The number of publications per year is shown in . The overall trend increase can be observed. The number of publications on credit risk research increases from 12 in 1998 to 224 in 2017, which indicates that the research on credit risk has gradually attracted the attention of scholars. According to the trend of the column chart, we can divide it into three periods:
Figure 1. The number of published articles per year in credit risk research (1998–2017).
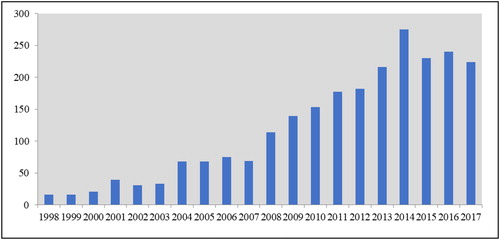
1998–2003 (start-up period): At this stage, the number of articles published each year is less than 50, and the growth is relatively slow. It is the starting point for attention being paid to credit risk.
2004–2007 (initial development period): In 2004, the number of articles increased suddenly, and in the following four years, it remained steady, with slight fluctuations around 70 articles.
2008–2017 (rapid development period): Similar to 2004, the number of published articles on credit risk increased rapidly in 2008 to above 100, and remained stable for a period of time until it increased sharply again in 2014, reaching 275, but it began to show a slight downward trend in 2017.
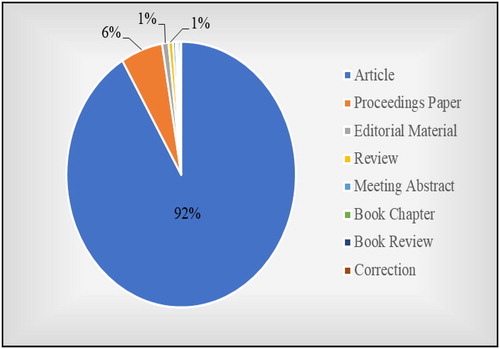
There are eight different file types that make up all the documents of credit risk research, such as, Articles, Proceedings papers, Editorial materials, Reviews, Meeting abstracts, Book chapters, Book reviews, and Corrections. The detailed document type is shown in .
Figure 2. The documents types in credit risk research (1998–2017).
Research on credit risk has become multidisciplinary according to the categories distribution. presents a broad summary of the top 10 categories in the credit risk research area. It can be seen clearly that ‘Business Finance’ is the most popular category with 1,167 publications, accounting for 48.910% of the total publications. ‘Economics’ is the second most popular category after ‘Business Finance’, with 1,124 publications, accounting for 47.108% of the total publications. Followed by ‘Operations Research Management Science’ (280), ‘Mathematics Interdisciplinary Applications’ (233), ‘Management’ (214), ‘Social Sciences Mathematical Methods’ (204), ‘Statistics Probability’ (197), ‘Computer Science Artificial Intelligence’ (152), and the number of publications on ‘Business’ and ‘Mathematics Applied’ are below 100. Compared with , we found that some categories correspond to the research direction.
Table 1. The top 10 subject categories of W.o.S. in credit risk research (1998–2017).
Table 2. The top 10 research directions of W.o.S. in credit risk research (1998–2017).
shows the top 10 research directions in credit risk research. Among them, ‘Business Economics’ is the main research direction currently, at 75.943%. In addition, other research directions with a total of more than 10% are ‘Mathematics’ and ‘Operations Research Management Science’, while research directions such as ‘Government Law’, ‘Physics’ and ‘Science Technology other Topics’ have fewer publications.
The article is the most direct embodiment of the subject research direction. The top 20 most used articles on W.o.S. in credit risk research (1998–2017) are listed in and the number of uses is counted, starting from 2013. These articles have been published in recent years, and six articles are from Expert Systems with Applications. Furthermore, the research directions of Economics, Operational Research, and Information Science and so on, are involved in these articles, which correspond to and .
Table 3. The top 20 most used articles of W.o.S. in credit risk research (1998–2017).
Scientometrics analysis (citation analysis, co-citation analysis and co-occurrence analysis) can demonstrate the macroscopic structure of scientific knowledge visually. The relationship between research frontiers and basic knowledge can be ascertained through analysing a series of visual maps (collaboration network, co-citation network and co-occurrence network) drawn by CiteSpace software. It should be noted that the input data needs to be processed by the ‘remove duplicates’ function of CiteSpace software before running. Finally, a total of 2,384 data is retained. In order to illustrate this process logically, a work-flow diagram has been provided in .
Figure 3. Work-flow diagram of credit risk research.
3. Citation analysis in credit risk research
To solve more complex scientific problems and stimulate innovative thinking, the cooperation between countries, institutions and scholars in various research fields is required. This study has drawn collaboration maps (author collaboration network, institution collaboration network, country collaboration network and geographical collaboration network) based on the collected literature data which will help to discover those scientific researchers, institutions and countries that deserve attention and their social relations.
3.1. Author collaboration network analysis in credit risk research
The author collaboration network can examine the cooperative strength and mutual relationship between different authors, as shown in . There are 256 nodes and 160 links, each node means an author, the size of the node represents the number of times the author is cited, and the width of the line indicates the number of collaborative articles. The overall density of the network is only 0.0049, which signifies that this network diagram is not compact enough. summarises the top 20 authors based on cooperative frequency. The frequency of Jeanblanc M in the first place is 11, the first time to appear in a cooperative relationship in 2004, followed by Lucas A, with the frequency of 10 and first appearance being 2005. Their collaboration history can be clearly seen in . The cooperative frequency of other scholars all are below 10 and the time that they started working with other scholars is late. It indicates that the scholars conducting the credit risk study are more dispersed, and they have weak academic links.
Figure 4. A visualisation of the author collaboration network.
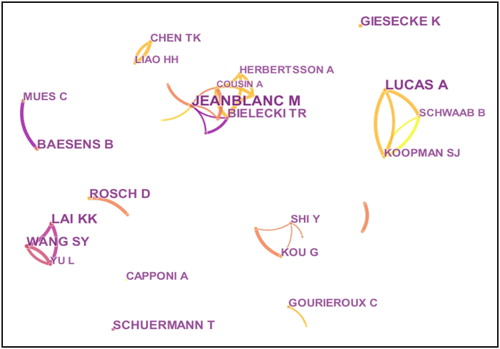
Figure 5. Collaboration history of two authors.
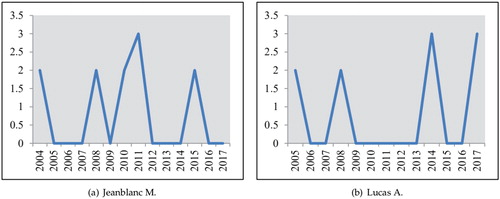
Table 4. Top 20 authors based on frequency in credit risk research.
3.2. Institution collaboration network analysis in credit risk research
The institution collaboration network consisted of 335 nodes, 407 links and the overall density is 0.0073. As shown in , each node represents a different institution. The size of the node represents the number of documents issued by the organisation. The larger the node, the more documents are distributed by the organisation. Among them, the node representing New York University is the largest. Moreover, the links represent the cooperation relationship between the organisations. The more links, the closer the cooperation between the organisations. We can find that the links between the various institutions are complex, and the colour is mainly yellow, indicating that there are more close relationships and carried out in recent years. Besides, the outermost purple circle of the node reflects the centrality of each institution. It suggests the proportion of the shortest path through the node in the shortest path between all other vertices in the network. If the ratio is larger, the purple circle is thicker, demonstrating that the node has a high centrality, and the institution has a higher status in the field. Combined with , the nodes representing New York University have the thickest purple circle, and its centrality is 0.19. Other institutions with a purple aperture include Columbia University (0.16), National Bureau of Economic Research (0.12) and European Central Bank (0.11), which means that these institutions have great influence and are worthy of attention. Furthermore, among the 20 mentioned institutions in , nine were from the U.S., five from China, two each from England and Germany. Toronto and the Czech Republic each have one. New York University in the U.S. ranks first, with 49 publications. Occupying second position is the Chinese Academy of Sciences, with 28 publications. Other institutions with more than 20 publications include the University of Toronto (26), Columbia University (26), National Bureau of Economics Research (25), the University of Southampton (25), Stanford University (23), the European Central Bank (23), and the City University of Hong Kong (20).
Figure 6. A visualisation of the institution collaboration network.
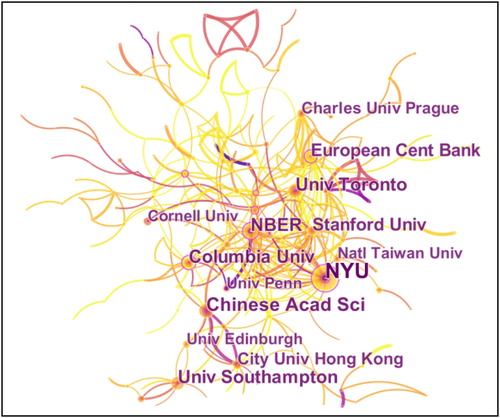
Table 5. Top 20 institutions based on frequency in credit risk research.
3.3. Country collaboration network analysis in credit risk research
A total of 54 nodes and 262 links makes up the country collaboration network. The overall density is 0.1831 and the nodes represent countries or regions (). There is much cooperation among countries or regions in the late twentieth and early twenty-first centuries according to the direct connection of nodes. The top 20 countries or territories that accounted for the major part of the total output contribution are listed in . The U.S. is the largest contributor, publishing 723 articles, followed by the People’s Republic of China (281), England (274), and Germany (244), while the frequency of other countries’ publications is below 200. In terms of centrality strength, the centrality of the U.S. remains the first place (0.49), followed by England (0.37), indicating that their mediating role in the field of credit risk research is more obvious and they have played a vital role in establishing contacts with other countries. It is interesting that though Spain and the Netherlands’ publications ranked tenth and twelfth respectively, their centrality is the same as that of Germany, which ranks fourth, with 0.12. On the contrary, the centrality of the People’s Republic of China, which is ranked second in the frequency of publications, is only 0.05, and the centrality of the Taiwan region is 0.00. This means that the Asia still lacks influence in this field.
Figure 7. A visualisation of the country collaboration network.
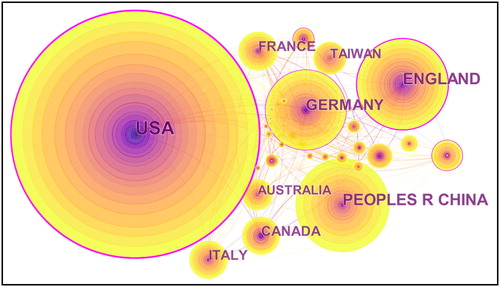
Table 6. Top 20 countries/territories based on frequency in credit risk research.
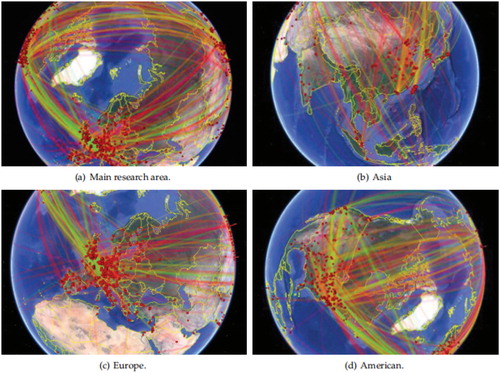
3.4. Geographical collaboration network analysis in credit risk research
A geographic information map is the interaction between CiteSpace software and Google Maps. We can understand the geographical distribution of a study quickly and its academic cooperation through the networks. The red dot represents the specific geographical distribution of credit risk research. The greater the density of red dots, the more research is happening here. The lines between the red dots represent the cooperation between the authors in the institutions of the corresponding countries and the different colours correspond to cooperation time. It is obvious that the U.S. and European countries are major contributors to credit risk research and the distribution of research in Europe is the most intensive (). In addition, Europe, the U.S., and Asia have formed a triangular zone for cooperation. As far as Asia is concerned, China, South Korea, and Japan have more research in the field of credit risk (b). These results are consistent with the conclusions drawn in and .
Figure 8. Geographical collaboration network in credit risk research.
4. Co-citation analysis in credit risk research
Co-citation analysis can reveal the internal relations and laws of scientific literature and describe the dynamic structure of scientific development. It refers to the fact that two documents establish links with one or more other documents and can be used for research on document relations, literature retrieval, and literature structure research. For the two documents that have a co-citation relationship, the co-citation characteristics determine that they are always in a passive position. The relationship between them is always waiting for other documents to be established. Therefore, it is more adaptable to certain current research objects having constantly changing and developing characteristics. Credit risk research is just a dynamic science field that is constantly changing. This article has conducted the co-citation analysis of document, author and journal to investigate the development track of credit risk research. We expect to understand the knowledge base and obtain a leading role in this field.
4.1. Document co-citation network analysis in credit risk research
In general, the traditional document review based on narrative is qualitative, mainly depend on individual judgements and explanations, while CiteSpace software can visualise this non-descriptive judgement. These two methods complement each other and make the study more convincing. Document co-citation analysis can identify key or core literature in the field of credit risk research. shows the full shot of document co-citation network. This document co-citation network consisted of 648 nodes and 2293 links, and the density of the entire network map is 0.0109. These citation rings represent the citation history of each article. The colour of the citation tree-rings corresponds to the cited time. The thickness is proportional to the number of citations in the corresponding time partition. Using multivariate statistical analysis methods such as cluster analysis, the intricate co-citation network relationship between many analysis objects is simplified into a relatively small number of groups and visually represented. The results obtained after the clustering of the literature are displayed in the form of a timeline fisheye diagram and are presented in . The colour of the citation tree-rings transitions from cool to warm means the continuous advancement of scientific knowledge intuitively. Yellow citation tree-rings are the current research hotspot. The entire network is divided into 85 clusters, and these main clusters are labelled by index terms from their own citers and are summarised with ‘#’ on the right side of . It should be noted that it uses title terms and a log-likelihood ratio (L.L.R.) weighting algorithm to label the clusters. L.L.R. is an algorithm to calculate and determine each type of labels, which presents core concept of each cluster with professional words (Fang, Yin, & Wu, Citation2017). These extracted primary clusters with ‘#’ reflect the research frontiers of the discipline’s development. Therefore, ‘Rollover risk’, ‘Arbitrage-free pricing’, ‘Default cycle’, ‘Credit risk evaluation’, ‘Correlated default’, ‘Credit portfolio model’, ‘Interest rate risk’, ‘Systemic risk’, ‘Quantifying credit risk’, ‘Asset price’, ‘capital structure’ and ‘feature selection’ are the main research area in the knowledge field of credit risk. In detail, the results of top 10 clusters are summarised in . Size implies the numbers of the publications in the cluster. The largest cluster (#0) contains 96 members’ references, followed by cluster (#1), which has 82 members’ references. Silhouette is an index to measure the homogeneity of a cluster, the higher the silhouette score, the better of the homogeneity. When the silhouette score is equal to 0.7, the clustering result is considered to be highly reliable. When the silhouette score is greater than 0.5, the clustering result is reasonable. The silhouette score of the largest 10 clusters listed in are all above 0.7, implying that these clusters are efficient and convincing. Mean represents the average year of the published documents of the regarding cluster. It can be used to judge whether the cluster is new or old (Yu & Xu, Citation2017). Cluster (#0) is the latest, indicating that ‘Rollover risk’ is a research hotspot in the current research field.
Figure 9. A visualisation of the document co-citation network.
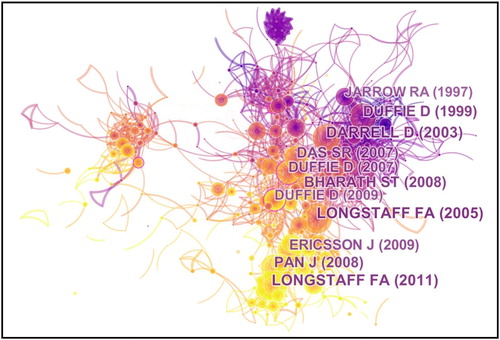
Figure 10. A timeline map of the references in credit risk research.
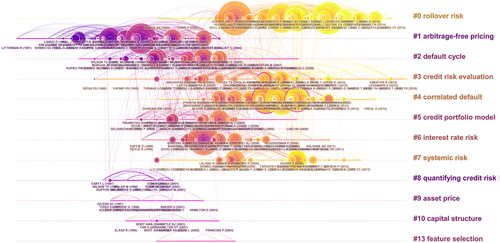
Table 7. Top 10 clusters based on size in credit risk research.
shows the top 20 most cited references, with more than 38 citations. The listed references are the most cited documents from the 2,384 documents retrieved in this article and not from the most cited documents in W.o.S. or Google Scholar. These cited documents reflect the knowledge base, which is the reference trajectory of the research frontier in the literature. Among the 20 references listed, an article entitled ‘Corporate yield spreads: Default risk or liquidity? New evidence from the credit default swap market’ in cluster (#0) by Longstaff et al. in the Journal of Finance is the most cited article with 67 citations. The article used information from credit default swaps to measure the size of defaults and non-defaults in corporate spreads and found that most corporate spreads are due to default risk. At the same time, they discussed the relationship between non-defaulting parts and specific non-liquidity measures and macroeconomic measures of bond market liquidity. It is a core literature in credit risk research. Furthermore, we believe research frontiers represent the development of a research field. Those articles that cite these well used references constitute the research frontiers. For example, lists the top 20 articles citing the previously mentioned article by Longstaff et al. These citing articles are generally recently published. The evolution of scientific knowledge in the field of credit risk research and changes in the major research area can be found clearly by studying them. Other documents in from cluster (#0), such as ‘How sovereign is sovereign credit risk?’ published in the American Economic Journal – Macroeconomicas were also by Longstaff et al., who have made a significant contribution to this field.
Table 8. Top 20 references based on frequency in credit risk research.
Table 9. Top 20 citing articles of the article entitled ‘Corporate yield spreads: Default risk or liquidity? New evidence from the credit default swap market.’
4.2. Author co-citation network analysis in credit risk research
By analysing author co-citation, we can find out the influential talents in the credit risk research field and provide reference for the introduction of talents in specific relevant institutions. The network contains 356 nodes and 1,629 links and has an overall density with 0.0258 which is illustrated in . It should be pointed out that only the first author was considered in the study. The largest node represents the cited author Merton RC, with a frequency of 666. The centrality of this node with a purple outer ring is 0.12, which indicates that Merton RC has a certain position in this field. lists the top 20 cited authors with a citation frequency greater than 136. The node representing Altman EI has the highest centrality of 0.23, so it is a key node. Because high centrality is a measure of the transformative potential associated with scientific contributions. Other cited authors such as Jarrow RA, Longstaff FA, Acharya W, Berger AN and Das SR whose centrality is all greater than 1, are also worthy of attention. The conclusion that Longstaff FA is the core author is consistent with the results of the document co-citation analysis, which verifies the accuracy of our research from a different angle.
Figure 11. A visualisation of the author co-citation network.
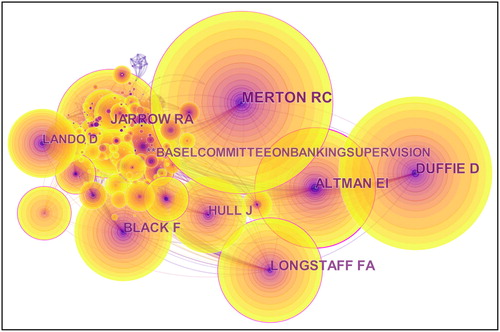
Table 10. Top 20 most cited authors based on frequency in credit risk research.
4.3. Journal co-citation network analysis in credit risk research
The research literature on credit risk is from various journals. Understanding the distribution of core journals in this field can help to provide a valid basis for literature collection. The main journal clusters in credit risk research area are revealed in . Combined with and , we can see that the top journals in this field are Journal of Finance, Journal of Banking and Finance, Review of Financial Studies, Journal of Financial Economics, Econometrica, Journal of Political Economy, Journal of Financial and Quantitative Analysis, American Economic Review, Journal of Business, and Journal of Money Credit and Banking, and so on. Among the top 10 most cited journals listed, Journal of Finance is the most frequently cited, with 1,512 co-citations. In terms of centrality, Journal of Finance still ranked first, with 0.16. Therefore, Journal of Finance had the highest impact factor at 8.968 of the listed journals and so is a core journal in the field. It plays a major role in connecting with other journals according to these two indicators. Other journals with high centrality are Journal of Financial Economics and Econometrica, both with a centrality of 0.11, they are also of great value for credit risk researchers.
Figure 12. A visualisation of the main journals cluster network.
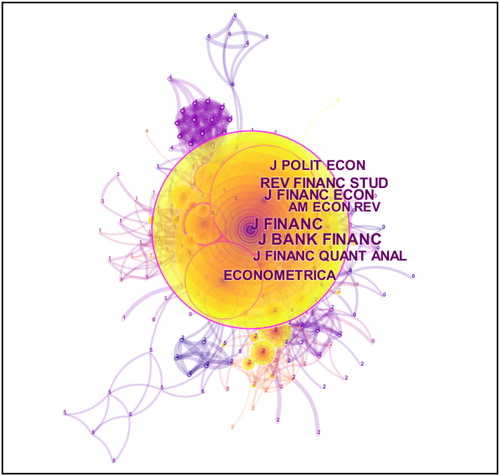
Table 11. Top 10 most cited journals based on frequency in credit risk research.
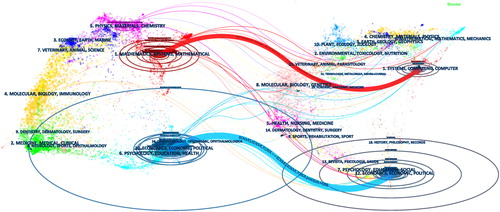
With the increasing complexity of research issues, the intersection between disciplines is required. An overlay of the cited journal is presented in . Each point in the figure represents a journal, and the aggregation of each colour means the corresponding subject. The left side of the graph indicates the subject distribution of the citing article while the right expresses the subject distribution of the cited article. It is obvious that there are Mathematics, Medicine, Ecology, Molecular, Physics, Systems, Environment and so on in the base map. In addition, the position of the ellipse represents the distribution of disciplines involved in this study. The number of authors is explained by the horizontal axis of the ellipse, and the number of article is explained by the vertical axis of the ellipse. Total two distinct wavy lines in the picture that leads from left to right of the elliptical can be found. The red wavy line illustrates the interdisciplinary cross-reference between Mathematics, Systems, Mathematical and Systems, Computing, Computer, while blue wavy lines connect citing articles and cited articles which represent Economic and Political in this study.
Figure 13. An overlay of the cited journal in credit risk research.
reveals the top 10 most prolific journals in credit risk research during the period of 1998–2017, the Journal of Banking and Finance published the most articles (244), accounting for 10.226% of the total, while other journals published below 100. However, the publications in the Journal of Finance which have the highest centrality and cited amount in did not appear here.
Table 12. Top 10 most prolific journals based on publication number in credit risk research.
5. Co-occurrence analysis in credit risk research
5.1. Burst detections of keywords
The keywords are the refinement of the main content of the thesis, which can reflect the author’s academic thoughts and viewpoints fully. The sudden detection of keywords refers to the words that are more frequently used or used in a shorter period and the special attention received by scholars at a certain time. According to the word frequency change of the emergent words, the frontiers and trends in this research area can be judged. lists the top 20 keywords with the strongest bursts. The last column of the line means the entire year of the study (1998–2017), and the red line represents the duration of the keyword outbreak. In terms of burst strength, the top ranked is ‘Corporate Debt’ with bursts of 10.6585, followed by ‘Crisis’ with bursts of 9.7225, occupying the third position is ‘Term structure’ (9.6572), followed by ‘Interest rate’ (8.7493), ‘Basel ii’ (8.5946), ‘System’ (7.8983), ‘Value at risk’ (7.8627), ‘Contagion’ (7.7693), ‘Risk management’ (7.7076), ‘Performance’ (7.2428) which burst strength is all above 7.
Table 13. Top 20 keywords based on burst strength in credit risk research.
These burst keywords reflect the characteristics of a certain period. Through detailed study, we can discover that the hot topics in this field change over time. In the 1990s, ‘Term structure’ and ‘Interest Rate’ are the mainstream trend of the credit risk research area. However, ‘Crisis’, ‘Contagion’, ‘Performance’, ‘Economy’, ‘Firm’, ‘Monetary policy’, ‘Management’, ‘Financial crisis’, ‘Counterparty risk’, ‘Corporate governance’ and ‘Systemic risk’ have become the research frontier in recent years.
6. Conclusion
This article has been a scientific review of 2,384 data on credit risk based on W.o.S., applying CiteSpace software. Some useful conclusions have been obtained through citation analysis, co-citation analysis and co-occurrence analysis. The literature on the credit risk knowledge area has increased significantly, especially after 2008. However, the research has been scattered, and there has been only little collaborations among scholars. The U.S. has been the main contributor, as many high-yield institutions such as New York University, Columbia University and the National Bureau of Economic Research, and so on, have been located here. Other areas with more research on credit risk have been Europe and Asia. In addition, Merton Robert Cox and Jarrow Robert Alan have been researchers worthy of attention in the field of credit risk. Journal of Finance, Journal of Financial Economics and Econometrica have played a vital role in establishing links with other journals. Besides, ‘Rollover risk’, ‘Arbitrage-free pricing’, ‘Default cycle’, ‘Credit risk evaluation’, ‘Correlated default’, ‘Credit portfolio model’, ‘Interest rate risk’, ‘Systemic risk’, ‘Quantifying credit risk’ and ‘Asset price’ have been the main research area in the knowledge field of ‘credit risk’. Further, ‘Crisis’, ‘Contagion’, ‘Performance’, ‘Economy’, ‘Firm’, ‘Monetary policy’, ‘Management’, ‘Financial crisis’, ‘Counterparty risk’, ‘Corporate governance’ and ‘Systemic risk’ have become research hotspots in recent years.
In short, the scientometrics analysis is of great significance for identifying potential relationships between the literature and investigating the knowledge evolution of credit risk research. However, it should be pointed out that there are still some limitations in this research. For example, keywords are not comprehensive when searching for data, which can lead to the omission of partial data. In order to verify the accuracy of the research results and broaden the scope, collecting data with different related terms, conducting specific research on one or more core journals in this field based on CiteSpace or utilising other scientific measurement software tools to do an analysis are expected in further study.
Disclosure statement
The author reports no conflicts of interest.
Additional information
Funding
References
- Adler, M., & Song, J. (2010). The behavior of emerging market sovereigns’ credit default swap premiums and bond yield spreads. International Journal of Finance & Economics, 15, 31–58. doi:10.1002/ijfe.408
- Ammer, J., & Cai, F. (2011). Sovereign CDS and bond pricing dynamics in emerging markets: Does the cheapest-to-deliver option matter? Journal of International Financial Markets Institutions and Money, 21, 369–387. doi:10.1016/j.intfin.2011.01.001
- Ang, A., & Longstaff, F. A. (2013). Systemic sovereign credit risk: Lessons from the US and Europe. Journal of Monetary Economics, 60, 493–510. doi:10.1016/j.jmoneco.2013.04.009
- Angilella, S., & Mazzu, S. (2015). The financing of innovative SMEs: A multicriteria credit rating model. European Journal of Operational Research, 244, 540–554. doi:10.1016/j.ejor.2015.01.033
- Annaert, J., Ceuster, M. D., Roy, P. V., & Vespro, C. (2013). What determines Euro area bank CDS spreads? Journal of International Money and Finance, 32, 444–461. doi:10.1016/j.jimonfin.2012.05.029
- Arce, O., Mayordomo, S., & Pena, J. I. (2013). Credit-risk valuation in the sovereign CDS and bonds markets: Evidence from the euro area crisis. Journal of International Money and Finance, 35, 124–145. doi:10.1016/j.jimonfin.2013.01.006
- Arnold, M., Wagner, A. F., & Westermann, R. (2013). Growth options, macroeconomic conditions, and the cross section of credit risk. Journal of Financial Economics, 107, 350–385. doi:10.1016/j.jfineco.2012.08.017
- Arora, N. (2013). Discussion of “Financial statement comparability and credit risk”. Review of Accounting Studies, 18, 824–832. doi:10.1007/s11142-013-9239-6
- Arora, N., Gandhi, P., & Longstaff, F. A. (2012). Counterparty credit risk and the credit default swap market. Journal of Financial Economics, 103, 280–293. doi:10.1016/j.jfineco.2011.10.001
- Azizpour, S., Giesecke, K., & Kim, B. (2011). Premia for correlated default risk. Journal of Economic Dynamics and Control, 35, 1340–1357. doi:10.1016/j.jedc.2011.03.010
- Baesens, B., Setiono, R., Mues, C., & Vanthienen, J. (2003). Using neural network rule extraction and decision tables for credit-risk evaluation. Management Science, 49, 312–329. doi:10.1287/mnsc.49.3.312.12739
- Bakshi, G., Madan, D., & Zhang, F. X. L. (2006). Investigating the role of systematic and firm-specific factors in default risk: Lessons from empirically evaluating credit risk models. The Journal of Business, 79, 1955–1987. doi:10.1086/503653
- Bao, J., Pan, J., & Wang, J. (2011). The illiquidity of corporate bonds. The Journal of Finance, 66, 911–946. doi:10.1111/j.1540-6261.2011.01655.x
- Barboza, F., Kimura, H., & Altman, E. (2017). Machine learning models and bankruptcy prediction. Expert Systems with Applications, 83, 405–417. doi:10.1016/j.eswa.2017.04.006
- Batta, G. (2011). The direct relevance of accounting information for credit default swap pricing. Journal of Business Finance & Accounting, 38, 1096–1122. doi:10.1111/j.1468-5957.2011.02264.x
- Beber, A., Brandt, M. W., & Kavajecz, K. A. (2009). Flight-to-quality or flight-to-liquidity? Evidence from the euro-area bond market. Review of Financial Studies, 22, 925–957. doi:10.1093/rfs/hhm088
- Beque, A., & Lessmann, S. (2017). Extreme learning machines for credit scoring: An empirical evaluation. Expert Systems with Applications, 86, 42–53. doi:10.1016/j.eswa.2017.05.050
- Beraldi, P., Simone, F. D., Violi, A., Consigli, G., & Iaquinta, G. (2012). Scenario-based dynamic corporate bond portfolio management. IMA Journal of Management Mathematics, 23, 341–364. doi:10.1093/imaman/dps017
- Berg, T. (2010). From actual to risk-neutral default probabilities: Merton and beyond. The Journal of Credit Risk, 6, 55–86. doi:10.21314/JCR.2010.105
- Bhamra, H. S., Kuehn, L. A., & Strebulaev, I. A. (2010). The levered equity risk premium and credit spreads: A unified framework. Review of Financial Studies, 23, 645–703. doi:10.1093/rfs/hhp082
- Bharath, S. T., & Shumway, T. (2008). Forecasting default with the merton distance to default model. Review of Financial Studies, 21, 1339–1369. doi:10.1093/rfs/hhn044
- Blanco, R., Brennan, S., & Marsh, I. W. (2005). An empirical analysis of the dynamic relation between investment-grade bonds and credit default swaps. The Journal of Finance, 60, 2255–2281. doi:10.1111/j.1540-6261.2005.00798.x
- Brunnermeier, M. K. (2009). Deciphering the liquidity and credit crunch 2007-2008. Journal of Economic Perspectives, 23, 77–100. doi:10.1257/jep.23.1.77
- Brunnermeier, M. K., & Pedersen, L. H. (2009). Market liquidity and funding liquidity. Review of Financial Studies, 22, 2201–2238. doi:10.1093/rfs/hhn098
- Calice, G., Ioannidis, C., & Williams, J. (2012). Credit derivatives and the default risk of large complex financial institutions. Journal of Financial Services Research, 42, 85–107. doi:10.1007/s10693-011-0121-z
- Callen, J. L., Livnat, J., & Segal, D. (2009). The impact of earnings on the pricing of credit default swaps. The Accounting Review, 84, 1363–1394. doi:10.2308/accr.2009.84.5.1363
- Carr, P., & Wu, L. R. (2010). Stock options and credit default swaps: A joint framework for valuation and estimation. Journal of Financial Econometrics, 8, 409–449. doi:10.1093/jjfinec/nbp010
- Cerrato, M., Crosby, J., Kim, M., & Zhao, Y. (2017). The joint credit risk of UK global-systemically important banks. Journal of Futures Markets, 37, 964–988. doi:10.1002/fut.21855
- Chen, L., Lesmond, D. A., & Wei, J. (2007). Corporate yield spreads and bond liquidity. The Journal of Finance, 62, 119–149. doi:10.1111/j.1540-6261.2007.01203.x
- Chen, R. R., Cheng, X. L., & Wu, L. R. (2013). Dynamic interactions between interest-rate and credit risk: Theory and evidence on the credit default swap term structure. Review of Finance, 17, 403–441. doi:10.1093/rof/rfr032
- Chen, T. Q., He, J. M., & Li, X. D. (2016). An evolving network model of credit risk contagion in the financial market. Technological and Economic Development of Economy, 23, 22–37. doi:10.3846/20294913.2015.1095808
- Crouhy, M., Galai, D., & Mark, R. (2000). A comparative analysis of current credit risk models. Journal of Banking & Finance, 24, 59–117. doi:10.1016/S0378-4266(99)00053-9
- Dahiya, S., Handa, S. S., & Singh, N. P. (2017). A feature selection enabled hybrid-bagging algorithm for credit risk evaluation. Expert Systems, 34, e12217. doi:10.1111/exsy.12217
- Darrell, D., & Singleton, K. J. (2003). Credit risk: Pricing, measurement, and management. New York: Princeton University Press.
- Das, S. R., Duffie, D., Kapadia, N., & Saita, L. (2007). Common failings: How corporate defaults are correlated. The Journal of Finance, 62, 93–117. doi:10.1111/j.1540-6261.2007.01202.x
- Duffie, D., Eckner, A., Horel, G., & Saita, L. (2009). Frailty correlated default. The Journal of Finance, 64, 2089–2123. doi:10.1111/j.1540-6261.2009.01495.x
- Duffie, D., Saita, L., & Wang, K. (2007). Multi-period corporate default prediction with stochastic covariates. Journal of Financial Economics, 83, 635–665. doi:10.1016/j.jfineco.2005.10.011
- Duffie, D., & Singleton, K. J. (1999). Modeling term structures of defaultable bonds. Review of Financial Studies, 12, 687–720. doi:10.1093/rfs/12.4.687
- Emekter, R., Tu, Y. B., Jirasakuldech, B., & Lu, M. (2015). Evaluating credit risk and loan performance in online Peer-to-Peer (P2P) lending. Applied Economics, 47, 54–70. doi:10.1080/00036846.2014.962222
- Eom, Y. H., Helwege, J., & Huang, J. Z. (2004). Structural models of corporate bond pricing: An empirical analysis. Review of Financial Studies, 17, 499–544. doi:10.1093/rfs/hhg053
- Ericsson, J., Jacobs, K., & Oviedo, R. (2009). The determinants of credit default swap premia. Journal of Financial and Quantitative Analysis, 44, 109–132. doi:10.1017/S0022109009090061
- Fang, Y., Yin, J., & Wu, B. H. (2017). Climate change and tourism: A scientometric analysis using CiteSpace. Journal of Sustainable Tourism, 26, 108–126. doi:10.1080/09669582.2017.1329310
- García-Céspedes, R., & Moreno, M. (2017). An approximate multi-period Vasicek credit risk model. Journal of Banking & Finance, 81, 105–113. doi:10.1016/j.jbankfin.2017.05.002
- Gordy, M. B. (2000). A comparative anatomy of credit risk models. Journal of Banking & Finance, 24, 119–149. doi:10.1016/S0378-4266(99)00054-0
- Gordy, M. B. (2003). A risk-factor model foundation for ratings-based bank capital rules. Journal of Financial Intermediation, 12, 199–232. doi:10.1016/S1042-9573(03)00040-8
- Grobys, K., & Haga, J. (2015). The market price of credit risk and economic states. Empirical Economics, 50, 1111–1134. doi:10.1007/s00181-015-0952-9
- Guo, Y. H., Zhou, W. J., Luo, C. Y., Liu, C. R., & Xiong, H. (2016). Instance-based credit risk assessment for investment decisions in P2P lending. European Journal of Operational Research, 249, 417–426. doi:10.1016/j.ejor.2015.05.050
- Harris, T. (2015). Credit scoring using the clustered support vector machine. Expert Systems with Applications, 42, 741–750. doi:10.1016/j.eswa.2014.08.029
- Hatchett, J. P. L., Li, X. D., & Wang, J. N. (2009). Credit contagion and credit risk. Quantitative Finance, 9, 373–382. doi:10.1080/14697680802464162
- Iturriaga, F. J. L., & Sanz, I. P. (2015). Bankruptcy visualization and prediction using neural networks: A study of US commercial banks. Expert Systems with Applications, 42, 2857–2869. doi:10.1016/j.eswa.2014.11.025
- Jarrow, R. A., Lando, D., & Turnbull, S. M. (1997). A markov model for the term structure of credit risk spreads. Review of Financial Studies, 10, 481–523. doi:10.1093/rfs/10.2.481
- Jiang, Y., Hou, L., Shi, T., & Gui, Q. (2017). A review of urban planning research for climate change. Sustainability, 9, 2224. doi:10.3390/su9122224
- Kim, M. C., & Chen, C. M. (2015). A scientometric review of emerging trends and new developments in recommendation systems. Scientometrics, 104, 239–263. doi:10.1007/s11192-015-1595-5
- Kolbel, J. F., Busch, T., & Jancso, L. M. (2017). How media coverage of corporate social irresponsibility increases financial risk. Strategic Management Journal, 38, 2266–2284. doi:10.1002/smj.2647
- Kou, G., Peng, Y., & Wang, G. X. (2014). Evaluation of clustering algorithms for financial risk analysis using MCDM methods. Information Sciences, 275(11), 1–12. doi:10.1016/j.ins.2014.02.137
- Li, K., Niskanen, J., Kolehmainen, M., & Niskanen, M. (2016). Financial innovation: Credit default hybrid model for SME lending. Expert Systems with Applications, 61, 343–355. doi:10.1016/j.eswa.2016.05.029
- Li, X. J., Ma, E., & Qu, H. L. (2017). Knowledge mapping of hospitality research–A visual analysis using CiteSpace. International Journal of Hospitality Management, 60, 77–93. doi:10.1016/j.ijhm.2016.10.006
- Lin, W. Y., Hu, Y. H., & Tsai, C. F. (2012). Machine learning in financial crisis prediction: A survey. IEEE Transactions on Systems Man and Cybernetics Part C-Applications and Reviews, 42, 421–436.
- Longstaff, F. A., Mithal, S., & Neis, E. (2005). Corporate yield spreads: Default risk or liquidity? New evidence from the credit default swap market. The Journal of Finance, 60, 2213–2253. doi:10.1111/j.1540-6261.2005.00797.x
- Longstaff, F. A., Pan, J., Pedersen, L. H., & Singleton, K. J. (2011). How sovereign is sovereign credit risk? American Economic Journal: Macroeconomics, 3, 75–103. doi:10.1257/mac.3.2.75
- Onan, A., Korukoğlu, S., & Bulut, H. (2016). A multiobjective weighted voting ensemble classifier based on differential evolution algorithm for text sentiment classification. Expert Systems with Applications, 62(15), 1–16. doi:10.1016/j.eswa.2016.06.005
- Pan, J., & Singleton, K. J. (2008). Default and recovery implicit in the term structure of sovereign CDS spreads. The Journal of Finance, 63, 2345–2384. doi:10.1111/j.1540-6261.2008.01399.x
- Petersen, M. A. (2009). Estimating standard errors in finance panel data sets: Comparing approaches. Review of Financial Studies, 22, 435–480. doi:10.1093/rfs/hhn053
- Ruan, J. H., Chan, F. T. S., Zhu, F. W., Wang, X. P., & Yang, J. (2016). A visualization review of cloud computing algorithms in the last decade. Sustainability, 8, 1008. doi:10.3390/su8101008
- Salim, R., Arjomandi, A., & Dakpo, K. H. (2016). Banks’ efficiency and credit risk analysis using by-production approach: The case of Iranian banks. Applied Economics, 49, 2974–2988. doi:10.1080/00036846.2016.1251567
- Serrano-Cinca, C., Gutierrez-Nieto, B., & Lopez-Palacios, L. (2015). Determinants of default in P2P lending. PLos One, 10(10), e0139427. doi:10.1371/journal.pone.0139427
- Small, H., Boyack, K. W., & Klavans, R. (2014). Identifying emerging topics in science and technology. Research Policy, 43, 1450–1467. doi:10.1016/j.respol.2014.02.005
- Sun, J., Li, H., Huang, Q. H., & He, K. Y. (2014). Predicting financial distress and corporate failure: A review from the state-of-the-art definitions, modeling, sampling, and featuring approaches. Knowledge-Based Systems, 57, 41–56. doi:10.1016/j.knosys.2013.12.006
- Wang, X. L., Nathwani, J., & Wu, C. Y. (2016). Visualization of international energy policy research. Energies, 9, 72. doi:10.3390/en9020072
- Woźniak, M., Graña, M., & Corchado, E. (2014). A survey of multiple classifier systems as hybrid systems. Information Fusion, 16, 3–17. doi:10.1016/j.inffus.2013.04.006
- Wu, D. S. D., Olson, D. L., & Luo, C. C. (2014). A decision support approach for accounts receivable risk management. IEEE Transactions on Systems, Man, and Cybernetics: Systems, 44, 1624–1632. doi:10.1109/TSMC.2014.2318020
- Xiang, C. Y., Wang, Y., & Liu, H. W. (2017). A scientometrics review on nonpoint source pollution research. Ecological Engineering, 99, 400–408. doi:10.1016/j.ecoleng.2016.11.028
- Yu, D. J. (2015). A scientometrics review on aggregation operator research. Scientometrics, 105, 115–133. doi:10.1007/s11192-015-1695-2
- Yu, D. J., & Xu, C. (2017). Mapping research on carbon emissions trading: A co-citation analysis. Renewable and Sustainable Energy Reviews, 74, 1314–1322. doi:10.1016/j.rser.2016.11.144
- Yu, D. J., Xu, Z. S., Kao, Y. S., & Lin, C. T. (2018). The structure and citation landscape of IEEE transactions on fuzzy systems (1994-2015). IEEE Transactions on Fuzzy Systems, 26, 430–442. doi:10.1109/TFUZZ.2017.2672732
- Zhang, B. Y., Zhou, H., & Zhu, H. B. (2009). Explaining credit default swap spreads with the equity volatility and jump risks of individual firms. Review of Financial Studies, 22, 5099–5131. doi:10.1093/rfs/hhp004
- Zhu, Y., Xie, C., Sun, B., Wang, G. J., & Yan, X. G. (2016). Predicting China’s SME credit risk in supply chain financing by logistic regression, artificial neural network and hybrid models. Sustainability, 8, 433. doi:10.3390/su8050433
- Zhu, Y., Xie, C., Wang, G. J., & Yan, X. G. (2016). Predicting China’s SME credit risk in supply chain finance based on machine learning methods. Entropy, 18, 195. doi:10.3390/e18050195
- Zopounidis, C., Galariotis, E., Doumpos, M., Sarri, S., & Andriosopoulo, S. K. (2015). Multiple criteria decision aiding for finance: An updated bibliographic survey. European Journal of Operational Research, 247, 339–348. doi:10.1016/j.ejor.2015.05.032