
 ?Mathematical formulae have been encoded as MathML and are displayed in this HTML version using MathJax in order to improve their display. Uncheck the box to turn MathJax off. This feature requires Javascript. Click on a formula to zoom.
Abstract
Based on provincial panel data of China ranging from 2004 to 2015, this paper has empirically examined the effect of basic public service on the urban–rural income inequality with a system generalised method of moments (sys-GMM). We arrive at the following conclusions: 1) the improvement of public service provision is conducive to narrowing the urban–rural income gap; 2) compared with the ‘hard’ public services (including infrastructure, environmental protection and cultural facilities), the ‘soft’ public services (including education, medical care and social security) play a more significant role in reducing the disparity; 3) the household registration system impairs the welfare brought by the ‘soft’ public services and exacerbates the passive effect of ‘hard’ public services on the income gap; 4) the interactive impact of household registration regulation and public service provision on the income gap is more significant in developed areas. These findings suggest the government should give priority to the improvement of ‘soft’ public services, reevaluate the way of spending on ‘hard’ public services in rural areas and deepen the household registration system reform.
1. Introduction
In many developing countries, the imbalance between urban areas and rural areas is a major concern (Kibriya, Bessler, & Price, Citation2019; Ravallion & Chen, Citation2007). Such evidence can be easily found in the issue of urban-rural income inequality, which contributes mostly to the overall income inequality in developing countries (Sicular, Ximing, Gustafsson, & Shi, Citation2007; Young, Citation2013). It is widely documented that urban–rural income inequality is closely related to the unequal distribution of basic public services between urban areas and rural areas.1 Especially, in some countries like China, due to the household registration or hukou system,2 the rural population cannot enjoy basic public services as much as urban residents even if they live in cities (Song, Citation2014).
The unequal access to public resources that accompanies the urban-rural income inequality reduces intergenerational mobility as well as hinders the sustainable growth of the economy (Bartkowiak, Citation2017; Corak, Citation2013; Kibriya et al., Citation2019). Therefore, China is paying more attention to improving rural households’ access to public services. One example is rural revitalisation, which is one of the major policies that have been recently made by the Party’s 19th National Congress in China. The proposal of the rural revitalisation strategy aims to solve the problem of unbalanced development of the country. Also, early in 2008 after the global economic recession, a four-trillion-dollar plan was proposed to stimulate domestic demand. The vast rural areas were regarded as a new engine for economic growth and since then more public resources have been allocated to them. Meanwhile, the household registration system has been reformed significantly to allow rural migrants an easier access to welfare programmes in cities.3 However, effects of the above reforms remain unclear. According to the statistics published by the National Bureau of Statistics (NBS) of China, the urban-rural income gap exceeded 3.3 in three consecutive years between 2007 and 2009.4 Since then, this ratio had declined regularly, but still reached 2.7 in 2017.
Extensive previous work has focused on the possible causes of the urban-rural income inequality in China. These studies could be classified into three groups. The first group studies the impact of political strategies, such as the household registration system, the urban biased policy and the opening reform (e.g., Démurger, Li, & Yang, Citation2012; Gravemeyer, Gries, & Xue, Citation2011; Sicular et al., Citation2007). The second group studies individual and household characteristics, such as human capital, health, and family structure (Solinger, Citation1999; Young, Citation2013). The third group studies macro-socioeconomic factors, such as education expansion (Nie & Xing, Citation2019), social insurance coverage (He & Sato, Citation2011), falling labour share (Molero-Simarro, Citation2017), financial development (Huang & Zhang, Citation2019), urbanisation (Qiu & Zhao, Citation2019; Wang, Shao, & Li, Citation2019) and industrial structure (Yang, Nie, Liu, & Shen, Citation2018).
Our paper relates to the literature on the impact of unequal distribution of public services on income inequality. Among the basic public services, the influence of distribution of educational resource is most discussed. For example, Becker and Chiswick (Citation1966) first revealed that educational differences lead to a large income gap. Yang and Qiu (Citation2016) show that the difference in early education investment contributes the most to income gaps in China, and suggest subsidising early education is the most effective public policy to mitigate income inequality. Zhou and Zhao (Citation2019) argue that education demonstrates an inverse U-shaped trend in its contribution to income inequality in China with a counterfactual estimation. Another kind of public services widely studied in the discussion of income inequality is social insurance coverage. For example, He and Sato (Citation2011) highlight that the uneven supply levels of social security between the rural and the urban areas could increase the urban-rural income gap in China. Munshi and Rosenzweig (Citation2016) find evidence that the insufficiency of formal insurance causes misallocation in the labour market, and leads to the large spatial wage disparities in India. With regard to other aspects, Cohen and Monaco (Citation2008) find that the improvement of ports and highway infrastructures causes space spillover effects, and the reallocation of resources among regions. From an integral perspective, Bartik (Citation1991) points out that the improvement of public services could boost economic growth, and then affect income distribution. Aaberge and Langørgen (Citation2006) indicate that public services help to reduce inequality of long-term income distribution. Based on the ‘voting by foot’ theory (Tiebout, Citation1956), some scholars provide evidence that the uneven distribution of public services exacerbates income variations, thus enlarging spatial inequality (Banzhaf & Walsh, Citation2008, Citation2013; Sun, Fu, & Zheng, Citation2017).5
In addition, our paper relates to an increasing number of studies that examine the relation between the household registration system and the growing income gap. There is significant evidence that the household registration system plays an important role in urban-rural income inequality in China (Sicular et al., Citation2007). Based on a dynamic computable general equilibrium (CGE) model and simulation techniques, Whalley and Zhang (Citation2007) provide evidence that the removal of the household registration system could lead to a reduction of urban-rural income inequality. Consistent works are also produced by Zhang, Yi, Luo, Liu, and Rozelle (Citation2013), Fields and Song (Citation2019). Further, some studies investigate how the household registration system affects urban-rural income inequality. The majority of them focus on the labour market discrimination caused by the household registration system, including wage discrimination and hiring discrimination (Gravemeyer, Gries, & Xue, Citation2011; Chen & Hoy, Citation2011; Demurger et al., 2012).6
In this paper, we include the two key influential variables, household registration system and public services provision in the same analysis framework to discuss urban-rural income inequality. We construct different indexes to reflect the actual provision of basic public services instead of public spending in the recent decade in China with an entropy method. In the light of possible interactions among the public services, we offer an overall evaluation of how the integrated improvement of public service influences urban-rural income inequality in line with the indexes. We also divide the public services into two categories according to their relevance to the household registration system in order to explore the differentiated effects. Moreover, we examine the impact of public services on urban-rural income inequality under different scenarios to capture their non-linear relationship with a threshold model.
Compared with the majority of studies on household registration regulation, we contribute to the literature by examining how the interaction of household registration regulation and public services shapes the urban-rural income inequality theoretically and empirically. We focus on the pre-market discrimination associated with the unequal access to public services, which is less analysed, to explain the income gap in the literature, i.e., people who have different hukou at birth access different public service, possibly resulting in the difference in future income outcomes (Afridi, Li, & Ren, Citation2015; Demurger, Gurgand, Li, & Yue, 2009; Fu & Ren, Citation2010). We examine the effect from a macro perspective to capture the influence of governmental intervention, and try to cover a wider range of public services, not confined to specific aspects.
The rest of the paper is arranged as follows. Section 2 proposes the research proposition through theoretical modelling. Section 3 introduces the data set and variables, and especially uses the entropy method to measure the level of public service in China. Section 4 empirically tests the effects of public service and household registration regulation on the urban-rural income gap. Concluding remarks are given in Section 5.
2. Theoretical model
We start with a brief theoretical model to make propositions on how the basic public services influence the urban-rural income gap under the household registration system. For simplicity, the following assumptions are made: 1) the national economy only consists of two sectors, namely, the agricultural production sector, located in rural areas, and the non-agricultural production sector, located in urban areas. The capital and labour output elasticity coefficients of the two sectors are assumed the same, while input factors such as capital, labour and technology vary; 2) the initial labour forces in rural and urban areas are denoted as and
, and
where
respectively represent the proportion of rural labour engaged in agricultural production activities in rural areas, migrant workers engaged in non-agricultural production activities without a residence registration, and those with a residence registration in urban areas. The total labour force remains constant, and the production function is in the form of Cobb Douglas.
According to the above assumptions, the intensity of urban household registration regulation could be expressed as:
(10)
(10)
where
is measured by the ratio of the number of unregistered migrants to the number of permanent residents in urban areas. A city’s permanent resident population (or de faco population) reflects the size of the tax base for local government to obtain fiscal revenue. Since local government in China is only responsible for providing public services for the registered population, the government of a city with an abundant labour force inclines to restrict the accessibility of urban hukou for ordinary migrant workers, in order to reduce the financial burden without affecting the city’s economic growth. The greater the ratio is, the stronger the government’s willingness to regulate migration. Output, technical levels, and capital inputs of the agricultural sector and the non-agricultural sector are defined as
and
,
and
, and
and
respectively. The capital and labour output elastic coefficients of the two sectors are assumed the same, and are recorded as
and
. The production functions of the two sectors can be outlined as:
(2)
(2)
(3)
(3)
The per-capita outputs of the two sectors are:
(4)
(4)
(5)
(5)
The per-capita capital inputs of the two departments are given as and
]. Under the assumption of market clearing, the rewards for the labour engaged in agricultural production and non-agricultural production, respectively, are:
(6)
(6)
(7)
(7)
Under the urban-rural dual structure of China, the urban registered population accesses more basic public services than does the non-urban registered population. At the same time, new public services are mainly concentrated in cities, rather than rural areas. Therefore, the supply of rural public service could be standardised to 1 and could be assumed to remain unchanged, while the supply of urban public service is set to . Therefore, the levels of per capita public service supply in rural and urban areas could be expressed as
and
.
Further, the urban-rural income gap could be defined as. We assume that the urban-rural income gap (
) comes from two aspects, namely, the wage gap (
) and the supply gap of public services (
). The wage gap could be further elaborated as
, and the supply gap of public services could be illustrated as
. Substituting (1), (6), and (7) into the above equations, we obtain:
(8)
(8)
Deriving the above function, we have and
. According to the results of the derivation, the following proposition arises.
Proposition 1.
The stricter the household registration regulation, the greater the income gap between urban and rural areas.
Proposition 2. A
s the intensity of household registration regulation increases, the increase in public service provision would enlarge the urban-rural income gap.
Therefore, we can infer from the above propositions that strict household registration regulation could worsen the impact of unequal allocation of public services on the urban-rural income gap.
3. Data and measurements
3.1. Data
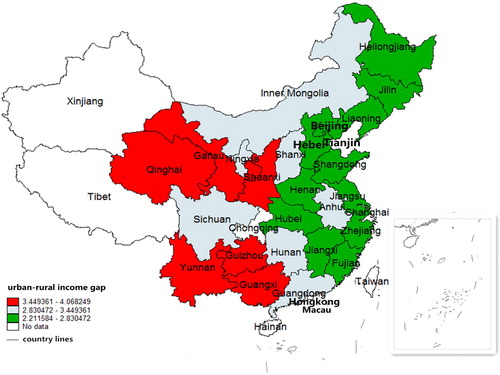
The data used in this paper are from the China Statistical Yearbook, the China Labor Statistics Yearbook, and the China Health and Family Planning Statistical Yearbook of 2004–2015, published by the National Bureau of Statistics of China (NBS) (http://data.stats.gov.cn/index.htm). Our data set started from 2004 because data on public service provision at a provincial level are only available since 2004. The data covered the years during the era of household registration reform and supply-side structural reform. The sample had a wide regional coverage, including the following provincial regions: Beijing, Shanghai, Tianjin, Guangdong, Guangxi, Fujian, Anhui, Shandong, Hunan, Hubei, Henan, Hebei, Liaoning, Jiangsu, Jiangxi, Jilin, Shaanxi, Shanxi, Inner Mongolia, Sichuan, Zhejiang, Gansu, Yunnan, Heilongjiang, Ningxia, Qinghai, and Guizhou. Due to some key indicators being missing, we excluded samples from the following regions: Tibet, Chongqing, Hainan, and Xinjiang. The samples from Hong Kong, Macau, and Taiwan were also excluded, with the consideration of different statistical calibres in these regions. Finally, our research samples covered 24 provincial administrative units and three municipalities of China, with 324 observations in total.7The geographical locations of the sampled regions are indicated in .
Figure 1. The average urban-rural income gap of the sampled regions in China.
3.2. Measuring the dependent variable
The dependent variable was the urban-rural income gap, which was measured by the ratio of the household per-capita disposable income of urban residents to the household per-capita net income of rural residents. Given striking differences in terms of income components, income source, consumption structure and social security between urban and rural households in China, it is not easy to obtain urban and rural household income that is more comparable (see, Li & Luo, Citation2010). The income definition of NBS includes different income components for rural households and urban households. The net income of rural households includes two major components: cash income and in-kind value of home product for self-consumption after deduction of production cost, while there is no in-kind value in the disposable income of urban households. Such a difference made the definition of net income for rural households inconsistent with the definition of disposable income for urban households. We accepted the definition of the urban-rural income gap adopted by the NBS as most studies did. The higher the ratio was, the greater the income gap between urban and rural areas. Moreover, we deflated the value of income by provincial consumer price indices to Yuan as of 1978 with consideration of inflation and differential price levels among provinces.
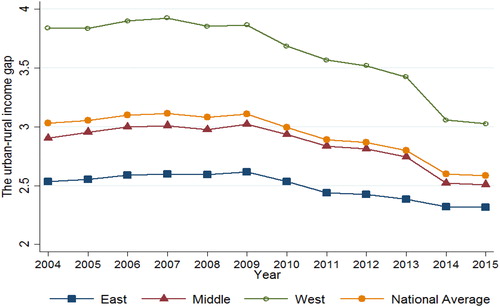
As shown in , the overall trend of the urban-rural income gap had declined since 2009. The declining trend could be explained by the large public investment in rural areas after the global recession of 2008–2009. During the period from 2004 to 2015, the average gap still reached 2.93. Meanwhile, we could see that the income disparities differed among the eastern regions, the middle regions, and the western regions in both and .8 The average urban-rural income gap of western regions remained above the national average level, followed by that of middle regions. Compared with eastern regions, the economic development of the west and the middle regions was confined by their limited resources, leading to more focus on urban development. This could be one explanation of the larger income gap.
Figure 2. The average urban-rural income gap.
3.3. Measuring the explanatory variables
3.3.1. Basic public service provision
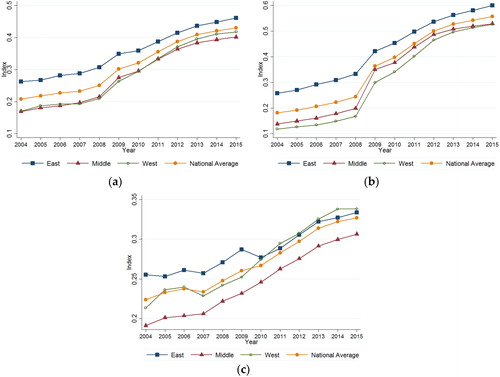
The basic public services discussed in this paper covered basic education, medical care, social security, environmental protection, cultural life, and infrastructure. Before the empirical test, we needed to assess the performance of basic public services in each region. Since the efficiency of public spending may differ among regions, we used the actual provision of basic public services rather than using public spending to evaluate their performances. Sixteen indicators were selected to evaluate the above six subjects. Considering that the influencing mechanisms of different public services may vary, we also divided the basic public services into two categories according to their relevance with the household registration. One was ‘soft’ public service provision only for the registered population, including basic education, medical care, and social security. The other was the ‘hard’ public service provision, including environmental protection, cultural life, and infrastructure. The measurement process entailed the following steps: first, we transformed the original data into a dimensionless form, then we used the entropy method to determine an objective weight for each tertiary indicator with weights summing up to 100%; furthermore, we calculated the overall public service index, the ‘soft’ public service index, and the ‘hard’ public service index for each region in each year, according to the weight of each indicator. illustrates the evaluation system of the indexes.
Table 1. The evaluation index system of basic public services.
shows the results of the evaluation. As a whole, the provision of public services had remained in an upward trend since 2004. However, the supply levels varied among regions. The eastern regions had the best performance, followed by the middle and western regions. This was plausible in the light of different financial capacity of local governments among regions. It was worth noting that the gaps of public service provision among regions had shrunk since 2008. It revealed that the central government had attached more importance to regional balanced development by increasing public services in the less developed regions since then. The supply level of ‘hard’ public services of the western regions even caught up with that of the eastern regions after 2011.
Figure 3. (a) Overall public service index; (b) ‘Soft’ public service index; (c) ‘Hard’ public service index.
3.3.2. Intensity of household registration regulation
We measured the intensity of household registration regulation by the ratio of unregistered resident population to the resident population (including registered residents and unregistered residents) in a province.9 Although this is a provincial index, it reflects the intensity of household registration regulation of urban governments since most migrants flow into cities rather than rural areas in China. As we mentioned in the theoretical section, the local government of a city with an abundant labour force inclines to place restrictions on the inflow of migrants, in order to protect the welfare of its registered urban residents. The greater the ratio is, the stronger the government’s willingness to regulate migration.
3.3.3. Controlled variables
To identify the effects of basic public services, the analyses controlled for the following factors that may also play a role in the urban-rural income gap, in the light of the relevant literature:
The gross domestic product per capita was deflated to Yuan as of 1978, with a logarithmic treatment
The urbanisation level was measured by the proportion of the urban population to the total population
The industrial structure was expressed as the proportion of the tertiary industry’s added value to the gross domestic product (GDP)
The proportion of agricultural expenditures was measured by the ratio of the agricultural expenditure to the total financial expenditure
The financial development level was expressed as the ratio of bank loan to the GDP
The dependence on foreign trade was expressed as the ratio of import and export to the GDP
3.4. Descriptive statistics of variables
summarises the descriptive statistics of each variable. It could be inferred that the regional income disparity is a plain fact in China while it varies from place to place (also documented in the work of Gao, Liu, Chen, and Cai (Citation2019)), with the minimum value being 1.85 and the maximum value being 4.76. The average gap was 2.93, indicating the disposable income per capita of urban residents was nearly three times that of rural residents. It further showed that both the basic public service provisions and the registration regulation intensity were significantly different among regions. In addition, the descriptive statistical results of the control variables revealed that these regions varied substantially in urbanisation and economic development.
Table 2. Descriptive statistics of variables.
4. Empirical analysis
4.1. Econometric methodologies
To address the problems of autocorrelation of the urban-rural income gap, as well as the potential endogeneity, this paper adopted the system-generalised method of moments estimation (sys-GMM) proposed by Arellano and Bover (Citation1995), and Blundell and Bond (Citation1998) to examine the effect of basic public services on the urban-rural gap. Since the sys-GMM results showed that multi-level autocorrelations about the dependent variable may exist, the first-lagged item, second-lagged item, and third-lagged item of the dependent variable were added to the model. The dynamic auto-regressive model is specified as follows:
(9)
(9)
where
,
,
and
are the urban-rural gaps for region
in years
,
and
, respectively.
is the public goods provision outcome, which may be measured by the overall public service index, the ‘soft’ public service index, or the ‘hard’ public service index for region
in year
. The intensity of household registration regulation for region
in year
is denoted as
, which can reflect the dynamic hysteresis, as well as alleviate the endogeneity problem.
is a vector of control variables including GDP per capita, urbanisation level, industrial structure, agricultural expenditures, financial development level, and the dependence on foreign trade.
As mentioned, there exist significant development disparities among different regions of China. These regions vary greatly in the urban-rural gap, the provision of public services, the intensity of registration regulation, and economic development. Therefore, it was of necessity to further examine whether there were non-linear influences of public service provision under different regulation intensities. Referring to the threshold effect test proposed by Hansen (Citation1999), a panel threshold regression model was established:
(10)
(10)
The model treated the logarithm of GDP per capita () as the threshold variable, and the income gap as the dependent variable. The interaction of the public service provision (which can either be the overall public service index, the ‘soft’ public service index, or the ‘hard’ public service index) and regulation intensity was determined as the core explanatory variable to verify the non-linear influence in different economic development stages.
Before the threshold regression, it was necessary to confirm whether there was a threshold effect in the model. If it existed, we had to identify the number of thresholds and the corresponding values with a method of bootstrapping. It was verified that there significantly existed a single threshold, rather than double thresholds or triple thresholds (the test results for double thresholds and triple thresholds were not reported due to economy of space). reports the results of the single-threshold test for the model. The F-statistics were all significant at the 1% significance level, suggesting that a non-linear influence of the key variable may exist.
Table 3. Single threshold test results.
4.2. The results of the Sys-GMM estimation
presents the sys-GMM estimation results for the effect of basic public service provision on the urban-rural income gap. Column 1 examines the effect of overall public service provision. The results showed that the improvement of overall public service provision had a significant positive effect on reducing the income disparity. With the advancement of the sustainable development strategy, China is paying more attention to rural development. More public resources have been allocated to the rural areas. The improved public service provision helps rural residents to increase their income. Considering that the marginal utility of basic public services is higher for rural residents (Lall & Lundberg, Citation2006), it further reduces the income disparity between the rural and the urban. Column 3 tests the effect of ‘soft’ public service provision. The coefficient of ‘soft’ public service index in Column 3 was negative and significant, suggesting that the improvement of ‘soft’ public service provision plays a significant role in narrowing the income gap. The improvement of ‘soft’ public service provision allows rural residents to attain better education and health condition, which improves their human capital and future labour market outcomes. Moreover, it helps to promote their intergenerational social mobility, thus reducing the income gap. Column 5 examines the influence of ‘hard’ public service provision. The coefficient of the ‘hard’ public service index was significantly positive, indicating that increase of ‘hard’ public service provision could enlarge the urban-rural income gap. One possible reason could be that a substantial proportion of infrastructure is still concentrated in cities, despite China starting to look at rural development. Also, compared with the direct and concrete benefits from the ‘soft’ public services, the welfare from ‘hard’ public services is less significant. They seldom make immediate effects on the income growth of rural residents. Moreover, some infrastructures may just lie unused or benefit only a certain group of people in the rural areas, leading to no effect. The coefficients of intensity of registration regulation in columns 1, 3 and 5 also showed that the household registration regulation increases the urban-rural income gap.
Table 4. Effect of basic public service provision on the urban–rural income gap.
To further understand how the effect of basic public services on income gap is influenced by the regulation intensity, we introduced an interaction term in columns 2, 4 and 6. The coefficients of the interaction terms in columns 2 and 4 were significantly positive, indicating that household registration regulation could impair the welfare brought by the improved public services that narrowed the income gap, particularly the ‘soft’ public services. At the same time, the significantly positive coefficient of the interaction term in column 6 implied the household registration regulation exacerbated the passive effect of the improved ‘hard’ public service on the income gap (consider the coefficient of ‘hard’ public service index was positive). These findings were plausible. In China, household registration regulation is regarded as a yardstick by urban governments to allocate resources of basic education, health care, and social insurance. In the regions with high regulation intensity, it is not easy for rural residents to enjoy the public services in the cities due to strict access to a city hukou. While the urban residents are the main beneficiaries of public service improvement, the improvement of public services causes significant difference in welfare for urban residents and rural residents, leading to larger income gap. By contrast, in the regions with low regulation intensity, even the cities are allocated with more public resources; the relaxed registration regulation would allow rural residents an easy access to a city hukou, which makes the welfare difference between urban residents and rural residents less significant. Thus, the improvement of public services benefits both urban residents and rural residents, narrowing the income gap in such regions. The Hansen test results showed that the selected instrumental variables were valid. The sequence correlation test results in columns 1–6 indicated that the models had first-order correlation but they had no second-order correlation. Therefore, the systematic GMM method was applicable to address the research problem.
4.3. The results of the threshold model estimation
demonstrates the regression results for the non-linear influence of interaction terms on the urban-rural income gap. In regions with LnGDP below the threshold, the coefficients of interaction terms were negative, though insignificant. It suggested that the interactive effect of household registration regulation and basic public service provision on the income gap is less significant in less developed regions. One possible reason could be that local governments in less developed areas prefer to attract labour forces by relaxing restrictions on settlement. The cities in these regions adopt fewer or no household registration regulations. Also, subject to limited fiscal revenue, the local governments can afford few public services. The public services for the urban residents in these areas would not be significantly different from those for rural residents. This could explain why the coefficient is insignificant. In the regions with an LnGDP above threshold, the local governments suffer more urban problems that are caused by overpopulation. They prefer to use the household registration regulation as a yardstick to allocate public resources. The cities in these regions set up a higher threshold for migrant workers to achieve a city hukou. Meanwhile, the local governments possess higher fiscal revenue to afford more and better public services for the urban areas. Compared with less developed regions, there is a larger difference in public services for rural residents and urban residents, leading to an increase in the urban-rural income gap.
Table 5. Threshold regression results.
In addition, the effects of the control variables on the urban-rural income gap in and have the same directions with the findings of the existing studies (e.g., Huang & Zhang, Citation2019; Park & Mercado, Citation2018; Wu & Rao, Citation2017). Specifically, urbanisation level, agricultural expenditure and financial development are conductive to narrowing the income gap. By contrast, industrial structure (measured by the proportion of the tertiary industry’s added value to the gross domestic product) is found to enlarge the income gap.
5. Conclusions
Based on provincial panel data from the China Statistical Yearbook of 2004–2015, this paper estimated the effect of basic public service provision on the urban-rural income gap in China. Before the empirical analysis, we came up with a brief model to make propositions about the influence mechanism. Then, we divided the basic public services into two categories of ‘soft’ public services and ‘hard’ public services, according to their relevance with household registration. Furthermore, we measured the supply level of basic public services in each region with the entropy method. We used sys-GMM estimation to address the problem of autocorrelation of the urban-rural income gap and the potential endogeneity, while verifying the effect of basic public services. Considering significant development disparity among different regions of China, we employed a threshold model to estimate the non-linear effect of the interaction of household registration regulation and public service provision on the income gap. With the analysis above, we arrived at the following conclusions: first, as a whole, the improvement of public service provision is conductive to narrowing the income gap between urban and rural areas. Secondly, compared with the ‘hard’ public service provision, the ‘soft’ public service provision plays a more significant role in reducing the disparity. Thirdly, the household registration system impairs the welfare brought by the improved ‘soft’ public service that narrowed the income gap, and exacerbates the passive effect of the improved ‘hard’ public service on the income gap. Finally, compared with less developed areas, the interactive impact of household registration regulation and public service provision on the income gap is more significant in developed areas.
The results have broad implications for the design of policies. First, the central government should give priority to the improvement of ‘soft’ public services including education, medical care, and social insurance for the rural areas, which was evidenced to effectively reduce the income gap. Secondly, the demand from local residents in rural areas should be fully considered before the large chunk of spending on ‘hard’ public services for the rural areas. Moreover, it is of great significance to accelerate the household registration system reform substantially. The household registration regulation should not be regarded by the local governments as the only evaluation standard for residents to enjoy local public services. Facilitating the free flow of labour is an important way to promote equality.
Acknowledgements
We sincerely thank the anonymous reviewers for their thoughtful comments, but we take full responsibility for all errors in this article.
Disclosure statement
The author(s) declared no potential conflicts of interest with respect to the research, authorship, and/or publication of this article.
Additional information
Funding
Notes
1 Here, we refer the public services to those services provided by governments to satisfy residents’ basic requirements for living and producing, including national defence, legal systems, infrasturature (e.g., road, water, electricity and transportation), social security (e.g., education, social security, medical care, and technology) and so on.
2 The central government introduced the household registration system in 1958. Since then, all Chinese citizens have been classified as holding either rural hukou or urban hukou status according to the person’s official and only ‘permanent‘ residence (Chan, Citation2009). The original hukou status is determined by a person’s place of birth and is mainly passed on by one's parent(s). This system was initially designed to control population movement. Nowadays, the household registration system has lost its significance on strictly prohibiting rural labourers from migrating into urban areas (Chan, Citation2013). However, it is related with the access to many public welfares, which still makes it a unique labour market intervention in China.
3 One breakthrough is to remove the distinction between agricultural hukou and non-agricultural hukou in some provinces, such as Guangdong, Zhejiang, Guangxi, Hebei and Jiangsu.
4 The urban-rural income ratio is measured by the ratio of the household-per-capita disposable income of urban residents to the household-per-capita net income of rural residents.
5 ‘Voting by foot‘ theory implies that people voluntarily move to the regions where the combination of public services and tax best suits their preferences. Regions with better public services attract more high-income households.
6 Arrow, (Citation1973) defines labor market discrimination as the valuation of personal characteristics of the worker that are unrelated to worker productivity in the market place.
7 The three municipalities (Beijing, Shanghai and Tianjin) are under the direct administration of central government, ranked as province and part of the first tier administrative divisions of China.
8 We devide the three regions based on the Eleventh Five-Year Plan proposed by the central government (2012–2017). The eastern regions include Beijing, Tianjin, Shanghai, Liaoning, Shandong, Jiangsu, Jilin, Heilongjiang, Zhejiang, Fujian, and Guangdong. The middle regions include Hebei, Henan, Shanxi, Anhui, Jiangxi, Hunan, Hubei, and Inner Mongolia. The western regions include Guangxi, Sichuan, Yunnan, Guizhou, Qinghai, Shaanxi, Gansu, and Ningxia.
9 According to the definition by the National Bureau of Statistics (NBS) of China, we refer ‘registered residents‘ to residents with a local hukou and ‘unregistered residents‘ to residents who have resided in the locations at the time of census more than six months without a local hukou. Both the population of registered residents and unregistered residents are available from the provincial Statistical Yearbooks. The yearbook data are derived from the annual 0.1% population sample survey (1% population sample in 2005, 2010 and 2015) conducted by NBS. Therefore, our data source covers not only registered residents but also unregistered residents (see, Chan &Wang, 2008).
References
- Afridi, F., Li, S., & Ren, Y. (2015). Social identity and inequality: The impact of China's hukou system. Journal of Public Economics, 123, 17–29. doi: 10.1016/j.jpubeco.2014.12.011
- Arellano, M., & Bover, O. (1995). Another look at the instrumental variable estimation of error-components models. Journal of Econometrics, 68(1), 29–51. doi: 10.1016/0304-4076(94)01642-D
- Arrow, K. (1973). The theory of discrimination. Discrimination in Labor Markets, 3(10), 3–33.
- Aaberge, R., & Langørgen, A. (2006). Measuring the benefits from public services: The effects of local government spending on the distribution of income in Norway. Review of Income and Wealth, 52(1), 61–83. doi: 10.1111/j.1475-4991.2006.00176.x
- Banzhaf, H. S., & Walsh, R. P. (2008). Do people vote with their feet? An empirical test of Tiebout. American Economic Review, 98(3), 843–863. doi: 10.1257/aer.98.3.843
- Banzhaf, H. S., & Walsh, R. P. (2013). Segregation and Tiebout sorting: The link between place-based investments and neighborhood tipping. Journal of Urban Economics, 74, 83–98. doi: 10.1016/j.jue.2012.09.006
- Bartik, T. J. (1991). The effects of property taxes and other local policies on the intra-metropolitan pattern of business location (pp. 57–80). Kalamazoo, MI: Upjohn Institute for Employment Research.
- Bartkowiak, N. (2017). The diversity of socioeconomic development of rural areas in Poland in The Western Borderland and the problem of post-state farm localities. Oeconomia Copernicana, 8(3), 417–431.
- Becker, G. S., & Chiswick, B. R. (1966). Education and the distribution of earning. American Economic Review, 56, 358–369.
- Blundell, R., & Bond, S. (1998). Initial conditions and moment restrictions in dynamic panel data models. Journal of Econometrics, 87(1), 115–143. doi: 10.1016/S0304-4076(98)00009-8
- Chan, K., & Wang, M. (2008). Remapping China's regional inequalities, 1990–2006: A new assessment of de facto and de jure population data. Eurasian Geography and Economics, 49(1), 21–55. doi: 10.2747/1539-7216.49.1.21
- Chan, K. (2009). The Chinese hukou system at 50. Eurasian Geography and Economics, 50(2), 197–221. doi: 10.2747/1539-7216.50.2.197
- Chan, K. W. (2013). China internal migration. In I. Ness & P. Bellwood (Eds.), The encyclopedia of global migration. Oxford, UK: Blackwell Publishing.
- Chen, Y., & Hoy, C. (2011). Explaining migrants’ economic vulnerability in urban China: Institutional discrimination and market imperatives. Asian Population Studies, 7(2), 123–136. doi: 10.1080/17441730.2011.576816
- Cohen, J., & Monaco, K. (2008). Ports and highways infrastructure: An analysis of intra-and interstate spillovers. International Regional Science Review, 31(3), 257–274. doi: 10.1177/0160017608318946
- Corak, M. (2013). Income inequality, equality of opportunity, and intergenerational mobility. Journal of Economic Perspectives, 27(3), 79–102. doi: 10.1257/jep.27.3.79
- Démurger, S., Gurgand, M., Li, S., & Yue, X. (2009). Migrants as second-class workers in urban China? A decomposition analysis. Journal of Comparative Economics, 37(4), 610–628. doi: 10.1016/j.jce.2009.04.008
- Démurger, S., Li, S., & Yang, J. (2012). Earnings differentials between the public and private sectors in China: Exploring changes for urban local residents in the 2000s. China Economic Review, 23(1), 138–153. doi: 10.1016/j.chieco.2011.08.007
- Fields, G., & Song, Y. (2019). Modeling migration barriers in a two-sector framework: A welfare analysis of the hukou reform in China. Economic Modelling. Advance online publication. doi: 10.1016/j.econmod.2019.04.019
- Fu, Q., & Ren, Q. (2010). Educational inequality under China's rural–urban divide: The hukou system and return to education. Environment and Planning A: Economy and Space, 42(3), 592–610. doi: 10.1068/a42101
- Gao, J., Liu, Y., Chen, J., & Cai, Y. (2019). Demystifying the geography of income inequality in rural China: A transitional framework. Journal of Rural Studies. Advance online publication. doi: 10.1016/j.jrurstud.2019.01.010
- Gravemeyer, S., Gries, T., & Xue, J. (2011). Income determination and income discrimination in Shenzhen. Urban Studies, 48(7), 1457–1475. doi: 10.1177/0042098010375317
- Hansen, B. E. (1999). Threshold effects in non-dynamic panels: Estimation, testing, and inference. Journal of Econometrics, 2, 345–368. doi: 10.1016/S0304-4076(99)00025-1
- He, L., & Sato, H. (2011). Income redistribution in urban China by social security system—An empirical analysis based on annual and lifetime income. Contemporary Economic Policy, 30, 345–348. doi: 10.1111/j.1465-7287.2011.00301.x
- Huang, Y., & Zhang, Y. (2019). Financial inclusion and urban–rural income inequality: Long-run and short-run relationships. Emerging Markets Finance and Trade. Advance online publication. doi: 10.1080/1540496X.2018.1562896
- Kibriya, S., Bessler, D., & Price, E. (2019). Linkages between poverty and income inequality of urban–rural sector: A time series analysis of India’s urban-based aspirations from 1951 to 1994. Applied Economics Letters, 26(6), 446–453. doi: 10.1080/13504851.2018.1486973
- Li, S., & Luo, C. (2010). Re-estimating the income gap between urban and rural households in China. Procedia - Social and Behavioral Sciences, 2(5), 7151–7163. doi: 10.1016/j.sbspro.2010.05.068
- Molero-Simarro, R. (2017). Inequality in China revisited: The effect of functional distribution of income on urban top incomes, the urban-rural gap and the Gini index, 1978–2015. China Economic Review, 42, 101–117. doi: 10.1016/j.chieco.2016.11.006
- Munshi, K., & Rosenzweig, M. (2016). Networks and misallocation: Insurance, migration, and the rural-urban wage gap. American Economic Review, 106(1), 46–98. doi: 10.1257/aer.20131365
- Nie, H., & Xing, C. (2019). Education expansion, assortative marriage, and income inequality in China. China Economic Review, 55, 37. doi: 10.1016/j.chieco.2019.03.007
- Park, C. Y., & Mercado, J. R. (2018). Financial inclusion, poverty, and income inequality. The Singapore Economic Review, 63(01), 185–206. doi: 10.1142/S0217590818410059
- Qiu, L., & Zhao, D. (2019). Urban inclusiveness and income inequality in China. Regional Science and Urban Economics, 74, 57–64. doi: 10.1016/j.regsciurbeco.2018.11.006
- Ravallion, M., & Chen, S. (2007). China’s uneven progress against poverty. Journal of Development Economics, 82, 1–42. doi: 10.1016/j.jdeveco.2005.07.003
- Sicular, T., Ximing, Y., Gustafsson, B., & Shi, L. (2007). The urban–rural income gap and inequality in China. Review of Income and Wealth, 53(1), 93–126. doi: 10.1111/j.1475-4991.2007.00219.x
- Solinger, D. J. (1999). Contesting citizenship in urban china: Peasant migrants, the state, and the logic of the market. Berkeley, CA: University of California Press.
- Lall, S. V., & Lundberg, M. (2006). What are public services worth, and to whom? Non-parametric estimation of capitalization in Pune. Washington, DC: The World Bank.
- Song, Y. (2014). What should economists know about the current Chinese hukou system? China Economic Review, 29, 200–212. doi: 10.1016/j.chieco.2014.04.012
- Sun, W., Fu, Y., & Zheng, S. (2017). Local public service provision and spatial inequality in Chinese cities: The role of residential income sorting and land‐use conditions. Journal of Regional Science, 57(4), 547–567. doi: 10.1111/jors.12307
- Tiebout, C. M. (1956). A pure theory of local expenditures. Journal of Political Economy, 64(5), 416–424. doi: 10.1086/257839
- Wang, X., Shao, S., & Li, L. (2019). Agricultural inputs, urbanization, and urban-rural income disparity: Evidence from China. China Economic Review , 55, 67. doi: 10.1016/j.chieco.2019.03.009
- Whalley, J., & Zhang, S. (2007). A numerical simulation analysis of (Hukou) labour mobility restrictions in China. Journal of Development Economics, 83(2), 0–410.
- Wu, D., & Rao, P. (2017). Urbanization and income inequality in China: An empirical investigation at provincial level. Social Indicators Research, 131(1), 189–214. doi: 10.1007/s11205-016-1229-1
- Yang, J., & Qiu, M. (2016). The impact of education on income inequality and intergenerational mobility. China Economic Review, 37, 110–125. doi: 10.1016/j.chieco.2015.12.009
- Yang, Y. C., Nie, P. Y., Liu, H. T., & Shen, M. H. (2018). On the welfare effects of subsidy game for renewable energy investment: Toward a dynamic equilibrium model. Renewable Energy, 121, 420–428.
- Young, A. (2013). Inequality, the urban-rural gap, and migration. The Quarterly Journal of Economics, 128(4), 1727–1785. doi: 10.1093/qje/qjt025
- Zhang, L., Yi, H., Luo, R., Liu, C., & Rozelle, S. (2013). The human capital roots of the middle income trap: The case of China. Agricultural Economics, 44(s1), 151–162. doi: 10.1111/agec.12059
- Zhou, J., & Zhao, W. (2019). Contributions of education to inequality of opportunity in income: A counterfactual estimation with data from China. Research in Social Stratification and Mobility, 59, 60–70. doi: 10.1016/j.rssm.2018.11.005