
 ?Mathematical formulae have been encoded as MathML and are displayed in this HTML version using MathJax in order to improve their display. Uncheck the box to turn MathJax off. This feature requires Javascript. Click on a formula to zoom.
Abstract
This article explores the necessity to store gold in chaotic eras from the perspective of geopolitical risk (G.P.R.). We examine the casual relationship between G.P.R. and gold price (G.P.) by applying the full- and sub-sample rolling-window bootstrap causality test. The positive effect from G.P.R. to G.P. reveals that gold should be stored in chaotic eras, due to its rising price during high risks of geopolitics. However, the negative effect does not confirm this view, G.P. may decrease during certain high G.P.R. periods, which are not necessary to store gold. G.P. may also increase during periods of low G.P.R., in order to hedge risks of economic crises, rather than geopolitical events. These results are inconsistent with the capital asset pricing model, which highlights a positive effect from G.P.R. to G.P. In turn, the positive influence of G.P. on G.P.R. points out that the gold market can be an effective predictor of the risks of geopolitics. In the context of an unstable pattern of global politics, investors and governments can benefit from the gold value in the chaotic eras to avoid losses and optimize investment. In turn, they can accurately predict G.P.R. based on G.P., in order to prevent G.P.R.s.
1. Introduction
Geopolitics is a perspective within political geography (Gearóid, Citation1999), and its risks include wars, terrorist acts, tensions, etc. between countries and states that can hinder peace and development in the world (Caldara & Iacoviello, Citation2017; Clance, Gupta, & Wohar, Citation2018). The outbreak of the Vietnam War worsens the balance of payments in U.S., which reduces gold reserves and increases the money supply to offset a large budget deficit, then it causes inflation (Douglass & Dyckman, Citation1970). These are the main reasons for the collapse of the Bretton Woods system, which is based on gold and the U.S. dollar as the main international reserve currency (Iwami, Citation1995). After the disutility of this system, the gold price (G.P.) begins to fluctuate intensely (Hsieh & Huizinga, Citation1987) and the rise in G.P. greatly affects by geopolitical factors, which may even cause golden bubbles (Zhao, Chang, Su, & Nian, Citation2015). Due to this feature, investors are willing to purchase gold as a stable asset during the periods of high geopolitical risk (G.P.R.), which leads to an increase in G.P. (Bialkowski, Bohl, Stephan, & Wisniewski, Citation2015). The rise in G.P. means that gold can be considered as a hedge or a safe haven in chaotic eras (Jamal, Refk, & Wohar, Citation2018; Jones & Sackley, Citation2016), so that gold should be considered to store, to avoid G.P.R. However, the effects from G.P.R. to G.P. are not always positive, such as the Gulf War that causes G.P. to fall sharply on the second day, and gold should not be stored at such times. Although the hedging or safe-haven ability of gold remains to be explored, countries still hold it as an important foreign exchange reserveFootnote1 to withstand risks (Aizenman & Inoue, Citation2013; Ghosh, Citation2016). In the sixteenth century, a large amount of gold could bring the country prosperity, but it also increases the possibility of wars emerging, thus increasing the G.P.R. (Kwarteng, Citation2014). Whether gold is to be stored in chaotic eras or not, we can evidence this from the interaction between G.P.R. and G.P. (e.g. if geopolitical events cause G.P. to increase, gold may be considered as a hedge or a safe haven of G.P.R., so it should be stored in chaotic eras, and vice versa). This relationship between these two variables can enable investors to predict G.P. according to G.P.R., which leads to measures to hedge G.P.R. and avoid losses in advance. In addition, it can also assist countries to prevent G.P.R. based on G.P., which can reduce geopolitical events and promote peaceful development.
The main purpose of this article is to investigate whether gold should be stored during high G.P.R. or not at the global level. On the one hand, the gold market is affected by risks around the world. The global geopolitical events, such as the Soviet–Afghan War, the Gulf War, the 9/11 Terrorist Attacks, the Iraq Invasion, the conflict between Russia and Ukraine and the tensions between U.S. and North Korea, have both positive and negative impacts on G.P. (Melvin & Sultan, Citation1990; Bialkowski et al., Citation2015). Other factors that may be mentioned are, in particular, oil crises (Zhao et al., Citation2015) and global economic crises (Bialkowski et al., Citation2015; Jun, Citation2009; Junttila, Pesonen, & Raatikainen, Citation2018), which are likely to cause high G.P.R. and the intense fluctuations of G.P. However, several studies find that policy uncertainty of countries which may lead to geopolitical events, has no significant impact on G.P. (Baur & Mcdermott, Citation2010; Blose, Citation2010; Wang, Citation2013). On the other hand, the fluctuations in G.P. can increase the possibility of G.P.R. (e.g. wars or tensions that may be triggered by interests’ conflicts or uncertainty). Gold has a peculiar role in stabilising the economy, hedging inflation (Conlon, Lucey, & Uddin, Citation2018) and exchange rate fluctuations (Qureshi, Rehman, & Qureshi, Citation2018), predicting crises (Bildirici, Kayıkçı, & Onat, Citation2016) and improving international credit (Bernstein, Citation1961). The appraisal of G.P. has an impact on the effective level of world reserves (Brodsky & Sampson, Citation1980), so that the fluctuations of G.P. also influence national interests and global development (Zhou, Han, & Yin, Citation2018). If changes in G.P. cause a conflict of interests or unfairness, which is likely to trigger a war between countries (Kuhn & Weidmann, Citation2015), global G.P.R. will increase at this time. Generally, we can conclude that G.R.P. and G.P. have a mutual influence that has a feature of worldwide. However, the interaction mechanism between G.P.R. and G.P. may be time-varying from global level, which has not been highlighted in existing studies. Therefore, this article attempts to fill the gaps in previous studies on the causality between these two variables.
There are several marginal contributions of this article. Firstly, the measurement of G.P.R. is mostly employed dummy variables (Ferrara, Citation2010; Medel, Citation2015; Zhang, Liu, Zhao, & Sun, Citation2018) in existing studies. Dummy variables are used as discrete (Mroz, Citation1999) and categorical variables (Yip & Tsang, Citation2007), which can only reflect whether there is a geopolitical event or not. The relationship between G.P.R. and G.P. may be influenced by the intensity of the geopolitical events, not only by the occurrence or not. For instance, G.P. has a huge rise during the Iranian revolution (Zhao et al., Citation2015), but it is rarely affected by geopolitical events with low risks (e.g. the duration is short, the degree of harm is small and the public has no inclination to hedge G.P.R.). If a geopolitical event with low risks, which value of the dummy variable is 1 and it has little impact on G.P. In this way, we may get the wrong conclusion that G.P.R. has no effect on the price of gold, so we should also consider the intensity of the geopolitical events. Therefore, we consider the G.P.R. index (Caldara & Iacoviello, Citation2017) to measure the risks of geopolitics and to evidence the necessity to store gold in chaotic eras. Secondly, since G.P. has a relationship with global G.P.R., the geopolitical events in a single region may ignore the other information that also interacts with G.P. It is a pioneering effort from us, to explore the causal relationship between G.P.R. and G.P. from a global level perspective. The empirical results do not always support the capital asset pricing model that indicates there is a positive impact from G.P.R. to G.P. Thirdly, previous studies exclusively apply the full-sample causality test, which assumes that there is only one causal relationship in the whole time series period. We apply the sub-sample test in order to reveal the time-varying causality between G.P.R. and G.P. With this method, the results can provide implications for gold investors (e.g. reasonably predict G.P. in advance based on G.P.R. to decide if it is a right time to store gold, in order to reduce losses and hedge risks) and governments (e.g. effectively prevent the future G.P.R. according to the trend of G.P., as well as optimizing foreign exchange reserve in order to ensure the security and stability of the country).
The structure of the rest of this article is organised as follows: Section 2 presents the relevant literature on this topic. Section 3 introduces the capital asset pricing model of G.P.R. and G.P. Section 4 reveals the models of full- and sub-sample causality test. Section 5 describes the data. Section 6 presents the results of the empirical analysis. Section 7 summarises the study of this article.
2. Literature review
We attempt to use G.P.R. and G.P. to represent the chaotic eras and gold market respectively. The question of whether gold should be stored in chaotic eras can be transformed into exploring the causal relationship between these two variables, which has received attention over the past decades. There are inconsistent views on the necessity to store gold in chaotic eras, due to the increase in G.P. during the periods of high G.P.R. Several studies confirm the view that G.P. is positively affected by G.P.R. Melvin and Sultan (Citation1990) reveal that political tensions in South Africa have reduced the production of gold, which has led to a shortage supply and a rise in G.P. Bialkowski et al. (Citation2015) present that the public is more inclined to invest in stable assets during high G.P.R. periods, such as gold, which undoubtedly increase the demand of it and cause G.P. to raise (also Zhao et al., Citation2015). Bilgin et al. (Citation2018) measure the uncertainty with four indicators, including the partisan conflicts, which may cause high G.P.R., and point out that it has a positive impact on G.P. As one of the factors affecting G.P.R., uncertainty also has a positive impact on G.P. (Bredin, Conlon, & Potì, Citation2015; Fang et al., Citation2018; Ischuk, Zhilkin, & Aikina, Citation2016), which highlights the hedging ability of gold. However, this view is not always confirmed. The Royal Bank of Canada (R.B.C.) states that the impact of geopolitical events on G.P. has been weakening over the past few years. There is also a negative effect from G.P.R. to G.P., which can ascertain it during the Gulf War. Blose (Citation2010) and Wang (2013) prove that the shocks of uncertainty which may lead to high G.P.R., have no impact on G.P., it means that storing gold at these times is not necessary. The hedging ability also varies across countries and it is useless to store gold to avoid risks of the global financial system in Australia, Canada, Japan and large emerging markets (Baur & Mcdermott, Citation2010).
In turn, the impact of the price of gold on G.P.R. is almost consistent, which argue that the change of G.P. may cause the risks of geopolitical events to move in the same direction. Gold is a necessary asset in foreign exchange reserves and plays an important role in global security, so there are effects from G.P. to G.P.R. (Kwarteng, Citation2014). The way in which gold market fluctuations lead to geopolitical events can be explained from the perspective of national interests and uncertainty. It means that due to the fact that gold has an indispensable position in each country around the world (Aizenman & Inoue, Citation2013; Ghosh, Citation2016), the changes in G.P. will not only affect the foreign exchange reserves (Brodsky & Sampson, Citation1980), but also has influences on the national interests (e.g. economic development and foreign trade). Hence, conflicts of interests may trigger wars (Kuhn & Weidmann, Citation2015) and may even cause the G.P.R. worse. It also indicates that national uncertainty is affected by G.P. (Raza, Shah, & Shahbaz, Citation2018), and the gold shocks contribute to the probability of high-uncertainty regime (Zhou et al., Citation2018). Moreover, Piffer and Podstawski (Citation2018) reveal that G.P. can be applied as a useful tool to identify the shocks of uncertainty. Thereby, high uncertainty is a source of market failure (Casalino, Citation2001) and may trigger geopolitical events.
Previous studies mainly reveal a one-way effect of G.P.R. on G.P. or vice versa, but explorations of the mutual relationship between the two variables are relatively few. Balcilar, Gupta, and Pierdzioch (Citation2016) and Raza et al. (Citation2018) apply a nonparametric causality-in-quantiles test and notice that uncertainty can explain the fluctuations of G.P. Jiang (Citation2018) benefits from a parametric test of Granger causality in quantiles, which can evidence that partisan conflicts matter for gold returns only when the gold market is in a bullish situation, and this important effect covers any distribution of its volatility. Consequently, the causal relationship between G.P.R. and G.P. from the global level perspective has not been clarified in previous studies, and the representation of geopolitical events can be more comprehensive to reflect the chaotic eras. In addition, existing studies cannot identify the time-varying causal relationship between these two variables and present the direction of influence from G.P.R. to G.P. and vice versa. In this article, we apply the sub-sample causality test to analyse the impacts of geopolitical events on G.P., which can evidence whether gold should be stored in chaotic eras and what important roles the fluctuations of gold markets play in G.P.R.
3. Capital asset pricing model of G.P.R. and G.P
We employ a capital asset pricing model (Cifarelli & Paladino, Citation2010) to analyse the fluctuations in the gold market and obtain the relationship between G.P.R. and G.P. Firstly, we assume that there are two kinds of investors in gold market, informed traders who consider risk-return while investing and feedback traders who account for the serial correlation of G.P. Secondly, we suppose that the risk cannot be eliminated by diversifying investments in gold market, represented by G.P.R., which is systematic and highlighted by informed traders. They will make reasonable predictions about future G.P. based on G.P.R. and will decide the amount of gold to hold, the demand of this group as follow:
(1)
(1)
where
is the proportion of the gold demand held by informed traders of t period.
means that its value is positive and
indicates that the rise in G.P.R. will cause
to increase.
is a return of gold that there is no G.P.R.
is a conditional expectation of G.P. under the information at time t-1.
is an ex post G.P. of t period. If there only are informed traders in gold market, the value of
is 1, then Equationequation (1)
(1)
(1) can be converted to the standard capital asset pricing model (Sharpe, Citation1964) and rewritten as Equationequation (2)
(2)
(2) . Thereby, we can present that the rise in G.P.R. will cause G.P. to increase, which also means that gold should be stored in chaotic eras due to its high price.
(2)
(2)
Then, we consider another part of gold investors: feedback traders. They will follow the gold market and decide the current investment based on the previous G.P., their proportion of the gold demand () as follow:
(3)
(3)
where
means that feedback traders will buy (or sell) gold if the changes of G.P. during the previous period is positive (or negative), which will makes gold market more volatile, and vice versa. If there are informed and feedback traders in gold market, the value of
and Equationequation (1)
(1)
(1) can be rewritten as follow:
(4)
(4)
Compared to Equationequation (2)(2)
(2) , Equationequation (4)
(4)
(4) adds a term of
which reflects the feedback behaviour and it will make gold market more or less volatile. The total coefficient of
is
which is a positive value due to
Thus, whether there are feedback traders in the gold market or not, G.P.R. has a positive impact on G.P. From the capital asset pricing model, we can prove that the fluctuations in G.P.R. will determine G.P. to move in the same direction. High G.P.R. means that there is a geopolitical event, such as a war or conflict, G.P. will remain at a high level which can compensate for the risk of geopolitics. We can also evidence that gold can serve as a hedge or a safe haven of G.P.R. due to its price increase, so it should be stored in chaotic eras.
4. Methodology
4.1. Bootstrap full-sample causality test
The statistics in the traditional vector autoregressive (V.A.R.) model for the Granger causality test may not be conform to the standard asymptotic distribution, which will lead to inaccurate analysis results. This problem can be addressed according to Shukur and Mantalos (Citation1997), which have developed the residual-based bootstrap (RB) method’s critical values and prove that this method can improve the causal relationship test. Furthermore, they also ascertain that the characteristics of power and size can revise the likelihood ratio (LR) tests in a small sample (Shukur & Mantalos, Citation2000). Therefore, we apply the RB-based modified-LR statistic, which can accurately analyse the non-normally distributed variables, to test the causality between G.P.R. and G.P.
We construct the bivariate V.A.R. (p) process as follow:
(5)
(5)
where the optimal lag order p is determined by the smallest value of Schwarz Information Criterion (S.I.C.). In the V.A.R. (p) process, we denote X as G.P.R. and G.P., that is
Then, we can rewrite the Equationequation (5)
(5)
(5) as follow:
(6)
(6)
where
is a white-noise process with zero mean and covariance matrix:
i, j = 1, 2 and L denotes the lag operator, defined as
Then, we can test the null hypothesis that G.P. has no impact on G.P.R. (β12, k=0 for k = 1, 2, …., p) and the inverse null hypothesis that G.P.R. has no influence on G.P. (β21, k=0 for k = 1, 2, …., p) based on the Equationequation (6)(6)
(6) . We can reject these null hypotheses if G.P. will cause G.P.R. to fluctuate significantly and vice versa.
4.2. Parameter stability test
In the bootstrap full-sample causality test, it is assumed that the parameters have no structural change. However, in practice, this assumption is not always satisfied, therefore it is unreasonable to perform the full-sample causality test. Thereby, we employ the Sup-F, Ave-F and Exp-F tests, developed by Andrews (Citation1993) and Andrews and Ploberger (Citation1994), to test the stability of the parameters. The Sup-F can test for a sudden structural change, the Ave-F and Exp-F can test whether the parameters have evolved gradually over the time trajectory or not. We also apply the Lc statistics test, developed by Nyblom (Citation1989) and Hansen (1992), which can test the parameters in the VAR models follow a random walk process or not. The time-varying parameters will cause the full-sample causality test to be unreliable, so the bootstrap sub-sample rolling-window test can be applied to analyse the causal relationship between the two variables.
4.3. Bootstrap sub-sample rolling-window causality test
The Sup-F, Ave-F, Exp-F and Lctests are used to analyse the applicability of the bootstrap full-sample causality test and the accuracy of its causal results. If the parameters of V.A.R. models are not stable, there may be time-varying causal relationship between the two variables. Then, we use the bootstrap sub-sample rolling-window test, which developed by Balcilar, Ozdemir, and Arslanturk (Citation2010). This method divides the whole time series into small samples based on the rolling-window width. The divided small samples are gradually scrolled from the beginning to the end of the whole time series. The detailed steps are as follows: Assume that the length of time series is T and the sample length is l. The end of each sub-sample is l, l + 1, …., T and T-l + 1 sub-samples can be achieved. We can obtain a causality test result of each sub-sample by employing the RB-based modified-LR test. The results of the bootstrap sub-sample rolling-window causality test can be obtained by summarising all the observed p-values and LR statistics in chronological order. The average of quite a large number of estimation represents the effect from G.P. to G.P.R. and
has the opposite meaning, where
denotes the times of bootstrap repetitions.
and
are estimations from the bivariate V.A.R. system. This article considers a 90% confidence interval, as well as the corresponding lower and upper bounds being the 5th and 95th quantiles of
and
respectively (Balcilar et al., Citation2010).
5. Data
We select the monthly data to test the causality between G.P.R. and G.P. from 1979:M1 to 2018:M12, and further continue to explore whether gold should be stored in chaotic eras. There have been frequent global geopolitical events in 1979, such as the China–Vietnam border self-defense counterattacks and the Soviet–Afghan war. Since then, the thousands of geopolitical events happen around the world, such as the Gulf War, the 9/11 Terrorist Attacks, the Iraq Invasion, which increase the risks of global geopolitics. The measurements of these risks employ dummy variables (Ferrara, Citation2010; Medel, Citation2015; Zhang et al., Citation2018) in existing studies that can be improved and more comprehensive. In this article, we consider the G.P.R. index (G.P.R.)Footnote2 developed by Caldara and Iacoviello (Citation2017), which identifies contents related to G.P.R.s, military-related tensions, nuclear tensions, war threats, terrorist threats and actual adverse geopolitical events from 11 national and international newspapers.Footnote3 The higher G.P.R. means that global geopolitics is more risky and vice versa. In this article, in order to eliminate the potential heteroscedasticity, G.P.R. is transformed by taking into consideration the natural logarithms. The U.K. has abolished all foreign exchange controls in October 1979, and the change of its G.P. is seen as a barometer of international gold market prices. Moreover, G.P. is closely related to G.P.R. from 1979. China–Vietnam border self-defense counterattacks and the Soviet–Afghan war make G.P.R. increase dramatically, then the price of gold has also raised approximately 100% in 1979:M12 from 1979:M1. The close relationship between G.P.R. and G.P. can also be found in later geopolitical events. It can be observed that the occurrences of conflicts and wars coincide with the rise in G.P., so there may be a mutual influence between global politics and gold market. We use the monthly average price of gold in U.S. dollars,Footnote4 which is transformed by taking into account of natural logarithms and first differences to avoid the non-stationary, and analyse the relationship between these two variables. shows the trends of G.P.R. and G.P.Footnote5
Figure 1. The trends of G.P.R. and G.P.
Notes: There are thousands of geopolitical events from 1979:M1–2018:M12 in the world, due to space limitations, we only label the events with high G.P.R., which have large intensity and their influences are huge. Source: Authors’ Calculations.
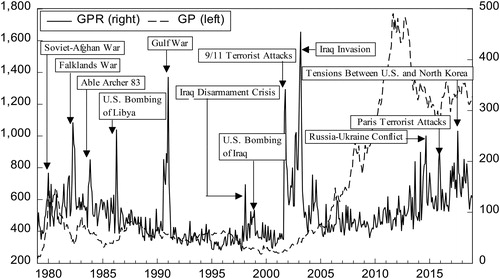
From , we can notice that G.P. does not increase in all periods with G.P.R., which means that it is not necessarily to store gold in chaotic eras. During most geopolitical events, G.P. will move in the same direction as G.P.R. At the end of December 1979, the Soviet Union sent troops to Afghanistan, which raised the G.P.R. At the same time, the price of gold exceeded $500 per troy ounce, and this sharp increase has still continued until 1980. Terrorist organisations hit the U.S. World Trade Center and the Pentagon on 11 September 2001, G.P. has surged on the same day then it has fluctuated at a high level. The outbreak of the Iraq war in 2003 not only increased G.P.R. to its highest level, but also caused G.P. to show an upward trend with small fluctuations. Similar findings can be obtained from the Libyan War in 2011, the Paris terrorist attacks in 2015, tensions between the U.S. and North Korea in 2017, and so on. However, there are few periods that G.P. and G.P.R. change in the opposite direction. The Gulf War broke out on 17 January 1991, which has caused G.P.R. to increase rapidly, the public has rushed to sell gold and G.P. has fallen sharply. This opposite direction also occurred in the Yemen War in 2015. Since the Iraq war, G.P. has begun to soar partly due to the global economic crisis and the loose monetary policy of the Federal Reserve System (Fed), even G.P.R. at a relatively low level. Despite the high G.P.R. during 2013 and 2014 (e.g. the Syrian crisis and the Russia–Ukraine conflict), G.P. shown a downward trend. Consequently, the interaction between G.P.R. and G.P. has the characteristics of time variation and complexity.
presents the descriptive statistics. The means of G.P.R. and G.P. denote that their series are concentrated at the 96.505 and 632.386 levels, respectively. The skewness of G.P.R. and G.P. are both positive. The kurtosis of G.P.R. demonstrates the feature of a fat-tailand. Moreover, the Jarque-Bera test proves that G.P.R. and G.P. are significantly non-normally distributed at 1% level. Therefore, it is inappropriate to apply the traditional V.A.R. models for Granger causality test. In order to ensure the reliability and accuracy of the results, we perform the bootstrap sub-sample rolling-window causality test and analyse the interaction between these two variables.
Table 1. Descriptive statistics for G.P.R. and G.P.
6. Empirical results
6.1. Bootstrap full-sample causality test
We construct bivariate V.A.R. models with G.P.R. and G.P. to estimate the full-sample causal relationship, which is based on the Equationequation (6)(6)
(6) . According to S.I.C., the optimal lag order selected is 2. The results of the full-sample tests are presented in . We can observe that the p-values of the interaction between G.P.R. and G.P. are not significant, which means that G.P.R. does not Granger cause G.P. and vice versa. These results are in conflict with previous studies (Melvin & Sultan, Citation1990; Bialkowski et al., Citation2015) and the capital asset pricing model.
Table 2. Full-sample Granger causality tests.
6.2. Parameter stability test
In the V.A.R. models with G.P.R. and G.P. are considered a full-sample in estimations, which fixes the values of the parameters, so there is only one causal relationship in the whole time series period. However, the parameters may not be constant due to the structural changes in the V.A.R. system, and the causality between G.P.R. and G.P. may present a feature of time-variations (Balcilar & Ozdemir, Citation2013). This feature in the V.A.R. models with G.P.R. and G.P. can be investigated by using the Sup-F, Ave-F and Exp-F tests (Andrews, Citation1993; Andrews & Ploberger, Citation1994), in order to improve the accuracy of the causality analysis. We also apply the Lc statistics test, developed by Nyblom (Citation1989) and Hansen (1992), to prove whether the parameters in the V.A.R. models follow a random walk process. The results of parameter stability test are reported in .
Table 3. The results of parameter stability test.
From , the Sup-F tests highlights that there is a sudden structural change in the G.P.R. and the V.A.R. system at 1% level and in the G.P. at 10% level. The Ave-F test suggests that parameters may gradually evolve along the time trajectory in the G.P.R. and the V.A.R. system at 1% level, but not significant in the G.P. The Exp-F test also proves the time-varying parameters in the G.P.R. and the V.A.R. models at 1% level and in the G.P. at 10% level. And the Lc statistics test against the null hypothesis that parameters of the V.A.R. models follow a random walk process at the 10% level, which evidences non-stable parameters in the V.A.R. system. The Sup-F, Ave-F, Exp-F and Lcstatistics tests show that the parameters are significantly non-constant in the time series (G.P.R. and G.P.) and the V.A.R. system. Therefore, the result of the full-sample causality test, which suggests there is no causality between G.P.R. and G.P., is not reliable. Then, we apply the sub-sample test, which uses the RB-based modified-LR method, to reveal the time-varying causality between G.P.R. and G.P.
6.3. Bootstrap sub-sample rolling-window causality test
In order to estimate the bootstrap p-values and LR-statistics, we apply the V.A.R. models in Equationequation (6)(6)
(6) . The null hypothesis is considered that G.P.R. does not Granger cause G.P. and vice versa. One of the most difficult aspects of this causality test is to choose the appropriate rolling-window width. A large one can improve the accuracy of the causality test, which reduces the number of scrolls, while a small one is difficult to ensure the reliability of the results. For this contradiction, Pesaran and Timmermann (Citation2005) point out that the rolling-window width should not be less than 20, if the parameters are not constant. In this article, we select 24 monthsFootnote6 as the width of rolling-window to ensure the accuracy of our causality analysis. In addition, we can also investigate the direction of the effect from G.P.R. to G.P. (or the effect from G.P. to G.P.R.) by employing this sub-sample test.
6.4. Results and discussion
and present the bootstrap probability value and the direction of the effect from G.P.R. to G.P., respectively. The null hypothesis that G.P.R. has no impact on G.P. may be rejected in the periods of 1998:M4–1999:M9, 2007:M6–2007:M12, 2010:M8–2011:M4, 2013:M4–2014:M8 and 2016:M12–2017:M9 at the significance level of 10%. There are positive (1998:M4–1999:M9 and 2016:M12–2017:M9) and negative effects (2007:M6–2007:M12, 2010:M8–2011:M4 and 2013:M4–2014:M8) from G.P.R. to G.P.
Figure 2. Bootstrap p-values of rolling test statistic testing the null hypothesis that G.P.R. does not Granger cause G.P. Source: Authors’ Calculations.
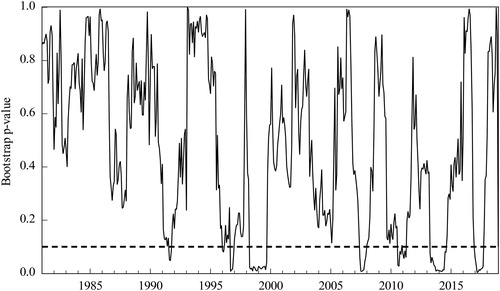
Figure 3. Bootstrap estimates of the sum of the rolling-window coefficients for the impact of G.P.R. on G.P. Source: Authors’ Calculations.
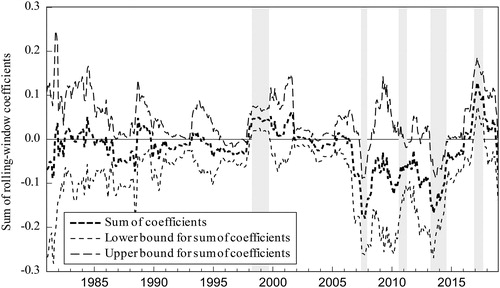
The periods of positive effects can evidence that gold should be stored in chaotic eras. During 1998:M4-1999:M9, there are chaotic eras, including the Eritrean border war has that broken out in May 1998 (Kjetil, Citation1999), the U.S. has launched an air strike against Iraq in December 1998 (Mcinnes, Citation2003) and the Kosovo War has lasted from March to June 1999 (Cohrs & Moschner, Citation2002). These wars, conflicts and tensions between countries undoubtedly increase the G.P.R. (Caldara & Iacoviello, Citation2017), which have caused the public to fear and to be less confident (Cheung & Blunden, Citation2008). In turn, the pessimistic sentiment will cause the demand of hedging assets to raise, such as gold, and also lead to a rise in GP (Balcilar, Bonato, Demirer, & Gupta, Citation2017). On the contrary, when the risk of geopolitical events has reduced, the price of gold may also move in the same direction. In general, G.P.R. has a positive impact on G.P. in 1998:M4–1999:M9. This explanation also applies adequately to another time period with a positive impact. In 2016:M12–2017:M9, there are lots of geopolitical events around the world, such as the truck attack in Berlin in December 2016 (Michal, Yaakov, & Shani, Citation2018), the Damascus bomb attack in January 2017, the shooting of the British Parliament Building in March 2017, the escalation of tensions (e.g., the U.S. President Donald Trump has repeatedly warned North Korea not to attack Guam or U.S. allies) between the U.S. and North Korea in August 2017 and the London subway bombing in September 2017. Consequently, we can conclude that the global geopolitical events will raise the price of gold, this result supports the capital asset pricing model, which states that G.P.R. has a positive influence on G.P. Due to this feature, gold should be stored as a hedging asset to avoid G.P.R. during 1998:M4–1999:M9 and 2016:M12–2017:M9.
The periods of negative effects can be understood from two aspects: the stimulus of the economic crises (2007:M6–2007:M12 and 2010:M8–2011:M4) and the values of other assets relative to gold (2013:M4–2014:M8). In 2007:M6–2007:M12, the G.P.R. is at a relatively low level, but G.P. continues to grow, stimulated more by the economic crisis rather than by geopolitical events. The U.S. subprime crisis, which has broken out in 2007 has two direct influences on G.P. On the one hand, it may reduce the value of other assets, such as the housing price (Goetzmann, Peng, & Yen, Citation2012) and the U.S. dollar (Galagedera & Kitamura, Citation2012). Since G.P. and the U.S. dollar are negatively related (Pukthuanthong & Roll, Citation2011), the depreciation of the dollar can reduce its demand and increase the investment of gold. On the other hand, it can also cause high uncertainty (e.g. a four trillion Renminbi stimulus package in China, unconventional monetary policies in the U.K., temporary amendments of short-term export credits in the European Commission, etc.), especially the erroneous policies such as the excessive increase in oil price (Taylor, Citation2009). Both direct impacts can raise the GP based on the demand level in 2007:M6–2007:M12, while G.P.R. is relatively low during this period. Hence, during the low G.P.R., the rise in G.P. can be explained by hedging risks of economic crisis rather than geopolitics, which means that there is a negative effect from G.P.R. to G.P. It can also be used to analyse the negative impact in 2010:M8–2011:M4, which is also in a low G.P.R. The rise in G.P. is caused by avoiding risks of the European debt crisis instead of geopolitical events. Therefore, even if G.P.R. is at a low level, G.P. will still increase due to the stimulus of the financial or economic crises rather than the geopolitical events, but can also prove the hedging ability of gold during high economic risks.
In 2013:M4–2014:M8, G.P.R. has soared due to the escalation of Syrian crisis in 2013 (Eickhoff, Citation2013), the Russian invasion to Crimea in March 2014 (Stephen, Citation2014) and the deterioration of Islamic State of Iraq and al Shams (I.S.I.S.) in 2014. G.P. should have risen, but in fact, it has fallen sharply during this period. The reasons underlying this phenomenon cannot be presented from the geopolitics, but in three economic ways: Firstly, the crises (e.g., the Greece's debt crisis and the rapidly rising rate of non-performing loans) cause the Cyprus to allow a rapid deterioration of finances (Orphanides, Citation2017), in order to raise fund, its government has sold the gold reserve of central bank, the rise in supply make GP under downward pressure. Secondly, several major institutions such as the Commerzbank have lowered the expected G.P. in 2013, which will reduce the confidence of investors. The pessimistic sentiment makes the demand reduction, and also drive G.P. to down (Balcilar et al., Citation2017). Above all, the essence of the fall in G.P. is the appreciation of the dollar. The Fed has gradually exited from quantitative easing (Q.E.) policy since 2013, which indicates the recovery of the U.S. economy (Wen, Citation2014), the public will be more optimistic about the dollar. Even if G.P.R. is at a high level, G.P. will still decrease due to the economic factors rather than the geopolitical events, so there is a negative effect from G.P.R. to G.P., and we can also ascertain that gold should not be stored during 2013:M4–2014:M8. These two forms of negative impact are the opposite of the result of capital asset pricing model.
and evidence the bootstrap probability value and the direction of the effect from G.P. to G.P.R., respectively. The null hypothesis that G.P. has no impact on G.P.R. can be rejected in the periods of 1995:M12–1996:M6 and 2014:M9–2015:M6. The influences from G.P. to G.P.R. are both positive in these two periods, these can reflect the indicative effect of G.P. on G.P.R.
Figure 4. Bootstrap p-values of rolling test statistic testing the null hypothesis that G.P. does not Granger cause G.P.R. Source: Authors’ Calculations.
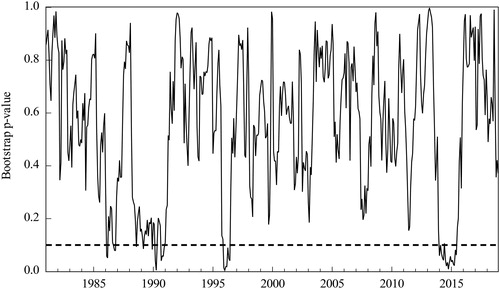
Figure 5. Bootstrap estimates of the sum of the rolling-window coefficients for the impact of G.P. on G.P.R. Source: Authors’ Calculations.
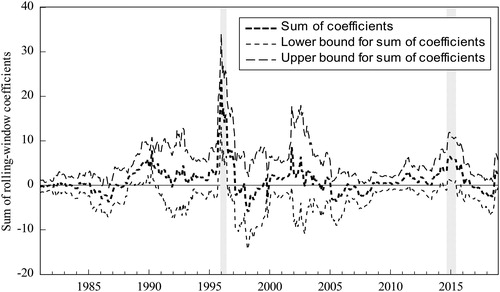
The fluctuations of G.P. in 1995:M12–1996:M6 mean that G.P.R. will move in the same direction, higher G.P. corresponds to a larger G.P.R. There are two reasons behind the rise in G.P. in early 1996. First, the U.S. funds have speculatively purchased gold in large amount which increase the demand. Second, the production of gold has been reduced in South Africa which is an important gold producer in the world (Bloch & Owusu, Citation2012), and the supply is decreasing. During this period, G.P.R. has also risen due to wars and conflicts, such as the fifth Taiwan Strait Crisis (Scobell, Citation2000). Therefore, the changes in G.P. indicate the fluctuations of G.P.R. and the price of gold is a useful tool to predict the risks of geopolitics. The positive effect can also be proved in 2014:M9–2015:M6, gold has achieved its highest price in January 2015, and one of the most risky geopolitical events has also occurred at the same month due to the attack on the headquarters of the Charlie Hebdo in France (Kim & Albert, Citation2018). The decline in G.P. has also occurred at this time due to the appreciation of the dollar (Pukthuanthong & Roll, Citation2011) and the rebounding of the U.S. stock market (Sohail, Sajid, & Kibria, Citation2014). Correspondingly, G.P.R. is also reduced due to the low frequency of wars and conflicts. Therefore, G.P. will cause G.P.R. to change in the same direction, which also inspire us that gold can be a good predictor of the risks of geopolitical events.
In conclusion, rolling-window causality test between G.P.R. and G.P. can solve the problem of non-constant parameters in time series and V.A.R. system, and the results reveal that there is a time-varying and mutual influence of these two variables. The issue on whether gold should be stored in chaotic eras cannot reveal a consistent conclusion. G.P. will increase in some high G.P.R. periods, while in other periods, this view cannot be held due to the economic factors rather than geopolitical events: excessive supply, the expected price of authoritative institutions and the appreciation of other assets (e.g., the dollar). The negative influence from G.P.R. to G.P. can also happen in global economic crisis, the rise in G.P. is to hedge risks of economic instability rather than geopolitical events, even if in a situation of low G.P.R. This result does not support the capital asset pricing model, which states that G.P.R. has a positive impact on G.P. In turn, the rise in G.P. will cause G.P.R. to increase, which provides a useful tool to predict the risks of geopolitical events, based on the gold market.
7. Conclusion
In order to evidence whether or not gold is to be stored in chaotic eras, we test the causal relationship between G.P.R. and G.P. We apply the full-sample test that ignores the non-stable parameters, and the results suggest that there is no causality between G.P.R. and G.P. Then, we consider the sub-sample test, which states that in some periods there is a causal relationship between these two variables. We observe that G.P.R. has both positive and negative impacts on G.P. The positive influence can evidence that the pessimistic sentiment in high G.P.R. increases the demand for gold, which also cause G.P. to raise, so it is necessary to store gold in chaotic eras. However, this view cannot be sustained when the negative effect is recorded during this period, G.P. is affected by other economic factors rather than the geopolitical events, especially by the appreciation of other assets. Although gold cannot hedge risks of geopolitical events in certain periods, it can still avoid the adverse effects of global economic crisis. These results are not consistent with the capital asset pricing model that underlines the positive effect from G.P.R. to G.P. In turn, the positive influence of G.P. on G.P.R. may indicate that the gold market can effectively predict the risks of geopolitical events. In general, the mutual relationship between the G.P.R. and G.P. can reveal that gold should not always be stored in chaotic eras, as the G.P. also depends on the economic factors (e.g., the global economic situation and the investment value). Therefore, in determining whether or not to store gold at the periods of geopolitical events, we need to take into account economic factors in a comprehensive manner. Understanding the need for gold storage in chaotic eras and the interaction mechanism between G.P.R. and G.P. can provide insights to investors and governments. Investors can predict the trend of G.P. based on the G.P.R. and decide whether to store gold, which can avoid risks, reduce losses and increase the value of investment. Governments can effectively prevent geopolitical events according to the trend of G.P. and adjust the structure of foreign exchange reserves, which can ensure the security and promote peace and development of the country.
Disclosure statement
No potential conflict of interest was reported by the author(s).
Additional information
Funding
Notes
1 In terms of gold-foreign exchange reserves ratio, the top three countries are the U.S. (71.9%), Germany (68.4%) and Italy (67%), all of them account for a large proportion.
2 The G.P.R. index is taken from http://www.policyuncertainty.com/gpr.html.
3 The 11 newspapers are as follow: The Boston Globe, Chicago Tribune, The Daily Telegraph, Financial Times, The Globe and Mail, The Guardian, Los Angeles Times, The New York Times, The Times, The Wall Street Journal and The Washington Post.
4 The price of gold in U.S. dollars is taken from The World Gold Council (https://www.gold.org/).
5 G.P.R.s include wars, terrorist acts, tensions, etc. between countries and states. These are not including economic or financial crises, such as the global financial crisis, the European sovereign debt crisis, the Brazilian economic crisis, the Turkish debt crisis and so on. In Figure 1, we list some geopolitical events with high risks, but we cannot show the economic or financial crises, because these are two completely different concepts.
6 To prove the reliability of the test results, we also use the rolling-window widths of 20-, 28- and 32- months to explore the causality, and the results are consistent with the 24-month rolling-window.
References
- Aizenman, J., & Inoue, K. (2013). Central banks and gold puzzles. Journal of the Japanese and International Economies, 28(2), 69–90. doi:10.1016/j.jjie.2013.02.001
- Andrews, D. W. K. (1993). Tests for parameter instability and structural change with unknown change point. Econometrica, 61(4), 821–856. doi:10.2307/2951764
- Andrews, D. W. K., & Ploberger, W. (1994). Optimal tests when a nuisance parameter is present only under the alternative. Econometrica, 62(6), 1383–1414. doi:10.2307/2951753
- Balcilar, M., Bonato, M., Demirer, R., & Gupta, R. (2017). The effect of investor sentiment on gold market return dynamics: Evidence from a nonparametric Causality-in-Quantiles approach. Resources Policy, 51, 77–84. doi:10.1016/j.resourpol.2016.11.009
- Balcilar, M., Gupta, R., & Pierdzioch, C. (2016). Does uncertainty move the gold price? New evidence from a nonparametric Causality-in-Quantiles test. Resources Policy, 49, 74–80. doi:10.1016/j.resourpol.2016.04.004
- Balcilar, M., & Ozdemir, Z. A. (2013). The export-output growth nexus in Japan: A bootstrap rolling window approach. Empirical Economics, 44(2), 639–660. doi:10.1007/s00181-012-0562-8
- Balcilar, M., Ozdemir, Z. A., & Arslanturk, Y. (2010). Economic growth and energy consumption causal nexus viewed through a bootstrap rolling window. Energy Economics, 32(6), 1398–1410. doi:10.1016/j.eneco.2010.05.015
- Baur, D. G., & Mcdermott, T. K. (2010). Is gold a safe haven? International evidence. Journal of Banking & Finance, 34(8), 1886–1898. doi:10.1016/j.jbankfin.2009.12.008
- Bernstein, E. M. (1961). The adequacy of United States gold reserve. American Economic Review, 51(2), 439–446.
- Bialkowski, J., Bohl, M. T., Stephan, P. M., & Wisniewski, T. P. (2015). The gold price in times of crisis. International Review of Financial Analysis, 41, 329–339. doi:10.1016/j.irfa.2014.07.001
- Bildirici, M., Kayıkçı, F., & Onat, I. S. (2016). BDI, gold price and economic growth. Procedia Economics and Finance, 38, 280–286. doi:10.1016/S2212-5671(16)30200-3
- Bilgin, M. H., Gozgor, G., Lau, C. K. M., & Sheng, X. (2018). The effects of uncertainty measures on the price of gold. International Review of Financial Analysis, 58, 1–7. doi:10.1016/j.irfa.2018.03.009
- Bloch, R., & Owusu, G. (2012). Linkages in Ghana's gold mining industry: Challenging the enclave thesis. Resources Policy, 37(4), 434–442. doi:10.1016/j.resourpol.2012.06.004
- Blose, L. E. (2010). Gold prices, cost of carry, and expected inflation. Journal of Economics and Business, 62(1), 35–47. doi:10.1016/j.jeconbus.2009.07.001
- Bredin, D., Conlon, T., & Potì, V. (2015). Does gold glitter in the long-run? Gold as a hedge and safe haven across time and investment horizon. International Review of Financial Analysis, 41, 320–328. doi:10.1016/j.irfa.2015.01.010
- Brodsky, D. A., & Sampson, G. P. (1980). The value of gold as a reserve asset. World Development, 8(3), 175–192. doi:10.1016/0305-750X(80)90008-X
- Caldara, D., & Iacoviello, M. (2017). Measuring geopolitical risk. Working Paper, Board of Governors of the Federal Reserve System.
- Casalino, L. (2001). Managing uncertainty: Intermediate organizations as triple agents. Journal of Health Politics, Policy and Law, 26(5), 1055–1068. doi:10.1215/03616878-26-5-1055
- Cheung, V., & Blunden, B. (2008). The emotional construal of war: Anger, fear, and other negative emotions. Peace and Conflict: Journal of Peace Psychology, 14(2), 123–150. doi:10.1080/10781910802017289
- Cifarelli, G., & Paladino, G. (2010). Oil price dynamics and speculation: A multivariate financial approach. Energy Economics, 32(2), 363–372. doi:10.1016/j.eneco.2009.08.014
- Clance, M. W., Gupta, R., & Wohar, M. E. (2018). Geopolitical risks and recessions in a panel of advanced economies: Evidence from over a century of data. Working Papers University of Pretoria, Department of Economics.
- Cohrs, J. C., & Moschner, B. (2002). Antiwar knowledge and generalized political attitudes as determinants of attitude toward the Kosovo War. Peace and Conflict: Journal of Peace Psychology, 8(2), 139–155. doi:10.1207/S15327949PAC0802_03
- Conlon, T., Lucey, B. M., & Uddin, G. S. (2018). Is gold a hedge against inflation? A wavelet time-scale perspective. Review of Quantitative Finance and Accounting, 51(2), 317–345. doi:10.1007/s11156-017-0672-7
- Douglass, B. L., Dyckman, J. W. (1970). Economic impacts of the Vietnam War: A primer. Journal of the American Institute of Planners, 36(5), 298–309. doi:10.1080/01944367008977325
- Eickhoff, D. (2013). The public presidency and military intervention in Syria. New York, USA: Social Science Electronic Publishing.
- Fang, L., Chen, B., Yu, H., & Qian, Y. (2018). The importance of global economic policy uncertainty in predicting gold futures market volatility: A GARCH-MIDAS approach. Journal of Futures Markets, 38(3), 413–422. doi:10.1002/fut.21897
- Ferrara, G. E. L. (2010). The economic effects of violent conflict: Evidence from asset market reactions. Journal of Peace Research, 47(6), 671–684.
- Galagedera, D. U. A., & Kitamura, Y. (2012). Effect of exchange rate return on volatility spill-over across trading regions. Japan and the World Economy, 24(4), 254–265. doi:10.1016/j.japwor.2012.07.003
- Gearóid, Ó. T. (1999). Understanding critical geopolitics: Geopolitics and risk society. Journal of Strategic Studies, 22(2–3), 107–124.
- Ghosh, A. (2016). What drives gold demand in Central Bank's foreign exchange reserve portfolio? Finance Research Letters, 17, 146–150. doi:10.1016/j.frl.2016.03.007
- Goetzmann, W. N., Peng, L., & Yen, J. (2012). The subprime crisis and house price appreciation. The Journal of Real Estate Finance and Economics, 44(1–2), 36–66. doi:10.1007/s11146-011-9321-4
- Hansen, B. E. (1992). Tests for parameter instability in regressions with I(1) processes. Journal of Business and Economic Statistics, 20, 45–59.
- Hsieh, D. A., & Huizinga, J. (1987). Gold in the optimal portfolio. The reconstruction of international monetary arrangements. London: Palgrave Macmillan UK.
- Ischuk, T. L., Zhilkin, D. V., & Aikina, T. Y. (2016). Gold as a tool for hedging financial risks. IOP Conference Series: Earth and Environmental Science, vol. 43, no. 1. doi:10.1088/1755-1315/43/1/012085
- Iwami, T. (1995). The Bretton Woods System as a gold exchange standard. Japan in the International Financial System. London: Palgrave Macmillan UK.
- Jamal, B., Refk, S., & Wohar, M. E. (2018). Measuring the response of gold prices to uncertainty: An analysis beyond the mean. Economic Modelling, 75, 105–116. doi:10.1016/j.econmod.2018.06.010
- Jiang, Y. (2018). Does strategic commodities price respond to U.S. Partisan conflict? Evidence from a parametric test of Granger Causality in Quantiles. Working Paper, arXiv.org.
- Jones, A. T., & Sackley, W. H. (2016). An uncertain suggestion for gold-pricing models: The effect of economic policy uncertainty on gold prices. Journal of Economics and Finance, 40(2), 367–379. doi:10.1007/s12197-014-9313-3
- Jun, J. H. (2009). Global financial crisis and gold market. Social Science Electronic Publishing.
- Junttila, J. P., Pesonen, J., & Raatikainen, J. (2018). Commodity market based hedging against stock market risk in times of financial crisis: The case of crude oil and gold. Journal of International Financial Markets Institutions & Money, 56, 255–280. doi:10.1016/j.intfin.2018.01.002
- Kim, D., & Albert, K. Y. I. (2018). Mental health cost of terrorism: Study of the Charlie Hebdo Attack in Paris. Health Economics, 27(1), e1–14. doi:10.1002/hec.3520
- Kjetil, T. (1999). Borders of violence-boundaries of identity: Demarcating the Eritrean Nation-State. Ethnic and Racial Studies, 22(6), 1037–1060.
- Kuhn, P. M., & Weidmann, N. B. (2015). Unequal we fight: Between- and within-group inequality and Ethnic Civil War. Political Science Research and Methods, 3(3), 543–568. doi:10.1017/psrm.2015.7
- Kwarteng, K. (2014). War and gold: A five-hundred-year history of empires, adventures and debt. London: Bloomsbury.
- Mcinnes, C. (2003). A different kind of war? September 11 and the United States Afghan War. Review of International Studies, 29(2), 165–184. doi:10.1017/S0260210503001657
- Medel, C. (2015). Producers, politicians, warriors, and forecasters: Who's who in the oil market. MPRA Paper, University Library of Munich.
- Melvin, M., & Sultan, J. (1990). South African political unrest, oil prices, and the time varying risk premium in the gold futures market. Journal of Futures Markets, 10(2), 103–111. doi:10.1002/fut.3990100202
- Michal, M. S., Yaakov, H., & Shani, P. P. (2018). Truck attack: Fear of ISIS and reminder of Truck Attacks in Europe as associated with psychological distress and PTSD symptoms. Psychiatry Research, 267, 306–312.
- Mroz, T. A. (1999). Discrete factor approximations in simultaneous equation models: Estimating the impact of a dummy endogenous variable on a continuous outcome – France before and after the revolution of 1789. Journal of Econometrics, 92(2), 233–274. doi:10.1016/S0304-4076(98)00091-8
- Nyblom, J. (1989). Testing for the constancy of parameters over time. Journal of the American Statistical Association, 84(405), 223–230. doi:10.1080/01621459.1989.10478759
- Orphanides, A. (2017). What happened in Cyprus? The economic consequences of the last communist government in Europe. New York, USA: Social Science Electronic Publishing.
- Pesaran, M. H., & Timmermann, A. (2005). Small sample properties of forecasts from autoregressive models under structural breaks. Journal of Econometrics, 129(1–2), 183–217. doi:10.1016/j.jeconom.2004.09.007
- Piffer, M., & Podstawski, M. (2018). Identifying uncertainty shocks using the price of gold. The Economic Journal, 128(616), 3266–3284. doi:10.1111/ecoj.12545
- Pukthuanthong, K., & Roll, R. (2011). Gold and the dollar (and the euro, pound, and yen). Journal of Banking & Finance, 35(8), 2070–2083. doi:10.1016/j.jbankfin.2011.01.014
- Qureshi, S., Rehman, I. U., & Qureshi, F. (2018). Does gold act as a safe haven against exchange rate fluctuations? The case of Pakistan Rupee. Journal of Policy Modeling, 40(4), 685–708. doi:10.1016/j.jpolmod.2018.02.005
- Raza, S. A., Shah, N., & Shahbaz, M. (2018). Does economic policy uncertainty influence gold prices? Evidence from a nonparametric Causality-in-Quantiles approach. Resources Policy, 57, 61–68. doi:10.1016/j.resourpol.2018.01.007
- Scobell, A. (2000). Show of force: Chinese soldiers, statesmen, and the 1995-1996 Taiwan Strait Crisis. Political Science Quarterly, 115(2), 227–246. doi:10.2307/2657901
- Sharpe, W. F. (1964). Capital asset prices: A theory of market equilibrium under conditions of risk. The Journal of Finance, 19(3), 425–442. doi:10.2307/2977928
- Shukur, G., & Mantalos, P. (1997). Size and power of the RESET test as applied to systems of equations: A bootstrap approach. Working Paper, Department of Statistics, University of Lund.
- Shukur, G., & Mantalos, P. (2000). A simple investigation of the granger-causality test in integrated-cointegrated VAR systems. Journal of Applied Statistics, 27(8), 1021–1031. doi:10.1080/02664760050173346
- Sohail, N., Sajid, M., & Kibria, U. (2014). How prices of gold harmonize to stock index: Analysis of South Asian Stock Exchanges. International Journal of Research in Social Sciences, 4(1), 416–430.
- Stephen, B. N. (2014). Responding to the Russian Invasion of Crimea: Policy recommendations for US and European leaders. European View, 13(1), 143–152.
- Taylor, J. B. (2009). Economic policy and the financial crisis: An empirical analysis of what went wrong. Critical Review, 21(2–3), 341–364. doi:10.1080/08913810902974865
- Wang, K. M. (2013). Can gold effectively hedge risks of exchange rate? Journal of Business Economics and Management, 14(5), 833–851. doi:10.3846/16111699.2012.670133
- Wen, Y. (2014). When and how to exit quantitative easing? Review, 96(3), 243–265. doi:10.20955/r.96.243-265
- Yip, P. S. L., & Tsang, E. W. K. (2007). Interpreting dummy variables and their interaction effects in strategy research. Strategic Organization, 5(1), 13–30. doi:10.1177/1476127006073512
- Zhang, H. L., Liu, C. X., Zhao, M. Z., & Sun, Y. (2018). Economics, fundamentals, technology, finance, speculation and geopolitics of crude oil prices: An econometric analysis and forecast based on data from 1990 to 2017. Petroleum Science, 15(2), 432–242. doi:10.1007/s12182-018-0228-z
- Zhao, Y., Chang, H. L., Su, C. W., & Nian, R. (2015). Gold bubbles: When are they most likely to occur?. Japan and the World Economy, 34-35, 17–23. doi:10.1016/j.japwor.2015.03.001
- Zhou, Y., Han, L., & Yin, L. (2018). Is the relationship between gold and the U.S. dollar always negative? The role of macroeconomic uncertainty. Applied Economics, 50(4), 354–370. doi:10.1080/00036846.2017.1313956