
 ?Mathematical formulae have been encoded as MathML and are displayed in this HTML version using MathJax in order to improve their display. Uncheck the box to turn MathJax off. This feature requires Javascript. Click on a formula to zoom.
Abstract
We examine the effect of territorial servitisation on the spatial development of the manufacturing sector in Northeast China. Using data from 34 prefectural cities from 2003 to 2016, we find that the concentration of producer services promotes manufacturing agglomeration in the region. The novelty of our paper lies in the external instruments used to control for circular causation in the service–manufacturing nexus and spatial spill-overs of territorial servitisation during estimations. Our results are independent of a series of robustness tests and suggest that a synchronised development of the service and manufacturing sectors enables the region to fully internalise territorial servitisation.
1. Introduction
The Northeast region, encompassing Jilin, Heilongjiang, and Liaoning provinces, is frequently referred to as the rust belt of China. To meet the challenges posed by the accession to the World Trade Organization (WTO), the Chinese government first introduced the ‘Northeast Revitalization Program’ in 2003 (Dong, Citation2005), before enshrining the transformation and upgrading of the region’s manufacturing sector in the ‘13th Five-Year (2016–2020) Plan’ (Chi, Citation2016). Despite these attempts, manufacturing performance has remained sluggish to date (Wang, Citation2016). We investigate the causes of this sluggish performance. In particular, we examine how territorial servitisation, or the causal effect of producer services on manufacturing agglomeration, shaped the region during the post-WTO era.
Since the 1970s, two emerging trends have altered the spatial interactions between producer services and manufacturing. First, manufacturers traditionally performed the service functions in-house and only purchased a small proportion of non-essential services from the external market (Coffey & Bailly, Citation1992; Hansen, Citation1993). However, the rise of modern manufacturing practice demands an extensive division of labour that has encouraged the manufacturers to focus on realising internal economies of scale in production and externalise the service functions instead (Moyart, Citation2005). Moreover, modern manufacturing advocates a value proposition that combines product and services in an integrated package (Barnett, Parry, Saad, Newnes, & Goh, Citation2013; Crozet & Milet, Citation2017; Vandermerwe & Rada, Citation1988). As a result, the servitisation of manufacturing has elevated producer services from the backwater of the operation to the forefront that enhances the manufacturers’ competitiveness (Cusumano, Kahl, & Suarez, Citation2015; Guerrieri & Meliciani, Citation2005), market share (Hoekman & Shepherd, Citation2017; Rabetino, Kohtamäki, Lehtonen, & Kostama, Citation2015), and long-term performance (Kastalli & Van Looy, Citation2013; Visnjic, Wiengarten, & Neely, Citation2016). Consequently, this trend has increased the specialisation and productivity of service providers (Goe, Citation1990).
Second, an intricate service–manufacturing nexus not only benefits the participating firms but also generates external economies of scale within the region where these two sectors interact. For example, the separation of services and manufacturing has been shown to improve the productivity (Vendrell-Herrero & Wilson, Citation2017), employment (Rocha & Sternberg, Citation2005), and dynamics (Bellandi & Santini, Citation2019) of the region. In part, these regional advantages can be attributed to the agglomeration economies brought about by frequent exchanges between the service providers and their customers (Alonso-Villar & Chamorro-Rivas, Citation2001; Lanaspa, Sanz-Gracia, & Vera-Cabello, Citation2016), and partly to information knowledge diffusion inside the service sector (Ciriaci & Palma, Citation2016). Taken together, territorial servitisation reinforces regional competitiveness (Gomes, Bustinza, Tarba, Khan, & Ahammad, Citation2019) and attracts new and existing firms to the region (Lafuente, Vaillant, & Vendrell-Herrero, Citation2017).
Given that territorial servitisation determines manufacturing performance in the region, it may hold the key to explaining the sluggish manufacturing sector in Northeast China. Indeed, this view is shared by numerous studies on the service–manufacturing nexus in China. For example, Zhang and Li (Citation2011) attribute the underdevelopment of advanced manufacturing in western provinces to the lack of advanced services. Focussing on foreign investors, Jiao and Jiang (Citation2014) show that territorial servitisation only occurs in five eastern provinces. This regional imbalance is further identified by Wang and Liu (Citation2017), who suggest that strengthening the service sector lays the foundation for manufacturing upgrading in central and western provinces. Meanwhile, Li (Citation2017) finds high degrees of territorial servitisation in coastal region and between traditional services and traditional manufacturing.
Although the above studies shed light on territorial servitisation, they have been criticised for using provinces as the main unit of analysis. According to Rosenthal and Strange (Citation2001, Citation2003), studies based on large geographic units, such as provinces, are prone to aggregation bias. Against this backdrop, Chen and Chen (Citation2011) examine 69 cities in Zhejiang. In general, they find the cost linkages and demand linkages to be the main drivers for territorial servitisation. Similarly, Yuan, Gao, Wang, and Cai (Citation2017) focus on nine districts in Nanjing and demonstrate that territorial servitisation generates agglomeration economies for manufacturers and reduces customer acquisition costs for service providers. While these case studies remain insightful, their results cannot be generalised across China due to the gradualist path taken by the government in economic liberalisation. Against this backdrop, Ke, He, and Yuan (Citation2014) investigate the extent of territorial servitisation in 286 cities. Overall, they not only uncover strong territorial servitisation but also the co-location of service providers and manufacturers. In a recent study, Yang, Yeh, and Wang (Citation2018) match the firm- and city-level data in the Second National Economic Census and conclude that territorial servitisation not only raises the productivity of firms in the cluster but also benefit the cities within the 1000 km radius from the cluster.
However, not all studies support territorial servitisation in China. For example, while Jiang, Liu, and Yu (Citation2007) find heterogeneous service–manufacturing nexuses at the industry level, their results do not support the co-location of these two sectors at the provincial level. Meanwhile, Chen, Chen, and Huang (Citation2009) conclude that it is manufacturing agglomeration that is causing territorial servitisation rather than the other way around in eastern cities. At an individual city level, Han and Qin (Citation2009) attribute weak territorial servitisation across the nine districts in Shanghai to contextual factors, including path dependency, state intervention, and market institution. After examining 21 cities in Guangdong, Yeh, Yang, and Xu (Citation2017) show that the lack of demand for specialised services by low-end manufacturing in rural areas reduces the extent of territorial servitisation in the province.
Our preceding discussion clearly indicates that territorial servitisation in China remains an open empirical question. However, the consensus remains that producer services are indispensable to improving manufacturing performance. Indeed, with the introduction of the ‘Made in China 2025 Plan’, the pace of manufacturing servitisation is expected to further accelerate (Xinhua News Agency, Citation2015). On this account, we hypothesise that weak territorial servitisation is responsible for the sluggish manufacturing performance in Northeast China during the post-WTO. To the best of our knowledge, there is no study solely dedicated to examining this hypothesis. However, given that the Chinese government has identified the region as a future manufacturing hub, an understanding of the spatial interactions between producer services and manufacturing provides vital information when formulating regional policy.
An examination of territorial servitisation in the Northeast region confronts three main challenges. First, the agglomeration literature (e.g., Fujita & Thisse, Citation2002) suggests that the enlargement of the manufacturing sector not only promotes the growth of the service sector, but this growth also stimulates manufacturing activity in the region. In other words, when examining the dynamics of territorial servitisation, we must control for circular causation in the service–manufacturing nexus. Second, since the new economic geography literature (e.g., Fujita, Krugman, & Venables, Citation1999) shows that the influence of territorial servitisation can extend beyond its home region, we must account for such spatial spill-overs during the analysis. Third, and in relation to the preceding point, the spatial spill-over literature (e.g., Baldwin, Forslid, Martin, Ottaviano, & Robert-Nicoud, Citation2003) demonstrates that spatial spill-overs are best studied at the level of a small geographic unit. Against these backdrops, we seek to quantify the extent of territorial servitisation using 34 prefectural cities in Northeast China for the 2003–2016 period. Specifically, we recruit novel instrumental variables (IVs) to control for endogeneity and include spatial lags to account for spatial spill-overs.
In this line of inquiry, Ke et al. (Citation2014) and Li (2017) represent the closest examples to our study. Conceptually, our study differs from both studies in that we cover a relatively homogeneous region in terms of geographical typology and structural reform (Dong, Citation2005). By concentrating on the Northeast region, our results provide insight into future policy coordination by local officials in Jilin, Heilongjiang and Liaoning provinces. Methodologically, we complement both studies by identifying the extent of territorial servitisation through the application of external IVs, which are shown to outperform the internal IVs in a small sample size (Angrist & Pischke, Citation2008; Davidson & Mackinnon, Citation2004). Moreover, we uncover heterogeneity in territorial servitisation based on different producer service classifications rather than aggregating all services into a single sector.
In general, we uncover a positive and significant territorial servitisation that runs from producer services to manufacturing in the Northeast region. Furthermore, we show that financial services exert the largest impact on manufacturing agglomeration, followed by information services. Finally, we find no compelling evidence for spatial spill-overs in territorial servitisation. Our results remain independent of a series of robustness tests. Based on these results, we attribute sluggish manufacturing performance in the region to weak territorial servitisation. For policy makers, our central message is that synchronised improvements in the producer service sector is a necessary condition for achieving manufacturing prowess of the region; an area largely overlooked in previous regional development plans.
In the following parts, we briefly provide the context of territorial servitisation in Northeast China, followed by a discussion of the econometric framework. In the empirical analysis section, we initially apply the IV estimator to identify the extent of territorial servitisation, before decomposing this effect with respect to different producer service categories. We then perform a series of robustness tests to establish the validity of our results. Finally, we conclude by discussing the policy implications of our study.
2. Data and study area
Since the Chinese government does not formally define producer services, we follow the operational definition widely adopted by the empirical studies pertinent to China and decompose the sector in the Northeast region into the following six industries: (1) logistics; (2) information; (3) financial; (4) real estate; (5) business; and (6) research services (e.g., Yang & Yeh, Citation2013; Yeh, Yang, & Wang, Citation2015; Yi, Yang, & Yeh, Citation2011).1 To be clear, we do not disaggregate the manufacturing sector in this study on two grounds. First, unlike its economically diverse eastern counterpart, this sector in the Northeast region remains relatively homogeneous, with state-owned enterprises (SOEs) dominating the heavy and capital-intensive industries (Chu & Zong, Citation2018; Dong, Citation2005). And second, by anchoring our analysis around the manufacturing sector, we maintain trackability of the results required to evaluate the economic significance of each service industry to manufacturing agglomeration.
We select the Northeast region (), encompassing Jilin, Heilongjiang, and Liaoning provinces, as the empirical case in this study. Traditionally, this region enjoyed higher economic development than the western region and was once called the ‘industrial cradle of new China’, which specialised in the production of energy, weaponry, heavy machinery, iron and steel, and aeroplane, ship, and vehicle (Chu & Zong, Citation2018; Dong, Citation2005). With such strong industrial tradition, the government was hoping to transform the region that rivalled the Yangtse River Delta, Peral River Delta, and pan-Bohai Area. Despite repeated revitalisation initiatives since the 1990s, the regional economy has shown little sign of progress, and at times, protracted, leading to some dubbed the region’s inability to improve efficiency and embrace structural reforms as the ‘Northeast Syndrome’ (Dong, Citation2005).
Figure 1. The Northeast region, China.
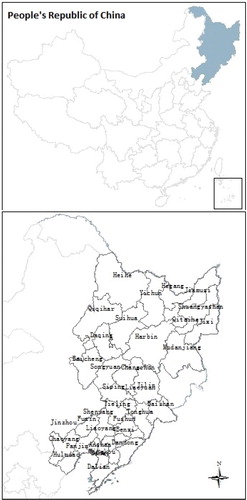
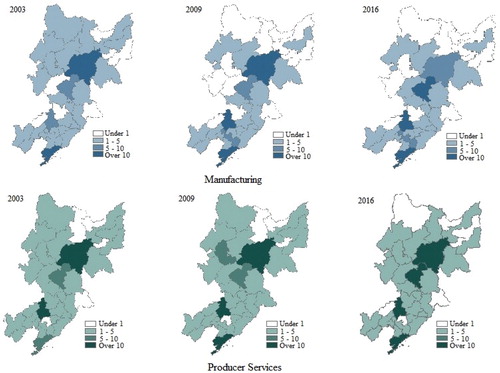
The raging debate on the causes and remedies of this Syndrome has continued to date. Given the close spatial connections between producer services and manufacturing in the production network, we hypothesise that weak territorial servitisation has restricted the growth of the manufacturing sector in the region. To test this hypothesis, we investigate the extent of territorial servitisation across 34 prefectural cities in the region spanning over the period 2003 to 2016.2 For consistency, we compile the data from various issues of the China City Statistical Yearbook, Jilin Statistical Yearbook, Heilongjiang Statistical Yearbook, and Liaoning Statistical Yearbook. To measure territorial servitisation, we first consider the employment share of services and manufacturing in each city.3 clearly shows that the manufacturing employment (top row) gradually declined, whereas the service employment (bottom row) surged during the sample period. These trends provide preliminary evidence for an increasing presence of produce services in the region.
Figure 2. Manufacturing and producer service employment, by city in selected years.
A main criticism for is that the sectoral employment share ignores huge internal migration waves emanating from the Northeast region to the rest of China, particularly among those manufacturing workers searching for better pay and conditions in the eastern region. Therefore, to better capture territorial servitisation, we calculate the employment location quotient (LQ) given below:
(1)
(1)
where esi indicates the number of employees in sector s residing in city i, ei denotes the total number of employees in city i, Es represents the total number of employees in sector s in China, and E refers to the total number of employees in Northeast China.
Since LQ is based on the sectoral employment in the city as a fraction of the sectoral employment in China, an LQ of 1 implies that the city and China are equally specialised in the sector, whereas an LQ larger (smaller) than 1 indicates that the city has a higher (lower) concentration in the sector than the national average. Accordingly, shows that producer services, with the highest LQ of 1.54 in 2003, 1.68 in 2009, and 2.3 in 2016, are concentrated in provincial capitals and major cities than are manufacturing in the urban system. Meanwhile, the manufacturing LQ is generally higher for those cities nearby provincial capitals and major cities. These trends are consistent with the predictions of the core-periphery models (Alonso-Villar & Chamorro-Rivas, Citation2001; Lanaspa et al., Citation2016). Empirically, technological improvement has been identified as the catalyst that allows many Chinese service providers to serve their customers from headquarters in central business districts (Yang & Yeh, Citation2013; Yang et al., Citation2018; Yuan et al., Citation2017).
Table 1. Employment location quotient of producer services and manufacturing, by city in Northeast China in selected years.
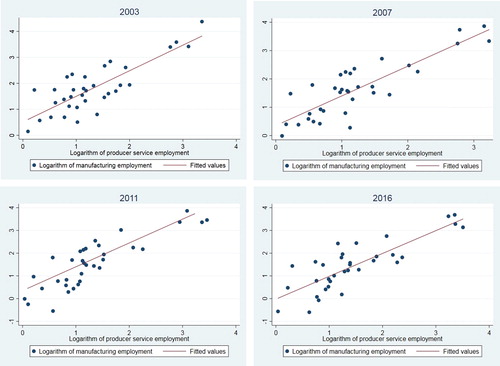
Indeed, illustrates a positive correlation between producer services and manufacturing agglomeration in the Northeast region. Whilst we might be tempted to conclude this correlation as the evidence for territorial servitisation, we must remember that correlation need not imply causation. To be clear, territorial servitisation refers to a situation in which the concentration of producer services triggers manufacturing agglomeration in the city. In other words, we must control for circular causation when assessing the effect of territorial servitization on the service-manufacturing nexus.
Figure 3. Manufacturing employment against producer service employment, by selected years.
3. Econometric framework
3.1. The model
To examine the effect of territorial servitisation on the service-manufacturing nexus in the Northeast region, we estimate the following model:
(2)
(2)
where Manufacturing denotes the LQ for the manufacturing sector, Services represents the LQ for the service sector, X is the conditioning information set (CIS), ε is the stochastic error term, and subscript i refers to city i in the region. Our main variable of interest is β1. Specifically, a positive and statistically significant coefficient indicates the presence of territorial servitization in the city.
To isolate the effect of producer services on manufacturing, we include the following variables in the CIS based on the empirical literature of manufacturing agglomeration in China. First, we select the wage rate as a control in EquationEquation (2)(2)
(2) , on the basis that low labour cost can attract the manufacturers to a city (Chen et al., Citation2009; Debaere, Lee, & Paik, Citation2010; Ke et al., Citation2014). However, as Wei, Liu, Parker, and Vaidya (Citation1999) and Gao (2005) point out, the use of the average real wage rate ignores labour productivity. To avoid this pitfall, we adjust the real wage rate (Wage) for productivity (Chen, Gao, Ge, & Li, Citation2015; Cheng, Citation2008; He, Citation2002). Second, since the manufacturers can agglomerate to exploit the mass market in the city, we control for this effect by including GDP per capita (Market) in EquationEquation (2)
(2)
(2) (Cheng & Stough, Citation2006; Ke & Feser, Citation2010; Sun, Tong, & Yu, Citation2002). Finally, given the unique geographic location of the Northeast region, the manufacturers may agglomerate in cities with sound transportation infrastructure to reduce trade cost (Glaeser & Kohlhase, Citation2003; Hong, Citation2007). To account for the region’s huge landmass and its low population density, we adopt the per capita area of paved road (Transport) as the proxy for trade cost (Chen & Chen, Citation2011). reports the summary statistics and the correlation coefficient matrix for the selected variables. Since none of the pairwise correlation coefficient reports a value exceeding 0.60 in the table (Gujarati & Porter, Citation2008), we tentatively conclude that multicollinearity does not pose a serious concern during the estimations of EquationEquation (2)
(2)
(2) .4
Table 2. Descriptive statistics and correlation coefficients, by variable.
3.2. Instruments and identification strategy
A main concern when estimation EquationEquation (2)(2)
(2) is to rule out reverse causality in territorial servitisation that runs from manufacturing agglomeration to the concentration of producer services. To control for this circular causation, we employ the IV estimator, which involves identifying IVs that are highly correlated to the concentration of producer services but exert little influences on manufacturing agglomeration. The Monte Carol experiments have shown that this estimator is consistent under a valid and relevant IV set (Greene, Citation2000; Wooldridge, Citation2010).
After reviewing the extant literature on producer services, we select two variables to instrument territorial servitisation. Our first IV is based on the notion that the service sector usually employs specialised professionals who value the availability of local amenities, such as education and health services, to their family members (Chen et al., Citation2009; Fujita & Thisse, Citation2002; Ke & Feser, Citation2010; Ke et al., Citation2014). Constrained by data availability at the city level, we employ the number of medical doctors and teachers in higher education (Human) as an IV for the concentration of producer services. We recruit the second IV based on the principle that recent improvements in information technology have enabled the decentralisation of modern producer services (Alonso-Villar & Chamorro-Rivas, Citation2001; Chen et al., Citation2009; Chen & Chen, Citation2011; Lanaspa et al., Citation2016). We overcome the data constraint by focussing on the telecommunication services expenditure per capita (Communication) as the IV for the concentration of producer services. During the estimations, we first include each IV individually, before combining them in a single IV set.
4. Results
4.1. Benchmark OLS results
Since EquationEquation (2)(2)
(2) are in a log-linear form, we can interpret the estimated coefficients as elasticities. During estimations, we start with the simplest bivariate model, before following up with a stepwise strategy in which one additional control variable is introduced to the CIS at a time. Intuitively, this strategy is designed to evaluate the economic significance of each variable in the CIS. According to , the coefficient on Services remains positive and significant across models (1)–(4). As expected, the magnitude of this coefficient gradually falls because an enlarged CIS accounts for various interactions and avoids omitted variable bias in EquationEquation (2)
(2)
(2) . Based on the adjusted-R2 statistics, we select model (4) as our preferred specification. Specifically, it shows that a 1% increase in territorial servitization raises manufacturing agglomeration by 0.74%, indicating a strong positive service–manufacturing nexus.
Table 3. The benchmark results, by OLS estimator.
4.2. Benchmark IV results
Although we have established a positive service–manufacturing nexus in Section 4.1, we cannot interpret the OLS results as the evidence for territorial servitisation. Instead, we must rule out endogeneity in EquationEquation (2)(2)
(2) . Models (1)–(6) in presents the two-stage generalised method-of-moments (GMM) weighted matrix robust IV results. For ease of comparison, we maintain the stepwise strategy by alternating the exclusion and inclusion of the CIS. Specifically, models (1)–(3) exclude the CIS and report the results for different IV combinations. In general, independent of the IVs, we find that the coefficients on Services remain positive and significant. Meanwhile, the inclusion of the CIS in models (4)–(6) under various IV settings does not fundamentally alter this positive effect. We note that the IV estimates consistently exceed their OLS counterparts, suggesting possible downward attenuation bias of the latter in the presence of endogeneity. Accordingly, we must instrument Services, which is the endogenous variable in EquationEquation (2)
(2)
(2) to avoid biased estimates (Davidson & Mackinnon, Citation2004; Greene, Citation2000; Wooldridge, Citation2010).
Table 4. The benchmark results, by IV estimator and sectoral employment.
To be more precise, the first-stage results in Panel B of shows a strong relationship between Services and our chosen IVs. Moreover, the lowest portion of presents a battery of diagnostic tests for the validity of our IVs. For example, both the Wooldridge score test and the Wooldridge regression-based test reveal that Services is, indeed, endogenous in EquationEquation (2)(2)
(2) . In terms of the relevance of IVs, the robust F-test rejects the null hypothesis of weak instruments. According to the Wooldridge overidentification test for models (3) and (6), we conclude that the IVs are exogenous and free from overidentification. Overall, these tests strongly indicate that the model is correctly identified, and our choice of the IV estimator is appropriate.
For the remainder of this study, we select model (6) as the preferred specification as it includes the CIS and utilises both Human and Communication to instrument Services. Specifically, a 1% rise in Services causes a 1.04% increase in manufacturing agglomeration in a representative city. This result provides unequivocal support for the presence of territorial servitisation in the Northeast region.
4.3. Robustness tests
4.3.1. Heterogeneous territorial servitisation
Different producer services are expected to affect manufacturing agglomeration differently (Yang & Yeh, Citation2013; Yi et al., Citation2011; Yuan et al., Citation2017; Zhao, Liu, Derudder, Zhong, & Shen, Citation2015). To examine this conjecture, we further decompose producer services into six distinct classifications represented by models (1)–(6) of . In a sequential order, each model corresponds to logistic, information, financial, real estate, business, and research services. A visual inspection reveals that, with the exception of business services (model (5)), all service classifications display the correct sign and are significant at the 1% level. In part, this result is consistent with the dominance of SOEs in the region, which have the capacity to perform high-order service functions in-house rather than relying on external providers (Coffey, Citation2000; Dong, Citation2005). Meanwhile, financial services in model (3) reports the highest degree of territorial servitisation, with a 1% increase in the territorial servitisation of financial services causing a 2.09% increase in manufacturing agglomeration. According to Li (Citation2017) and Chu and Zong (Citation2018), this result may reflect the distortions from a state-led financial system. Finally, the positive and significant impact of logistic (model (1)) and information (model (2)) services are consistent with the recent trend in the servitisation of manufacturing and the pursue for ‘Made in China 2025 Plan’ by the government (Chi, Citation2016).
Table 5. Territorial servitisation measured in sectoral employment, by producer services.
As expected, Panel B of reports Human is important for the professionals in information and research services. Meanwhile, a battery of diagnostic test in Panel (C) suggests that our model is correctly identified for all service classifications. Overall, we conclude that territorial servitisation exists in the Northeast region, with the effect most prominent in financial services.
4.3.2. Replacing sectoral employment with sectoral output
In the preceding analyses, we find compelling evidence for territorial servitisation in the Northeast region. However, one may speculate that this finding was driven by our choice of sectoral employment as the proxy for territorial servitisation. To alleviate this concern, we replace the proxy in question by sectoral output. Models (1)–(6) in report the results for EquationEquation (2)(2)
(2) with different IV combinations. As expected, all coefficients on Services remain positive and significant at all conventional levels. Moreover, when the CIS is included in models (4)–(6), the estimated coefficients on Services are much smaller than those without in models (1)–(3), on the basis that the joint influence of the CIS shares the effect of servitisation. Importantly, the magnitude of the IV estimates (2.08–4.17) is larger than the comparable estimates (1.01–1.58) in , indicating a strong causal relation between territorial servitisation and manufacturing agglomeration in terms of sectoral output. We suggest that this result offers another line of support for the increasing servitisation of manufacturing in the region. For consistency, we select model (6) as the preferred specification and conclude that a 1% increase in Services causes a 2.12% increase in manufacturing agglomeration in a representative city.
Table 6. Territorial servitisation, by sectoral output.
We also test the causal effect of territorial servitisation for each of the six service classifications using sectoral output. presents the IV results with the inclusion of the CIS and a complete IV set. According to panel A, with the exception of business services in model (5), our key findings of a positive and significant coefficient on Services remains. Since all models pass a battery of diagnostic tests, we conclude that effect of territorial servitisation is the strongest in financial services (4.24), followed by information (1.95) and real estate (1.46) services.
Table 7. Territorial servitisation measured in sectoral output, by producer services.
4.3.3. Are there spatial spill-overs in territorial servitisation?
Recent technological development, particularly in information technology, has completely changed the landscape for producer services (Bellandi & Santini, Citation2019; Gomes et al., Citation2019; Sforzi & Boix, Citation2019). However, this change also requires the analysis in territorial servitisation to incorporate spatial spill-over effects in the service–manufacturing nexus. To evaluate these effects within each sector or between these sectors, we introduce two spatial lag variables to EquationEquation (2)(2)
(2) . Specifically, for city i, we estimate the following equation:
(3)
(3)
where w denotes the spatial weight matrix. Following Ke et al. (Citation2014), we construct the spatial lag variables as follows:
(4)
(4)
(5)
(5)
where dij refers to the distance between city i and city j. λ is the distance decay parameter, which is set to 2.5 Moreover, we calculate the distance between any pair of cities by
(6)
(6)
According to the earth’s equatorial radius, we set R = 6,378 km, ai and aj denote the latitudes, and bi and bj the longitudes, of the centre of city i and city j.
presents the estimates of EquationEquation (3)(3)
(3) . Using model (5) as the preferred specification, a 1% improvement in Services causes manufacturing agglomeration to increase by 0.78%. With the exception of model (2), the coefficients of w(Manufacturing) are positive and significant at 10% level or better. Consistent with the agglomeration literature on China, our results uncover intra-industry spatial interactions among neighbouring cities (Fan, Citation2006; Ke & Feser, Citation2010; Ke et al., Citation2014). Specifically, model (5) shows that around 0.59% of the growth in w(Manufacturing) in a city can be attributed to spatial spill-overs from manufacturing growth in its neighbours. However, our results indicate that there is no sign of spatial spill-overs in w(Services). To reconcile our result with Yang et al. (Citation2018), who find spatial spill-overs in territorial servitisation up to 1000 km, we speculate that our result might reflect relatively homogenous producer services offered in the Northeast region.
Table 8. Territorial servitisation, by spatial spill-overs in manufacturing and producer services.
4.3.4. Panel data analysis
In our preceding analysis, the evidence from the annual average of variables confirms that territorial servitisation causes on manufacturing agglomeration. However, given that panel data contains time series observations of a number of individuals, which improves the capacity to model the complexity of human behaviour and provides more accurate inferences than either cross-sectional or time series data (Baltagi, Citation2013; Hsiao, Citation2007), we also perform panel data analysis. Intuitively, if our finding of the positive causal influence from services to manufacturing is robust, we should reach the same conclusion based on the panel estimates.
lists the results of panel data analysis. We apply the pooled cluster-robust OLS (model (1)), pooled fixed-effects (FE) (model (2)), pooled random-effects (RE) (model (3)), fixed-effects IV regression (FEIV) (model (4)) to EquationEquation (2)(2)
(2) , and fixed-effects IV regression with spatial effects (FEIVSP) (model (5)) to EquationEquation (3)
(3)
(3) . We conduct the Hausman test to choose the appropriate one between FE and RE estimators. We introduce an internal IV set that is comprised of a two-year lagged endogenous regressor in EquationEquation (2)
(2)
(2) . To warrant the use of the internal IV set, we conduct the Sagan-Hansen test under the assumption that the internal IVs are truly exogenous. Finally, taking the spatial spill-overs into account in EquationEquation (3)
(3)
(3) , we evaluate the spatial interaction between one city and its neighbouring cities by performing FEIVSP.
Table 9. Territorial servitisation, by panel data estimators.
shows that although the pooled OLS possesses the highest R2 (overall) statistics among the pooled estimators, it does not control for the time-invariant city-specific effects, which may cause downward attenuation bias during estimations. Based on the Hausman test for EquationEquation (2)(2)
(2) , the pooled FE estimator shows greater reliability than its pooled RE counterpart.6 However, when we introduce the time invariant city-specific effects in the pooled FE estimator, the statistically significant coefficient of Services becomes negative. With a relatively poor goodness-of-fit (the R2 (within) statistics is only 0.03), this negative result should be interpreted with caution. Specifically, this unexpected result may be attributed to unobserved omitted variable bias. Against this backdrop, we re-estimate EquationEquation (2)
(2)
(2) using the FEIV estimator and report the results in model (4). According to Panel B, the FEIV estimator reports a slightly higher goodness-of-fit than the pooled FE estimator. However, the coefficient on Services is insignificant, which may be caused by spatial spill-overs within the same sector or between the service and manufacturing sectors. Model (5) displays the result of the FEIV estimator for EquationEquation (3)
(3)
(3) that includes spatially lagged variables. The coefficient on Services remains positive and significant at all conventional levels. The coefficient on w(Services) is insignificant, but the coefficient on w(Manufacturing) exhibits a correct and significant sign. In short, our analysis reveals that using the IV estimator and including the spatially lagged variables help to avoid spurious results. Based on this observation, we select model (5) as the preferred specification and conclude that a 1% improvement in Services causes manufacturing agglomeration to rise by 0.01%.
5. Conclusion
We examine the causal influence running from territorial servitisation to manufacturing agglomeration in 34 prefectural cities in Northeast China for the 2003–2016 period. In general, we find that territorial servitisation exerts a positive and significant effect on manufacturing agglomeration Moreover, we find that spatial spill-overs are absent from producer services. In part, this result might reflect the lack of a comprehensive specialised producer service networks in the region. Finally, our results are robust to different agglomeration measures and estimating approaches.
For policy makers, our results suggest that the sluggish manufacturing performance in the Northeast region since 2000 can be attributed to a weak producer service sector. Against this backdrop, one policy priority should be developing a robust and diverse service sector in the region. Second, the policy makers should relax the rules and regulations restricting the ability of the producer-service sector to serve clients across the region, particularly in areas such as financial, logistics, and information services. These changes will allow the manufacturers to access a wider range of products and reinforce intra- and inter-industry spatial linkages in the region. Finally, given the region’s unique geographical location, the policy makers in all three provinces should coordinated their industrial policy to maximise the benefits from territorial servitisation. Without such a coordinated approach, inter-province competition can result in location tournament, with the growth in one city or province only coming at the expense of the remaining cities or provinces.
While we are confident with our results, we urge more research on the spatial interactions between manufacturing and producer services in China. For example, we stand to gain valuable insights into the service–manufacturing nexus using county-level data. Alternatively, this research should be carried out for Western China, which share many similar geographical traits as their Northeast counterpart. Unlike the Eastern region where the bulk of its producer services revolves around logistic supports, these landlocked regions may find producer services in areas such as financial and information services more valuable. Last, but not the least, future research should consider non-linearities to account for circular causation in this important nexus.
Acknowledgements
We thank the Editor, Professor Skare, and three anonymous referees for constructive comments. All remaining errors are our own. This work was completed when Liu Duo was a visiting scholar at UNE Business School, funded by the China Scholarship Council.
Disclosure statement
No potential conflict of interest was reported by the authors.
Notes
1 To facilitate the discussion, we have relabeled the six industries in our study. Formally, the full name of each classification corresponding to our list are as follows: (1) transportation, storage, and post; (2) information transmission, computer services, and software; (2) financial intermediation; (4) real estate; (5) business services; and (6) scientific research and technical services.
2 We deliberately avoid the period prior to the year 2003 because the National Industrial Classification of China underwent significant revisions that year.
3 We also replace sectoral employment with sectoral output in the robustness tests section.
4 We also conduct the variance inflation factor (VIF) test to check for multicollinearity. We obtain a VIF value of 2.3, which suggests that the nominated variables are, at best, moderately correlated, and should be a major concern during estimations.
5 We follow the common practice in the empirical literature by setting λ = 2. We have also experimented with λ = 1, which does not change the fundamental results reported here. These results are available upon the request from the authors.
6 The Hausman test statistics is =28.21 with Prob >
= 0.000.
References
- Alonso-Villar, O., & Chamorro-Rivas, J.-M. (2001). How do producer services affect the location of manufacturing firms? The role of information accessibility. Environment and Planning A: Economy and Space, 33(9), 1621–1642. doi:10.1068/a3436
- Angrist, J. D., & Pischke, J.-S. (2008). Mostly harmless econometrics: An empiricist’s companion. Princeton, NJ: Princeton University Press.
- Baldwin, R. E., Forslid, R., Martin, P. H., Ottaviano, G., & Robert-Nicoud, F. (2003). Economic geography and public policy. Princeton, NJ: Princeton University Press.
- Baltagi, B. H. (2013). Econometric analysis of panel data (5th ed.). West Sussex: John Wiley & Sons.
- Barnett, N. J., Parry, G., Saad, M., Newnes, L. B., & Goh, Y. M. (2013). Servitization: Is a paradigm shift in the business model and service enterprise required? Strategic Change, 22(3-4), 145–156. doi:10.1002/jsc.1929
- Bellandi, M., & Santini, E. (2019). Territorial servitization and new local productive configurations: The case of the textile industrial district of Prato. Regional Studies, 53(3), 356–365. doi:10.1080/00343404.2018.1474193
- Chen, J., Chen, G., & Huang, J. (2009). An empirical study on the determinants of producer service agglomeration: Evidence from 222 Chinese cities. Management World, 4, 83–95. (in Chinese).
- Chen, J.-J., & Chen, J.-J. (2011). The research on the co-location between producer services and manufacturing: The empirical analyses based on the 69 cities and regions in Zhejiang Province. China Industrial Economics, 6, 141–150. (in Chinese).
- Chen, Y. (2009). Agglomeration and location of foreign direct investment: The case of China. China Economic Review, 20(3), 549–557. doi:10.1016/j.chieco.2009.03.005
- Chen, Y., Gao, Y., Ge, Y., & Li, J. (2015). Regional financial development and foreign direct investment. Urban Studies, 52(2), 358–373. doi:10.1177/0042098014528546
- Cheng, S. (2008). How can western China attract FDI? A case of Japanese investment. The Annals of Regional Science, 42(2), 357–374. doi:10.1007/s00168-007-0151-5
- Cheng, S., & Stough, R. (2006). Location decisions of Japanese new manufacturing plants in China: A discrete-choice analysis. The Annals of Regional Science, 40(2), 369–387. doi:10.1007/s00168-005-0052-4
- Chi, F. (2016). SOE reform key to northeast region’s revival. China Daily. Retrieved from http://english.gov.cn/news/top_news/2016/09/12/content_281475440110471.htm
- Chu, M., & Zong, J.-F. (2018). Government intervention, financial deepening and structural transformation: An examination based on the investigation of “New Northeast Phenomenon”. China Soft Science, 1, 63–76. (in Chinese).
- Ciriaci, D., & Palma, D. (2016). Structural change and blurred sectoral boundaries: Assessing the extent to which knowledge-intensive business services satisfy manufacturing final demand in Western countries. Economic Systems Research, 28(1), 55–77. doi:10.1080/09535314.2015.1101370
- Coffey, W. J. (2000). The geographies of producer services. Urban Geography, 21(2), 170–183. doi:10.2747/0272-3638.21.2.170
- Coffey, W. J., & Bailly, A. S. (1992). Producer services and systems of flexible production. Urban Studies, 29(6), 857–868. doi:10.1080/00420989220080841
- Crozet, M., & Milet, E. (2017). Should everybody be in services? The effect of servitization on manufacturing firm performance. Journal of Economics & Management Strategy, 26, 820–841. doi:10.1111/jems.12211
- Cusumano, M. A., Kahl, S. J., & Suarez, F. F. (2015). Services, industry evolution, and the competitive strategies of product firms. Strategic Management Journal, 36(4), 559–575. doi:10.1002/smj.2235
- Davidson, R., & Mackinnon, J. G. (2004). Econometric theory and methods. New York, NY: Oxford University Press.
- Debaere, P., Lee, J., & Paik, M. (2010). Agglomeration, backward and forward linkages: Evidence from South Korean investment in China. Canadian Journal of Economics/Revue Canadienne D’économique, 43(2), 520–546. doi:10.1111/j.1540-5982.2010.01582.x
- Dong, L. (2005). China’s drive to revitalise the Northeast. China Perspectives, 58, 1–16.
- Fan, J. (2006). Industrial agglomeration and difference of regional labor productivity: Chinese evidence with international comparison. Economic Research Journal, 11, 72–81. (in Chinese).
- Fujita, M., Krugman, P., & Venables, A. J. (1999). The spatial economy: Cities, regions, and international trade. Cambridge, MA: MIT Press.
- Fujita, M., & Thisse, J.-F. (2002). Economics of agglomeration. Cambridge, MA: Cambridge University Press.
- Gao, T. (2005). Labor quality and the location of foreign direct investment: Evidence from China. China Economic Review, 16(3), 274–292. doi:10.1016/j.chieco.2005.02.005
- Glaeser, E. L., & Kohlhase, J. E. (2003). Cities, regions and the decline of transport costs. Papers in Regional Science, 83(1), 197–228. doi:10.1007/s10110-003-0183-x
- Goe, W. R. (1990). Producer services, trade and the social division of labour. Regional Studies, 24(4), 327–342. doi:10.1080/00343409012331346024
- Gomes, E., Bustinza, O. F., Tarba, S., Khan, Z., & Ahammad, M. (2019). Antecedents and implications of territorial servitization. Regional Studies, 53(3), 410–423.
- Greene, W. H. (2000). Econometric analysis (4th ed.). Upper Saddle River, NJ: Prentice Hall.
- Guerrieri, P., & Meliciani, V. (2005). Technology and international competitiveness: The interdependence between manufacturing and producer services. Structural Change and Economic Dynamics, 16(4), 489–502. doi:10.1016/j.strueco.2005.02.002
- Gujarati, D. N., & Porter, D. C. (2008). Basic econometrics. New York, NY: McGraw-Hill.
- Han, S. S., & Qin, B. (2009). The spatial distribution of producer services in Shanghai. Urban Studies, 46, 877–896.
- Hansen, N. (1993). The strategic role of producer services in regional development. International Regional Science Review, 16(1-2), 187–195. doi:10.1177/016001769401600109
- He, C. (2002). Information costs, agglomeration economies and the location of foreign direct investment in China. Regional Studies, 36(9), 1029– 1036. doi:10.1080/0034340022000022530
- Hoekman, B., & Shepherd, B. (2017). Services productivity, trade policy and manufacturing exports. The World Economy, 40(3), 499–516. doi:10.1111/twec.12333
- Hong, J. (2007). Transport and the location of foreign logistics firms: The Chinese experience. Transportation Research Part A: Policy and Practice, 41, 597–609. doi:10.1016/j.tra.2006.11.004
- Hsiao, C. (2007). Panel data analysis—Advantages and challenges. TEST, 16(1), 1–22. doi:10.1007/s11749-007-0046-x
- Jiang, J., Liu, Z., & Yu, M. (2007). Development of producer services and improvement in manufacturing productivity: An empirical analysis based on regional and sectoral panel datasets. Journal of World Economy, 8, 52–62. (in Chinese).
- Jiao, P., & Jiang, M. (2014). A spatial statistic and spatial econometric analysis for co-agglomeration of FDI in producer services and FDI in manufacturing industry. Information Technology Journal, 13(17), 2682–2689. doi:10.3923/itj.2014.2682.2689
- Kastalli, I. V., & Van Looy, B. (2013). Servitization: Disentangling the impact of service business model innovation on manufacturing firm performance. Journal of Operations Management, 31(4), 169–180. doi:10.1016/j.jom.2013.02.001
- Ke, S., & Feser, E. (2010). Count on the growth pole strategy for regional economic growth? Spread–backwash effects in Greater Central China. Regional Studies, 44(9), 1131–1147. doi:10.1080/00343400903373601
- Ke, S., He, M., & Yuan, C. (2014). Synergy and co-agglomeration of producer services and manufacturing: A panel data analysis of Chinese cities. Regional Studies, 48(11), 1829–1841. doi:10.1080/00343404.2012.756580
- Lafuente, E., Vaillant, Y., & Vendrell-Herrero, F. (2017). Territorial servitization: Exploring the virtuous circle connecting knowledge-intensive services and new manufacturing businesses. International Journal of Production Economics, 192, 19–28. doi:10.1016/j.ijpe.2016.12.006
- Lanaspa, L., Sanz-Gracia, F., & Vera-Cabello, M. (2016). The (strong) interdependence between intermediate producer services’ attributes and manufacturing location. Economic Modelling, 57, 1–12. doi:10.1016/j.econmod.2016.04.010
- Li, B. (2017). The interaction of clusters between manufacturing and producer services in China. Economic Research-Ekonomska Istraživanja, 30, 1427–1442. doi:10.1080/1331677X.2017.1355253
- Moyart, L. (2005). The role of producer services in regional development: What opportunities for medium-sized cities in Belgium? The Service Industries Journal, 25(2), 213–228. doi:10.1080/0264206042000305420
- Rabetino, R., Kohtamäki, M., Lehtonen, H., & Kostama, H. (2015). Developing the concept of life-cycle service offering. Industrial Marketing Management, 49, 53–66. doi:10.1016/j.indmarman.2015.05.033
- Rocha, H. O., & Sternberg, R. (2005). Entrepreneurship: The role of clusters theoretical perspectives and empirical evidence from Germany. Small Business Economics, 24(3), 267–292. doi:10.1007/s11187-005-1993-9
- Rosenthal, S. S., & Strange, W. C. (2001). The determinants of agglomeration. Journal of Urban Economics, 50(2), 191–229. doi:10.1006/juec.2001.2230
- Rosenthal, S. S., & Strange, W. C. (2003). Geography, industrial organization, and agglomeration. Review of Economics and Statistics, 85(2), 377–393. doi:10.1162/003465303765299882
- Sforzi, F., & Boix, R. (2019). Territorial servitization in Marshallian industrial districts: The industrial district as a place-based form of servitization. Regional Studies, 53(3), 398–409. doi:10.1080/00343404.2018.1524134
- Sun, Q., Tong, W., & Yu, Q. (2002). Determinants of foreign direct investment across China. Journal of International Money and Finance, 21(1), 79–113. doi:10.1016/S0261-5606(01)00032-8
- Vandermerwe, S., & Rada, J. (1988). Servitization of business: Adding value by adding services. European Management Journal, 6(4), 314–324. doi:10.1016/0263-2373(88)90033-3
- Vendrell-Herrero, F., & Wilson, J. R. (2017). Servitization for territorial competitiveness: Taxonomy and research agenda. Competitiveness Review, 27(1), 2–11. doi:10.1108/CR-02-2016-0005
- Visnjic, I., Wiengarten, F., & Neely, A. (2016). Only the brave: Product innovation, service business model innovation, and their impact on performance. Journal of Product Innovation Management, 33(1), 36–52. doi:10.1111/jpim.12254
- Wang, Y. (2016). Northeast to bottom out amid lackluster growth. China Daily. Retrieved from http://english.gov.cn/news/top_news/2016/11/18/content_281475494153098.htm
- Wang, Z. Q., & Liu, B. F. (2017). The impact of productive service agglomeration on manufacturing agglomeration: A comparative analysis based on general manufacturing and high-tech industries. Inquiry into Economic Issues, 3, 56–62.
- Wei, Y., Liu, X., Parker, D., & Vaidya, K. (1999). The regional distribution of foreign direct investment in China. Regional Studies, 33(9), 857–867. doi:10.1080/00343409950075498
- Wooldridge, J. (2010). Econometric analysis of cross section and panel data. Cambridge, MA: MIT Press.
- Xinhua News Agency. (2015). China vows support for modernizing manufacturers. China Daily. Retrieved from http://www.chinadaily.com.cn/bizchina/2015-11/19/content_22484054.htm
- Yang, F. F., & Yeh, A. G. O. (2013). Spatial development of producer services in the Chinese urban system. Environment and Planning A: Economy and Space, 45(1), 159–179. doi:10.1068/a45106
- Yang, F. F., Yeh, A. G. O., & Wang, J. (2018). Regional effects of producer services on manufacturing productivity in China. Applied Geography, 97, 263–274. doi:10.1016/j.apgeog.2018.04.014
- Yeh, A. G. O., Yang, F. F., & Wang, J. (2015). Producer service linkages and city connectivity in the mega-city region of China: A case study of the Pearl River Delta. Urban Studies, 52(13), 2458–2482. doi:10.1177/0042098014544762
- Yeh, A. G. O., Yang, F. F., & Xu, Z. (2017). Will rural urbanization produce a new producer service space in China? Habitat International, 67, 105–117. doi:10.1016/j.habitatint.2017.07.004
- Yi, H., Yang, F. F., & Yeh, A. G. O. (2011). Intraurban location of producer services in Guangzhou, China. Environment and Planning A: Economy and Space, 43(1), 28–47. doi:10.1068/a42460
- Yuan, F., Gao, J., Wang, L., & Cai, Y. (2017). Co-location of manufacturing and producer services in Nanjing, China. Cities, 63, 81–91. doi:10.1016/j.cities.2016.12.021
- Zhang, Y.-F., & Li, M.-L. (2011). On the double agglomeration of advanced manufacturing industries and producer services industries. Journal of Guangdong University of Business Studies, 26, 9–16.
- Zhao, M., Liu, X., Derudder, B., Zhong, Y., & Shen, W. (2015). Mapping producer services networks in mainland Chinese cities. Urban Studies, 52(16), 3018–3034. doi:10.1177/0042098014558541