
 ?Mathematical formulae have been encoded as MathML and are displayed in this HTML version using MathJax in order to improve their display. Uncheck the box to turn MathJax off. This feature requires Javascript. Click on a formula to zoom.
Abstract
Within the present-day economic situation ensuring a competitive position coincides with its ability of managing its relationship with the stakeholders regarding the distribution of the added value and setting up of a legit consensus between them and the company itself. The main objectives of the study focus both on identifying the reasons that led to the development of the information transparency in order to satisfy the stakeholders’ expectations within the Integrated Reporting (IR) and on the dynamic analysis of the main economic and financial factors (from a sample of 180 companies quoted on the stock exchange during 2008–2017) that were the foundation of the statistical design for evaluating the companies’ ability to satisfy the stakeholders’ expectations. The research methods refer to identifying those evaluation methods in terms of the IR’s quality and compliance regarding the stakeholders’ expectations based on the analysis of the database and the econometric model. The final results can be very useful both for those companies that are already using or will choose to apply the IR in the near future and for the potential stakeholders as they have the option of evaluating beforehand the degree of satisfaction of their expectations in relationship with the reporting company.
JEL CLASSIFICATIONS:
1. Introduction
The companies’ ability based on the IR to comply to the stakeholders’ expectations has always been a scientific matter that has sparked the researchers’ interest from the point of view of both the adjusting market mechanisms and the concern for attracting the investment capital.
Several stakeholders have expressed concerns over the significant rise in financial and non-financial reporting by firms in recent years (e.g. Ernst & Young, Citation2012).
Thus, the changes that have come up in terms of the requirements of stakeholders, both from the point of view of their volume and structure have made the companies react to these necessities by taking on the use of an efficient tool for satisfying the legit expectations of stakeholders, namely by disclosing certain high-quality information. Thus, IR may be viewed as a set of processes and activities through which a company offers both financial and non-financial information on the company's strategy, performance and predictions of its own activity.
The objective of IR is to identify and communicate, based on a consistent not a formal approach, those critical factors that have an impact on the company's ability to generate long-term value. Basically, IR has the function of establishing those connections that were established between the social and the environment performance, on the one hand, and the economic and financial performance, on the other hand, by actually manifesting itself as an useful tool especially for the medium and long-term investors as well as for the other categories of interested categories (Fasan, Citation2017).
Based on these facts, the objective of our study refers to evaluating the companies’ ability of meeting the legit expectations of the stakeholders from the point of view of their distribution of the global added value with the help of the econometric model, by extrapolating the accounting field (i.e. mandatory reporting) yet taking into account a series of derivative indicators that are considered to be crucial for the improvement of the quality of the disclosure or communication and for the relationship with these information users. In order to reach this goal, we have focussed on the following objectives: the 1st objective – the analysis of the regulatory framework and of the specialty literature on the IR in order to identify the reasons for the growth of the information transparency for the stakeholders; the 2nd objective – the dynamic analysis of the main economic and financial indicators as well as of the derivative indicators that are at the foundation of the statistical method of evaluating the companies’ ability to meet the stakeholders’ expectations from the point of view of the distribution of the added value; the 3rd objective – to identify and analyze those elements that promote the assets, the (financial and non-financial) performance of the owned assets by applying the scoring on the classified elements that are the result of the evaluation according to the 2nd objective.
The importance of our research is a consequence of the fact that nowadays companies are forced ’’to think” based on integration. This refers to the fact that the more this method is integrated in the company’s daily activity, the more justified the informational connection in the management report is justified for the analysis and the decisional–making process. In fact, the findings of our study show that this type of approach allows, for the efficient use of the information systems as well the use of the IR through which the legit expectations of the stakeholders are met in a more transparent and efficient way by thus encouraging the consolidation of the mutual and trustworthy relationships and the establishment of the added value for the company.
2. Literature review
The IR from International Integrated Reporting Council (IIRC) perspective is” a set of processes and activities that lead to a periodical reporting regarding the way the organization’s management, the strategy, the performance and forecasts allow the value’s long-term establishment and maintenance” (IIRC, Citation2013). The concept of establishing a long-term value needs to be considered from two points of view: the establishment of the value for the capital suppliers as well as for the other stakeholders represent the key element of the IIRC framework.
In order to support the 1st objective of our study by taking into account the specialty literature, we analysed the most important studies that focussed on the connection between the IR and the corporate social responsibility (CSR); the transition from the sustainability report and the IR; the CSR and the non-financial indicators, the IR and the economic and financial performance; the quality of the IR and the expectations and interests of the stakeholders; the benefits and limitations when satisfying the stakeholders’ expectations; the benefits and limitations that are faced when satisfying the stakeholders’ demands. The main criterion for choosing previous studies was represented by their relevance determined by the number of citations in the field of IR and CSR (see ).
Table 1. The synthesis of the main impact studies on the researched field.
There are also authors like Hoque (Citation2017) who believe that the IR is a holistic approach that allows the stakeholders to understand the way this organization functions. It has in view the long–term consequences of the decisions and actions while clarifying the relationship that exists among the social, economic and environmental value. This refers to the connections that are established among the strategy adopted by an organization, the government and the business model.
In other words, the clear identification of the business model, of the company’s strategy, of the risks it may face, of the significant assets, of the development perspectives allow for the manifestation of a meaningful, not formal relationship among the company and the various functions which finally will have to lead towards a common approach (Cosma, Soana, & Venturelli1, Citation2018; Fasan, Citation2017).
However, the overall image as a result of the convergence of the financial and non-financial information rendered by the IR shows a company’s responsibility towards the environment and the society itself, in general, by taking into account its financial consequences. This fact helps the stakeholders observe the way they are treated as well as the sustainability of a company’s activity (Galant & Cadez, Citation2017; Hoque, Citation2017).
In spite of the fact that we are not able to define those requirements that may lead to establishing a perfect IR, it needs to be able to show the means through which a company generates value. The compatibility between the data and the information that result from the IR can manifest itself only when it is based on certain standards (Directive Citation2014/95/EU). For example, there are many instances when the profit or earnings before interest, taxes, depreciation and amortization (EBITDA) does not represent an objective in itself for a company. The IR offers these companies the chance of displaying their hierarchy of values and objectives (except for the risk factor when certain companies can make use of the IR as a simple communication tool devoid of its true meaning) (Mongiello, Citation2017; Wilburn & Wilburn, Citation2016).
The use of the IR has gained in popularity as approximate 1600 companies all over the world have voluntarily taken on this type of reporting (e.g. in South Africa, the IR is mandatory for the quoted businesses) (Iredele, Citation2019; Mercurio, Citation2017). Apart from the technical details and the indications stipulated by the International Framework IIRC (the principles of connectivity, materiality, comparability etc), some aspects that lay the foundation for the IR by companies refer to the practical consequences that they are capable of generating within their own activity and as part of the specific reference framework. Thus, the IR represents a valuable informative source for a company’s management that is entitled to make solid decisions by taking into account the short-term or long-term consequences (Fasan, Citation2017).
3. Material and method
Taking into account the analyzed studies, the sample designed by the authors started from the quantitative type of research that was rendered by qualitative evaluation techniques based on the scoring method. In the specialty literature, there are studies that use the quantitative comparison method (Cosma et al., Citation2018; Stolowy & Paugam, Citation2018). The first quantitative research identifies the IR phenomenon based on the evaluation of the ability to recognize based on the bonus of the stakeholders’ reporting. In the second study, the researchers analyze from a quantitative perspective the expansionary evolving phenomenon of the IR and its effects, too. Without relying solely on this method, the actual research makes use of the qualitative method whose basic principles are synthesized in the study done by Silverman (Citation2015). It refers to decoding the mechanisms based on the study of the connections among the phenomena.
In order to meet the objectives, we made the selection of a sample that was initially made up of 500 quoted companies (Standard & Poor's 500) on New York Stock Exchange (NYSE) and National Association of Securities Dealers Automated Quotations (NASDAQ) by using the data from all the published reports in order to put together a database corresponding to 2008–2017 reporting period. After applying certain inclusion criteria (i.e. the primary feature of information, the homogeneity of the data, their connection with the market, the situation following the financial reporting of intangible assets) as well as the exclusion criteria (i.e. the company’s affiliation to banking activities, the absence of reported intangible assets, the continuity principle of the quote, the non-standard trends regarding the stock policy; some issues regarding the profitability of the assets of low reduced efficiency), only 180 companies were selected, in order to test the relevance of the information based on 30 patrimonial, financial and derivative indicators. The financial, environment and social companies’ yearly reports were considered the main information source. They are viewed in the specialty literature as the main communication source with the stakeholders (Antohi & Zlati, Citation2017; Burcă, Mateș & Bunget, Citation2018; Domil, Artene, & Pavel, 2012; Pivac, Vuko, & Cular, Citation2017; Zlati, Antohi, & Cardon, Citation2018).
This database was interpreted in a qualitative manner in order to establish the maximum impact range for the statistical indicators that might reflect or not the connection between the IR and the CSR. This process was done for each and every sector of production or services which the companies operate in. Certain top categories of statistical incidence that were organized according to the field and type of industry came out as a result of that. Those top categories became (through the qualitative assignment of the values on the impact interval) part of the estimation of the suggested statistical model. More precisely, the quantitative tiebreaker that was critically analysed in the observational study was changed based on the takeovers on representation maximal ranges in a qualitative process of data analysis and of designing those data series that were later on adjusted based on the GRETL program, the 2019d version.
In order to achieve the goal of the research, we focussed on designing an econometric model (the 2nd objective of the research) that enabled us to estimate the companies’ ability to satisfy the legit expectations of the stakeholders from the point of view of their distribution of the global value. The patrimonial and financial analysis focussed on the following:
the patrimonial analysis of the accumulation of dynamic turnovers for those 180 companies that were grouped into 12 fields of activity (see ). The patrimonial analysis focussed on the dynamics of the total assets and subsequently, of the intangible assets, of their goodwill, of their research and development expenses;
Table 5. The dynamic evolution of the companies’ capitalization during 2008–2017 on categories of activities.
the financial analysis focussed on the dynamics of the turnover, the gross and net profit, the operational profit and earnings before interest and taxes (EBIT). From a financial point of view, taking into account the stakeholders’ interest, the variation of the net value per action, the ratio value on the market as well as the earnings per share (EPS) were analyzed. Moreover, a series of derivative indicators such as asset turnover (AsT), the price earnings ratio (PER), the goodwill to the assets ratio (GWAsT), the debt to equity ratio (D_Er), the return on equity (ROE), the return on invested capital (ROIC), the return on assets (ROA) were analyzed.
In designing the model, the following hypotheses were formulated:
Hypothesis 1 (H1): The patrimonial values are expected to be produced by the company are directly quantified with the value of the reported intangible asset and the goodwill elements that exist at a certain point of time.
Hypothesis 2 (H2): The imbalance of the meeting point of the demand and financial information offer is proportionally with the value given by the EPS indicator. The difference between the mathematical optimum and the achieved value for the stakeholders is directly attributed to the non-formal elements that are part of the IR.
Hypothesis 3 (H3): The value of the financial elements that were dynamically analyzed will represent a trustworthy piece of information for the stakeholders only if the trend of financial accumulation corresponds to the trend of business capitalization.
Hypothesis 4 (H4): The ability of a company to satisfy the stakeholders’ expectations is closely linked to the managers’ concern for purchasing intangible assets and for innovation.
Hypothesis 5 (H5): The IR has a positive impact on the financial performance.
Hypothesis 6 (H6): The IR prevents the breakout of the financial crisis.
The suggested econometrical model in relation with the H1–H6 established hypothesis is expressed as follows:
Consider N - the expected value for non-formal information.
We state that ∃ represents the multiplicative type of function F (x) → R: R, as the multiplicative function that refers to the degree of satisfaction related to the stakeholder’s expectations. It indicates the level of satisfaction in relationship with the stakeholders’ expectations. The function generates valid values only if the value of the trend of patrimonial indicators are directly related to the value of the trend of financial indicators. The function’s inflection point is given by the trend difference that offers quote quantifiable differences on three major impact levels. The dispersion around the inflection point validates the accuracy of the reporting in connection with the stakeholders’ expectations. The satisfaction function is defined as follows:
(1)
(1)
where:
F(x) – the satisfaction function that is measured based on the value of the investment from the point of view of the reimbursements by cumulating the current share price relative to its EPS per sector;
C(i, j) – the aggregated indicators(i): asset turnover, price earnings ratio, goodwill to asset ratio, debt to equity ratio, return on equity, return on invested capital, return on assets that estimated dynamically on average for each and every sector (j). i= {1, 2, 3, 4, 5}; j = {1, 2, 3, 4, 5, 6, 7, 8, 9, 10, 11, 12}.
The transposition of the multiplicative function based on the variables that were estimated taking into account the type C(i,j) aggregate indicators in a simple regression equation is defined as follows:
(2)
(2)
where: PER – Market value price per share/EPS; AsT – Revenue/turnover to average assets; GWAsT – Goodwill/Total assets; D_Er – Total debt/Total Equity; ROE – Net income/Total equity; ROA – Net income + interest expense)/Average total assets.
The model based on the scoring method (i.e. the 3rd objective of the research) was rendered by GRETL, 2019d version statistical programme according to the following methodology: the accomplishments in each and every field were evaluated based on the average on the sector and compared to the quartilical ranges in order to establish the yearly ranking of the sectors in connection with the patrimonial, financial and derivative indicators that were identified for those 180 companies that were included in the database (i.e. the qualitative method).
4. Results and discussions
In order to be able to evaluate the companies’ ability to respond to the legit expectations of the stakeholders from the point of view of the global added value, we analyzed the entire sample focussing on estimating the degree of disclosure of the information regarding the economic, financial and social issues.
As it was shown, the analysis of the performances of the sectors revealed in terms of the 2nd objective of the research that there was a need of getting more information expressed by the involved parties related to the global added value. This led to the design of the following estimation econometric model:
(3)
(3)
n = 12, R-squared = 0,632 (standard errors in parentheses)
There are a series of studies that measure the financial performance based both on the financial and accounting data and other data of the financial market that are not part of the mandatory reporting (Antohi & Zlati, Citation2018; Graves & Waddock, Citation1994; Yoshikawa & Phan, Citation2003). This approach allows the prominence of not only the long-term financial consequences of the CSR activities, but also of the market’s reaction to these activities. Although these sorts of approaches are still debatable (Saleh, Zulkifli, & Muhamad, Citation2008), the present study analyses the companies’ financial performance based on derivative and accounting indicators. As far as the accounting indicators are concerned, the analysis was done by observing the ROA, an indicator that is frequently used in order to measure the business performance and the ROE that is the stakeholders’ main concern (Yoshikawa & Phan, Citation2003).
By analysing the correlations of the C(i, j) indicators in relationship with the dependent variable, the connection between the current share price and its per-share earnings for those 12 sectors on an average sector, a 63.2% statistical value for the estimated function of the heteroskedasticity model was given.
The econometric satisfaction model based on the heteroskedasticity-corrected method that analyses the relationships that exist between the regression variables C(i,j) and the dependent variable PER is shown as follows (see ):
Table 2. Heteroskedasticity-corrected based on observations 1–12; Dependent variable: PER.
The important significance of the model was given based on the estimation of the p value of the regression indicators. It was the consequence of the fact that the model has a high significance for the performance domain that is represented by the goodwill indicator to asset ration and the ROE and ROA rectifiers in relationship with the value of the PER independent variable. According to , the tests for the residues’ normality have shown that the error was naturally distributed whereas the variation of the collinearity function indicates through the Belsley-Kuh-Welsch test that fact that the data collinearity is absent. The indications of collinearity indexis are under the 10 points critical value (AsT: 1,185; GWAsT: 2,878; D_Er: 1,536; ROE: 3,998; ROA: 2,147).
The normality test for the residues is show in the distribution under the Gauss curbe of the values of the dependent variable on the quartile ranges. This demonstrates the fact that function of the model is a homogenous one, whereas the inflection point is on the top position of the ascending gradient. It is a maximum value that the stakeholders are willing to invest based on the optimistic trends on the market. Yet, the volatility risk is the one that usually influences the profits they expect to get ().
Figure 1. (a) Histogram of errors (b) forecast chart.
Source: GRETL program, the 2019d version.
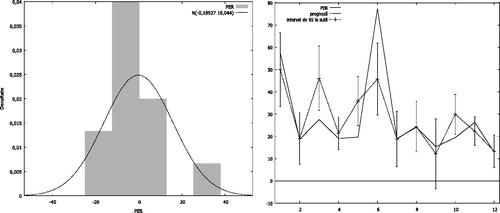
The forecast diagram defined by the forecast function for the 95% confidence interval N (−0,18527; 16, 044) shows the model’s validity based on the supervised evolution of the prediction related to the actual trend of the function.
Thus, the actual model confirms the accomplishment of the 2nd objective of the research and lays the foundation for the accomplishment of the latter. The identification of the elements was based on using a classical scoring procedure where the minimum, average and maximum criteria were used following the centralization of the points. The diagrams of the distribution of the added value were designed (see ).
Table 3. Distribution of the added value of the information that were offered to the stakeholders on the high compliance level (the maximum option).
Table 4. Distribution of the added value of the information that were offered to the stakeholders on the average and minim compliance level.
The table below comprises the data referring to the distribution of the added value of the information that were offered to the stakeholders based on the high compliance level (the maximum option) (see ).
comprises the distribution of the added value of the information that were offered to the stakeholders referring to the average and minim compliance level.
As far as the dynamic evolution on mobile assets and fields of activity of the capitalization phenomenon is concerned, those 180 companies have registered, on the average, a 24,500 million dollars in turnover. The most efficient ones from this point of view were those companies from the energy industry and telecommunications with a double turnover in comparison with the average (i.e. 50,000 million dollars). Average performances were made in the automotive industry, technology and raw manufacture. The most disadvantaged sectors in regards to the value of the accrued turnovers in dynamics are tourism (8,100 million dollars) and business consulting (10,000 million dollars). (see )
According to , the years 2011 and 2014 were the most favourable periods for accomplishing the capitalization on sectors.
During the last period of time, namely between 2015 and 2017, a reduction of the companies’ capitalization regarding the majority of the sectors of activity took place. This signals the vulnerability of the global economy that was during the pre-recession stage that was similar to the one of 2009.
From the point of view of the degree of indebtedness for the wholesale trade, one could notice that the dynamic accumulation of 55.23%, indebtedness which is 5 times higher than the overall average of the amount of accumulation for all the analyzed sectors. The vulnerable sectors in terms of the degree of indebtedness are transportation, apparel, industrial sectors whereas the stable ones (i.e. having a financial stability) are the raw materials, chemical and the telecommunications sectors (see ). From the point of view of the relationship that manifest between them, the companies’ capitalization and the degree of indebtedness clearly show that the growth of the indebtedness is direct proportion with the financial crisis periods of time. The climax points in the graph indicate the 2009–2014 time frame (see ).
Table 6. The evolution of the companies’ degree of indebtedness as a result of the dynamic debt accumulation during 2009–2017.
The patrimonial dynamic analysis for those 180 companies that are divided in 12 categories of activities has focussed both on the dynamics of the total assets, the intangible assets, the goodwill, and the research and development expenditures (see ).
Table 7. The patrimonial analysis of the companies from the 12 dynamic sectors between 2008 and 2017.
It is a fact that, taking into account the accumulation of assets, the best performance was registered within the telecommunications and the wholesale sectors. As part of the second group, the manufacture and energy sectors, comprise assets accumulation of 77,000 million dollars over the overall average. As a peculiarity, in spite of the fact that from the point of view of the assets, the wholesale trade sector had a high performance, the reflection in equity of owning assets is very low (under 10%), whereas its debts and its debt-to-equity ratios are the highest of all the categories of the analyzed activities (i.e. 95% of the total assets).
The intangible assets are the reflection of the orientation of his sector towards incorporating the leading technology and the research-development sector. This can lead to financial stability for all the stakeholders on medium and long-term. From this perspective, the telecommunications sector occupies a top position and the foods sector – the second position.
Raw materials sector is the only one that registered a negative performance – a badwill – that is partially due to the research and development sector whose average capitalization per sector.
The financial analysis focussed on the dynamics of the turnover (see ) of the net and gross profit, the operational profit and EBIT for those 180 companies during 2008–2017. From a financial perspective, having in view the stakeholders’ interest, we have analyzed the variation of the net value per share, the rate of value on the market and EPS. In regards to the financial segment (i.e. the profits expressed by the turnover), we have noticed a favourable average distribution for those companies in the manufacture, automotive, textile and wholesale sectors.
Table 8. The analysis of the dynamics of the turnover on activity sector during 2008–2017.
It is a fact that the most favourable period when significant growths of the turnover for most of the sectors was during 2011–2016. This period coincided with a revival of the global economy following the economic crisis from 2009.
shows the main financial data perceived by stakeholders as a result of the free trading on the stock exchanges.
Table 9. The dynamics of the diluted EPS, book value per share and price to book ratio on every field of activity during 2008–2017.
The analysis of the financial sector emphasizes the fact that the value per share, against all odds, does not vary in a close relationship with the companies’ capitalization or with the evolution of the assets accumulation. Our study shows the fact that the average value is around 20 dollars per share except for the raw materials and the wholesale sectors where the value per share is 3 times bigger than the one for the rest of the sectors. The share’ rate of market value is higher as opposed to that.
As far as the derivative indicators are concerned, they reflect the sector’s dynamic performances during 2008–2017. In the case of the business service and tourism sectors, they highlight the existence of higher rates than the average for the rest of the sectors (see ).
Table 10. The dynamics of the aggregated indicators corresponding to the fields of activity during 2008–2017.
From the point of view of the profitability of the invested turnover, the first top positions are occupied by the industrial and business services sectors that have 37% value as a confirmed result of the ROE estimation for the business service sector and a 32% not confirmed for the industrial branch.
Taking into account the the objective of the research, the most significant indicator is the ratio of a company's share (stock) price to the company's earnings per share.
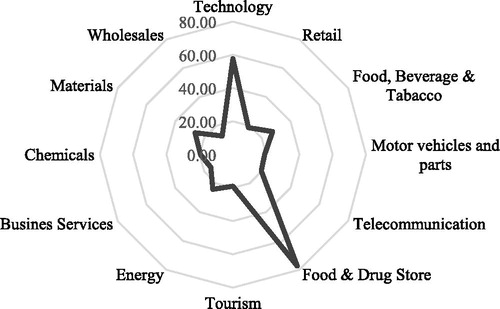
As seen from – the estimation on the average – of the fields of activity during 2008–2017, it is a fact that the foods, pharmaceutical and manufacture, industries have the best performances of all. This proves the fact that the stakeholders’ behaviour and their legit expectations rely more on informal facts and advertising and less on the financial elements. It clearly underlines the authors’ endeavour of evaluating the IR’s impact and of measuring the relevant indicators in order to be able to design an IR sustainable system.
Figure 2. The average of the relationship between the price per share and the profit per share on activity sectors.
Source: Author's own elaboration.
Thus, the suggested model allowed for the demonstration of the work hypothesis as follows:
H1: The patrimonial values that were expected to be made by the company are estimated directly proportional to the value of the goodwill and to the goodwill elements that were achieved at a certain moment.
Argumentation 1: According to - the significance value of the regression variable regarding the goodwill elements in relationship with PER has generated based on a p-value a high significance value (p-value < 0,001). This demonstrates the existence of an interdependency relationship and, consequently, the working hypothesis.
H2: The imbalance of the point where the expectation meets the financial information offer is directly proportional to the value of the EPS indicator. The difference between the mathematical optimum and the value destined for the stakeholders is directly reflected by the non-formal elements that are part of the IR.
Argumentation 2: The distribution diagram that is the result of the residues’ normality test (see ), has generated an inflexion point on the ascendant slope of Gauss curb in the proximity of the peak. This supports the working hypothesis.
H3: The value of the analyzed dynamic financial elements information is a trustworthy for the stakeholders only if the financial accumulation trend corresponds to the business capitalization trend.
Argumentation 3: According to and , the significance value of the regression variable on the profitablity of their own turnovers has generated a p-value, a high significance degree (p-value < 0,001). This fact demonstrates the presence of an interdependence relationship and, consequently, the working hypothesis.
H4: The company’s ability of satisfying the expectations of the stakeholders rise in a direct proportion with the managers’ concern for purchasing intangible assets for innovations.
Argumentation 4: The significance value of the regression variable on the assets’ profitability has generated a p-value with a high significance degree (p-value < 0,001). This demonstrates the existence of an interdependence relationship and, consequently, the working hypothesis (see ).
Hypothesis 5: IR has a positive impact on the financial performance.
Argumentation 5: The value of the accounting financial indicators that are part of the mandatory accounting report as well as the significant value of the derivative indicators that are part of the IR have a positive impact on the growth of the performance as shown in .
H6: IR is an element that prevents the outburst of the economic crisis from happening.
Argumentation (A6): The financial segment (i.e. the profit as shown by the turnover) indicates a favourable distribution on average for those companies from the technology sector, the automotive, apparel and wholesale sector. The dynamic situation reinforces the fact that in the past few years there has been a stable point in time prior to the outburst of the economic crisis that was similar to 2010 when the majority of the economic sectors have experienced a drawback, some of them of even 25%–30%.
This stage of research basically highlights the type of disclosure both of the financial and accounting information and of those related to the derivative performance indicators that are part of the IR in spite of the fact that the performance indicators are considered to be objective parameters that measure the social performance (Clarkson, Li, Richardson, & Vasvari Citation2008), At the same time, the Global Reporting Initiative (GRI) offers clear insights on the performance indicators of those 180 analyzed companies that provided on-line quantitative data. The reasons are as follows: they either choose to use those standards that were settled based on the standards Global Business Services (GBS), or, in spite of the fact that they design their CSR report according to the principle of The Sustainability Reporting Guidelines of GRI (GRI G4, Citation2013), they fail to provide quantitative data on those indicators or, while designing the CSR report in accordance with the guidelines regarding GRI G4 (current GRI 102), they provide the quantitative data comprise relevant indicators in the English language only. The last case scenario would be that they choose not to adopt any kind of reference standard at all.
We have observed that throughout the past years the companies are focussed on the means they reveal their commitments within the field of the social policies. This is the reason why the communication or the reporting is no longer a subsidiary tool in consolidating their image and notoriety on the market. It has become a key element for the strategic and operational management of these companies as well as for ensuring the success of any applied social responsibility policy. In this context, the relationships that exist between the company and the stakeholders are ensured and consolidated only if there is a good communication and disclosure that can act as a strategic balance for establishing and maintaining the company’s reputation. It also needs to be related to the social responsible behaviour that will generate trust in the relationship with the stakeholders.
5. Conclusions
The companies’ growing need of making use of extra communication tools(with a special attention given to satisfying the stakeholders’ expectations) and of CSR has led to the implementation of a new reporting model, namely the IR, that has played a key role in reducing the informational asymmetry due to the way it manages to comprise a series of various types of information that are useful in satisfying the stakeholders’ expectations.
We believe that the companies’ endeavour (especially the quoted ones) to satisfy the stakeholders’ expectations as much as possible may be supported by the statistical model that enables the stakeholders to get an idea of how much that specific company is focussed on satisfying their expectations. Consequently, a company’s value drive puts the management in a position when they have to decide on the proper way of communicating with the stakeholders by constantly reporting themselves to the actual situation they face in order to select the most appropriate solution for the company itself. The manifestation of the ability of such company to satisfy the stakeholders’ expectations in relationship with the distribution of the global value offers those who are part of the situation an extra reason to feel secure, trustworthy and to ensure an informational transparency.
The findings of the study reflect the companies’ compliance for satisfying the stakeholders’ expectations through the use of the IR in relationship with the management ability of ensuring a sustainable development encouraged by the CSR. This complex relational aspect is accomplished as part of the real estimations of the phenomenon itself. Moreover, some aspects regarding the migration of the investment interest towards the know-how elements in connection with the use of the performance objectives that are analysed for a specific sector can signal(based on the use of the model shown) the beginnings of the economic crisis and can offer the companies an useful study on how to prioritize the development strategies in connection with the forecast of possible economic crisis.
The results of the study prove the idea that the IR quality is in a relationship of direct causality with the stakeholders’ expectations.
These findings could be useful for those companies that are focussed on getting and maintaining their sustainable value by making use of the IR as a communication tool of the financial and non-financial information that is shared with the stakeholders. It can have a key role in influencing the company's reputation on the market and, consequently, in its global value.
One single limitation of this study should be noted: the statistics on the “sustainable reporting” and “the CSR reporting” can be undermined due to the fact that some companies may disclose certain online information on their websites and not as part of a specific report. Taking into account the fact that the gathered data that were used to support the empirical study were hard to get, the sample that served as the grounds for the statistical analysis was pretty small.
Thus, it would be interesting to to find out whether the findings of this study apply to a larger and more diversified sample of companies from the point of view of their field of activity. The study can cover other different fields of activity.
Disclosure statement
The authors reports no conflicts of interest.
References
- Antohi, V. M., & Zlati, M. L. (2017). The Impact of the application of the fiscal risk assessment procedure in Romania. Economics and Applied Informatics, 3, 78–86.
- Antohi, V. M., & Zlati, M. L. (2018). The impact of profit taxation on the financial solvency of economic agents. International Conference, Risk in Contemporary Economy, “Dunarea de Jos” University of Galati, Faculty of Economics and Business Administration, 43–55. Retrieved from: http://www.rce.feaa.ugal.ro/images/stories/RCE2018/Antohi_Zlati.pdf.
- Baptista, N. (2018). O relato integrado estimula a comunicação estratégica de responsabilidade social corporativa? Uma análise na perspectiva do marketing, baseada no modelo de responsabilidade social corporativa proposto por Maignan. Ferrell e Ferrell. Media & Jornalismo, 18(33), 43–60.
- Burcă, V., Mateş, D., & Bunget, O. C. (2018). Empirical research on identifying main drivers leading to integrated reporting framework implementation. The case of European region. Romanian Economic Journal, XXI(70), 52–72.
- Clarkson, P. M., Li, Y., Richardson, G. D., & Vasvari, F. P. (2008). Revisiting the relation between environmental performance and environmental disclosure: An empirical analysis. Accounting, organizations and society, 33(4–5), 303–327.
- Cosma, S., Soana, M. G., & Venturelli1, A. (2018). Does the market reward the integrated report quality? African Journal of Business Management, 12(4), 78–91.
- Directive 2014/95/EU of the European Parliament and of the Council of 22 October 2014 amending Directive 2013/34/EU as regards disclosure of non-financial and diversity information by certain large undertakings and groups Text with EEA relevance.
- Domil, A. E., Artene, A. E., & Pavel, C. D. (2012). International harmonization of accounting standards for multinational entities. Anale. Seria Ştiinţe Economice. Timişoara, XVIII(18), 351–357.
- Ernst & Young. (2012). Now is the time to address disclosure overload. Retrieved from http://www.lexissecuritiesmosaic.com/gateway/sec/speech/$FILE_TothePoint_BB2367_DisclosureOverload_21June2012.pdf
- Fasan, M. (2017). Lo stato dell’arte del corporate reporting: Integrated Reporting. (pp.17–30). In M. Fasan, & S. Bianchi (Eds.), L’azienda sostenibile. Venice: Trend, strumenti e case study, Edizioni Ca’ Foscari - Digital Publishing. Retrieved from https://edizionicafoscari.unive.it/media/pdf/books/978-88-6969-202-4/978-88-6969-202-4_bRd7yhz.pdf
- Galant, A., & Cadez, S. (2017). Corporate social responsibility and financial performance relationship: A review of measurement approaches. Economic Research-Ekonomska Istraživanja, 30(1), 676–693. doi:10.1080/1331677X.2017.1313122
- Graves, S. B., & Waddock, S. A. (1994). Institutional ownership and corporate social performance. Academy of Management Journal, 37(4), 1034–1046.
- GRI 102: General Disclosures 2016. In consolidated set of GRI sustainability reporting standards (2018). Retrieved from https://www.globalreporting.org/standards/gri-standardsdownload-center/consolidated-set-of-gri-standards/
- G4 Sustainability Reporting Guidelines. (2013). Part 1: Reporting principles and standard disclosures. Retrieved from https://www.globalreporting.org/resourcelibrary/GRIG4-Part1-Reporting-Principles-and-Standard-Disclosures.pdf.
- Hoque, M. E. (2017). Why company should adopt integrated reporting? International Journal of Economics and Financial Issues, 7(1), 241–248.
- IIRC. (2013). Integrated reporting. Retrieved from http://integratedreporting.org/resources/
- Iredele, O. O. (2019). Examining the association between the quality of the integrated reports and the corporate characteristics. Heliyon, 5(7), e01932. doi:10.1016/j.heliyon.2019.e01932
- Klaver, M. (2017). Sustainability reporting, integrated reporting, analyst coverage and the cost of equity capital (Thesis). Radboud University, Nijmegen.
- Mercurio, G. P. (2017). Annual report times. Il primo Foglio Culturale sul Reporting. Al cuore del-IR. Retrieved from http://www.annualreporttimes.com/magazine/2017/content/AnnualReportTimes-2017.pdf
- Mongiello, M. (2017). Il punto di vista di Paul Druckman sul ruolo dell’IIRC e il futuro del corporate reporting. L’azienda Sostenibile, I Libri di Ca’ Foscari, 4, 31–39.
- Pivac, S., Vuko, T., & Cular, M. (2017). Analysis of annual report disclosure quality for listed companies in transition countries. Economic Research-Ekonomska Istraživanja, 30(1), 721–731. doi:10.1080/1331677X.2017.1311231
- Rupley, K. H., Brown, D., & Marshall, S. (2017). Evolution of corporate reporting: From stand-alone corporate social responsibility reporting to the integrated reporting. Research in Accounting Regulation, 29(2), 172–176. doi:10.1016/j.racreg.2017.09.010
- Saleh, M., Zulkifli, N., & Muhamad, R. (2008). An empirical examination of the relationship between corporate social responsibility disclosure and financial performance in an emerging market. In Proceedings of the 16th Annual Conference on Pacific Basin Finance Economics Accounting Management (PBFEAM), Brisbane, Australia.
- Silverman, D. (2015). Interpreting qualitative data. London: SAGE Publication.
- Stolowy, H., & Paugam, L. (2018). The expansion of the non-financial reporting: An exploratory study. Accounting and Business Research, 48(5), 525–548. doi:10.1080/00014788.2018.1470141
- Sustainability Reporting Guidelines of GRI. (2013). Retrieved from https://www.globalreporting.org/resourcelibrary/GRIG4-Part1-Reporting-Principles-and-Standard-Disclosures.pdf
- Wilburn, K. M., & Wilburn, H. R. (2016). The growing importance of integrated reporting for corporate social responsibility. Review of Business & Finance Studies, 7(2), 75–89. Retrieved from https://ssrn.com/abstract=2801775.
- Yoshikawa, T., & Phan, P. H. (2003). The performance implications of ownership-driven governance reform. European Management Journal, 21(6), 698–706. doi:10.1016/j.emj.2003.09.013
- Zlati, M. L., Antohi, V. M., & Cardon, P. (2018). Aspects regarding the corresponding between adjustments of fixed assets in accordance with the accounting policy manual. European Journal of Accounting, Finance & Business, 7(17), 115–123.