
 ?Mathematical formulae have been encoded as MathML and are displayed in this HTML version using MathJax in order to improve their display. Uncheck the box to turn MathJax off. This feature requires Javascript. Click on a formula to zoom.
Abstract
This study examined the determinants of economic development for the 34 member countries of the Organization for Economic Cooperation and Development (OECD) and analysed efficient uses of economic development resource endowments. The methodology included econometric panel data modelling and stochastic frontier analysis, using the Cobb-Douglas production function and trans-logarithmic functional form to analyse data from 2003 to 2012. Economic growth was measured by the gross domestic product (GDP) of each economy. As a result, the determinants of economic development were presented and a ranking of efficiency was obtained for all OECD economies throughout the period of analysis. It was concluded that countries with higher economic growth levels have higher efficiency rankings. For example, countries with higher efficiency rankings were Luxembourg and the U.S.; Chile and Mexico were ranked lower. Finally, there was a positive relationship between growth levels and technical efficiency levels.
1. Introduction
Economic development is a topic that has been widely studied. Several authors and institutions are dedicated to analysing different models, methodologies and data management to measure development levels of countries and identify their determinants. Two main theoretical approaches are found in the literature: classical and neoclassical, which measure economic growth, as well as other schools of thought that also consider non-economic variables. These are used to design public policies aimed at increasing a population’s well-being with a human-centred approach that considers sustainable behaviour as a parameter to ensure development beyond economic growth. Economic growth is still considered necessary in obtaining economic development and increasing human productivity (Dang & Sui Pheng, Citation2015; Ranis, Stewart, & Ramire, Citation2000; UNDP, Citation1990).
This study analysed economic growth-related studies that have assessed parameters for measuring development such as education, health and institutions (Altinay & Karagol, Citation2005). In contrast with previous empirical studies, the value of the econometric strategy is that it does not depend on the scale of the countries, and the use of GDP as a dependent variable eliminates bias due to scale. This research extends the enterprise production function to economies in order to measure their technical efficiency. The generation of goods and services is related to production factors, such as labour and capital. When a country performs better in these dimensions, it improves its ranking compared to the other countries included in the study.
Stochastic frontier analysis methodology used in this study merges ideas from both schools of thought. The Organization for Economic Cooperation and Development (OECD) aims to promote economic growth, prosperity, and sustainable development; thus, it has developed a series of good practice guidelines after gathering statistics so they can be compared. Its 34 member countries have different degrees of economic development, which makes it a good study sample.
In the present study, we assess the technical efficiency of OECD member countries to determine whether higher GDPs imply higher levels of efficiency in their use of resources. Finally, we identify the OECD countries with higher efficiency rankings to compare them to those with lower efficiency rankings.
The conclusions allowed us to infer economic performance, and demonstrated that there are some economies capable of obtaining higher well-being, but are not achieving that goal.
2. Theoretical framework
The approach used in this study focused on a wide range of economic growth determinants. It was geared towards a relative measure rather than an absolute measure of economic performance, considering that many factors interact to attain GDP results (Bodenstein, Faust, & Furness, Citation2017; De la Fuente, Vallina, & Pino, Citation2013; Fouquet & Broadberry, Citation2015; Haavio, Mendicino, & Punzi, Citation2014).
Authors and institutions were reviewed to build a theoretical framework to classify and define indicators of economic development. The analysis focused on macroeconomic determinants that influence a country’s economic performance, for example: income, savings and investment, population growth and unemployment.
GDP is a widely chosen indicator for evaluating the economic behaviour of a country, since it demonstrates income generated by different economic agents. It also measures the cost of goods and services production in the economy, which is measured in terms of factor payments and products produced in each economic sector. Thus, income and expenditure are equal at a macroeconomic level (Dornbusch, Fischer, & Starzt, 2004). The difference between GDP at market value and at factor cost is explained by indirect taxes (Dornbusch, Fischer, & Startz, Citation2004).
Economic growth can be used as a dependent variable as it enables governments to provide more and better public goods and services, such as education, health services and infrastructure (Acemoglu & Robinson, Citation2012; Mankiw, Citation2012). GDP is the market value of all final goods and services produced in a country during a given period (Dornbusch et al., Citation2004). The GDP adds different types of products together to obtain the value of economic activity at market prices. Its purpose is to include all items produced in the economy and sold on the market. However, certain products are omitted, such as those that are produced and sold illicitly and homemade goods that don’t reach the market. This statistic is posted quarterly in order to analyse trends, and is seasonally adjusted to account for seasonal production changes inherent to some goods and services (Dornbusch et al., Citation2004, Jones, Citation2015).
According to Chirwa and Odhiambo (Citation2016), the most relevant variables in theoretical models are as follows: investment or increase in physical capital (Solow, Citation1956; Swan, Citation1956), savings (Ramsey Citation1928; Cass Citation1965; Koopmans Citation1965), new ideas and learning-by-doing (Arrow, Citation1962; Sheshinski, Citation1967; Uzawa, Citation1965), R&D (Romer, Citation1986) R&D and non-Pareto optimality in a competitive market, human capital (Lucas Citation1988), human capital plus investment (Mankiw, Romer & Weil, Citation1992), R&D and imperfect competition (Romer Citation1990; Aghion & Howitt Citation1992; Grossman & Helpman Citation1991).
Savings and investment are two macroeconomic aggregates that are important to GDP growth in the long run (Dornbusch et al., Citation2004). These factors relate resource allocation among different periods of time. One method of increasing future productivity is to allocate current resources to increase capital stock, which is accomplished by saving part of their current income to finance investment in order to grow (Cojocaru, Falaris, Hoffman, & Miller, Citation2016; De Gregorio, Citation2016). Although there is a demonstrated correlation between growth and investment, causality is uncertain (Cole, Citation2004). Nonetheless, there is evidence that capital accumulation increases productivity and a consensus that higher investment levels accelerate economic growth. Increasing capital stock raises productivity and accelerates GDP growth. However, for a certain scale, capital shows diminishing returns. Thus, an increase in savings raises productivity and income, but does not necessarily accelerate the growth rate of these variables. Nevertheless, investment in physical capital is important, and countries that save/invest more of their GDP grow faster (Cole, Citation2004).
Investment is also known as gross capital formation, which is composed of expenditures on fixed assets of the economy plus net change in inventories (Dornbusch et al., Citation2004). Fixed assets include land improvements, buildings, machinery and equipment purchases, as well as construction of roads, railways, and similar infrastructure. Inventories are stocks of goods held by firms to meet temporary or unexpected fluctuations in production or sales. Hence, changes in inventories represent the differences between expected and current expenditure in the economy. Accordingly, gross capital formation contributes to growth through real investment, measured in relation to GDP, which reflects the physical quantity evolution of capital and output (Acemoglu & Robinson, Citation2015; Sala-I-Martin, Doppelhofer, & Miller, Citation2004; Simionescu, Lazányi, Sopková, Dobeš, & Balcerzak, Citation2017).
Chirwa and Odhiambo (Citation2016) define the following as determinants: savings and investment efficiency (Acemoglu & Robinson, Citation2015; Cole, Citation2004; Easterly & Wezel, Citation1989), macroeconomic stability (Fisher Citation1992), institutions, human capital, international openness and public investment (Acikgoz & Mert, Citation2014; Barro, Citation1990, Citation1999 & Citation2003; Burnside & Dollar, Citation2000; Easterly & Levine, Citation1997; Knight, Loayza, & Villanueva, Citation1993).
The economic development strategy has other key aspects, including job creation and the improvement of a country’s business environment to promote business creation. Both determine the opportunities offered to people by society. New businesses imply job creation, and employment is important for social cohesion, since full employment helps reduce dissatisfaction among the population (Kerr, Kerr, Özden, & Parsons, Citation2016; Peri, Citation2016; Stiglitz, Citation2002).
Other empirical studies consider a variety of parameters such as entrepreneurial culture (Fernández-Serrano, Berbegal, Velasco, & Expósito, Citation2018), innovation (Fuentes Solis & Ferrada Rubio, 2016; Furman, Porter, & Stern, Citation2002; González-Cruz & Devece, Citation2018; Hai, Roig-Dobón, & Sánchez-García, Citation2016) or entrepreneurship (Gu, Qian, & Lu, Citation2018).
According to the International Labour Organization (ILO), the conceptual framework for measuring a labour force was adopted by the International Conference of Labour Statisticians in 1982. This Conference defined classification standards according to a person’s activity during a short reference period, such as a week or a day, in three exhaustive and mutually exclusive categories: employed, unemployed, and economically inactive. The labour force is composed by those that are employed and unemployed, as they are part of the economically active population that are either working or looking for work. Thus, the criteria to measure a labour force is threefold: to have a job, to be looking for a job or to be available for work. The labour force includes both nationals and immigrants because both produce goods and services that are considered in the GDP (Kerr et al., Citation2016; Peri, Citation2016).
The economically active population includes people from 15 to 65 years old if they meet the physical and intellectual conditions to have a job (Dornbusch et al., Citation2004). The inactive population includes those in the same age range that have no job, are not looking for work and are not available for work (Dornbusch et al., Citation2004). People under or over the minimum age are passive, as it is assumed that they are not in a proper work condition, or that they have already retired from the work force. Those considered unemployed do not have a job but are either looking for one or are available to take a job offer (Dornbusch et al., Citation2004).
The unemployment rate is the percentage of the economically active population seeking a job but that are not yet occupied. The unemployment rate is widely used as an overall indicator of a country’s economic health (Stiglitz, Citation2002).
Vergara (Citation2005) includes the participation of women in the labour force as an economic growth indicator, and concludes that low participation has at least two negative consequences. First, the skills of a significant fraction of the population are not utilized. Second, lower income women have lower labour force participation, which deepens income inequality. Aragon-Mendoza, Pardo del Val, and Roig-Dobón (Citation2016) incorporate this gendered perspective with a focus on the creation of quality entrepreneurship.
Another important factor for economic growth is electricity. Electricity plays an essential role in modern life, providing benefits and progress in various sectors such as transportation, manufacturing, mining and communication. Electricity is vital for economic growth and quality of life, not only because it increases productivity, but because it raises energy consumption, which increases exchange opportunities, thus increasing economic welfare (Blazquez-Fernandez, Cantarero, & Perez, Citation2014; Ciarreta & Zarriaga, Citation2007; Jumbe, Citation2004).
Concerning electricity, there are several studies that have established the relationship between energy consumption and economic growth. When a nation uses more energy, production increases, since the use of this energy to operate technology in manufacturing processes increases productivity. In some cases, the availability of electricity enables the incorporation of the above mentioned technology in processes (Acemoglu & Robinson, Citation2012; De la Fuente et al., Citation2013; Magazzino, Citation2014).
3. Econometric strategy
Productivity represents the conversion of the inputs of a process (labour and capital) into desirable outputs (sales, profits, etc.) (Solow, Citation1956). The term productivity is related to the efficient use of resources when producing a good, and can be defined as the relationship established between production and consumption of productive factors measured in physical units. In the input/output relationship, output can represent any established purpose or anything that the company generates, whereas input can be considered all that is consumed by achieving the output (Diéguez & González, Citation1994). Gronroos and Ojasalo (Citation2004) defined productivity as the degree of effective transformation of a process’ input resources into (i) economic results for the provider of goods/services and (ii) value for consumers.
Technical efficiency involves maximizing the level of output that can be obtained from a given combination of inputs, and indicates the degree of success in the use of productive resources. Therefore, inefficiency is the difference between the observed values of production and the maximum achievable values given a certain technology (Albert, Citation1998). According to the classic paper of Farrell (Citation1957), the level of efficiency of a company can be viewed from two different measures: (i) technical efficiency, which reflects the ability of a company to achieve maximum outputs depending on a set of inputs; and (ii) allocative efficiency, which reflects the ability of a firm to use inputs in optimal proportions, depending on their respective prices. These two measures are combined to measure economic efficiency (Battese & Coelli, Citation1992; Coelli, Rao, O’Donell, & Battese, Citation2005).
Economists typically use an enterprise production function to summarize technically efficient production methods available to each company.
The production function of a firm shows the maximum amount of output that can be obtained with a given number of factors, and shows the results of different technically efficient production methods (Nicholson, Citation1997).
The production frontier shows the maximum production level regarding technology and resource endowment, which provides the highest level of utility or satisfaction that can be reached, given the resource constrains. The relationship between inputs and output shows the opportunity costs relevant for the economy (Alvarez & Delgado, Citation2005; Nicholson, Citation1997).
As the production frontier is the limit of what is possible to produce given the factor endowment, any point situated beyond the boundary is unattainable, while those located inside the frontier represent inefficient situations characterized by idle resources.
There are two alternative methods for estimating production frontiers. One is the Data Envelopment Analysis, a deterministic and nonparametric method that eliminates production function assumptions. The other methodology is the Stochastic Frontier Method, which allows for random shocks even though two alternative production functions are used to estimate the frontier and efficiency ranking. The first method was used by Medved and Kavcic (Citation2012) in a study regarding efficiency in Croatian and Slovenian insurance markets.
The production frontier is modelled under two alternative production functions in the related literature (Aigner, Lovell, & Schmidt, Citation1977; Nicholson, Citation1997): the Cobb-Douglas function (Meeusen & van Den Broeck, Citation1977) and the trans-logarithmic function.
To determine the level or existence of technical inefficiency according to the production models used, a test of technical inefficiency was applied (Coelli, Prasada, & Battese, Citation1998; Kodde & Palm, Citation1986).
The selection of the functional form is important when estimating technical inefficiency (Tran & Tsionas, Citation2009). As in most frontier studies, the Cobb-Douglas model and the trans-logarithmic model are evaluated as a technological representation (De la Fuente, Berné, Pedraja, & Rojas, Citation2009). In most studies on the manufacturing sector, the trans-logarithmic model is the most popular due to its flexibility (Tran & Tsionas, Citation2009). The following are general forms of both models after linearization (EquationEqs. 1(1)
(1) and Equation2
(2)
(2) ):
[The Cobb-Douglas model]
[The trans-logarithmic model]
In both models, is the output of company i during period t;
and
are the inputs m and n of company i during period t;
is the random disturbance assumed as normally distributed, with a zero mean and constant variance; and
is a non-observable and non-negative random error associated with technical inefficiency.
4. Results
The present study applied the efficiency analysis to the 34 countries that currently belong to the OECD, using data from 2003-2012.
Efficiency is measured by utilizing the real GDP of each economy in U.S. dollars of 2012 as an output variable measured through purchasing power parity. Inputs are expressed by the following variables: labour, measured as the number of workers in each economy; savings, expressed as gross savings in U.S. dollars; capital, stated as gross capital formation in dollars; and finally, electricity consumption, which measures the production of power plants and cogeneration plants, minus losses in transmission, distribution and processing, plus the consumption of cogeneration plants, (expressed in kWh). The data from the output and input variables were obtained from the statistical database of the World Bank.
To measure the efficiency of OECD member countries, the first functional form used is the Cobb-Douglas, which is expressed as follows (EquationEq. 3(3)
(3) ):
(3)
(3)
where:
= Gross Domestic Product of country i, for period t.
= Number of occupied workers of the labour force in country i, for period t.
= National savings of country i, for period t.
= Gross capital formation of country i, for period t.
= Electricity consumption of country i, for period t.
while the second is functionally trans-logarithmic, and has the following form (Eq. 4):
(4)
(4)
where,
is the random disturbance assumed to be normally distributed, with a zero mean and constant variance; and
is a non-observable and non-negative random error associated with technical inefficiency.
The results of the maximum likelihood estimation of the previous Cobb-Douglas model are presented in . This table shows that, based on the total frontier deviation, 90.3% is due to technical inefficiency, with a technical efficiency that increases over time.
Table 1. Maximum likelihood estimates of technical efficiency, Cobb-Douglas model.
The results of the maximum likelihood estimation of the previous trans-logarithmic model are presented in . This table shows that, based on the total frontier deviation, 89.9% is due to technical inefficiency, with a technical efficiency that increases over time.
Table 2. Maximum likelihood estimates of technical efficiency translogarithmic model.
To determine whether or not technical inefficiency is present in the former models, the test of technical inefficiency (Kodde & Palm, Citation1986) was applied. For the Cobb-Douglas function, a likelihood ratio test of 303,605 was obtained with 3 restrictions, and had a critical value of 7.045 with 95% confidence. Therefore, the null hypothesis of no technical inefficiency was rejected, and technical inefficiency was found within the OECD countries.
Regarding the trans-log functional form, a likelihood ratio test of 405.74 was found with 3 restrictions. A critical value of 7.045 with a 95% confidence level was obtained. Thus, as in the Cobb-Douglas function, the null hypothesis of no technical inefficiency was rejected, and technical inefficiency was found within the OECD countries.
These results were used to determine which of the two functional forms better represented the data’s behaviour. The generalized likelihood ratio was used, and the null hypothesis indicated that the Cobb-Douglas was the appropriate functional form. The alternative hypothesis stated that the function would be better represented by the trans-log function.
With 10 degrees of freedom, given by the number of parameters in the second order trans-log function, the critical value was 18.31, which resulted in 0.577 according to the Chi-Square table with 95% confidence. This value does not reject the null hypothesis.
Although the most suitable functional form proved to be the Cobb-Douglas function, the efficiency ranking was calculated under both functional forms for comparative purposes ().
Table 3. Efficiency results for the OECD member countries (2003–2012).
According to the Cobb-Douglas functional form, the U.S.A had the highest level of efficiency, followed by the U.K., France, Italy and Germany. Iceland had lowest level of efficiency within the 34 economies.
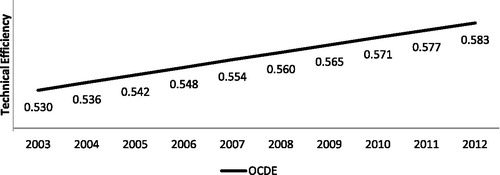
demonstrates the evolution of technical efficiency for OECD countries, as measured by the Cobb-Douglas functional form. A growing trend in efficiency was observed with an average efficiency of 55%. The minimum achieved efficiency was 53% and the maximum achieved efficiency was 58%.
Figure 1. Chart of the evolution of technical efficiency for the OECD member countries (2003–2012).
5. Discussion
Inefficiencies were detected in all OECD economies, implying that even advanced economies have room to grow. Nevertheless, average efficiency showed a strong positive trend, even in 2008 despite the Wall Street financial crisis that affected countries around the world.
One surprising result was the inefficiency found in Iceland’s economy. This could be explained by the economic crisis of 2008–2010 due to the collapse of its banking system, where the three largest banks in the country declared bankruptcy and their combined debt exceeded more than six times the country’s GDP (BBC News, Citation2009).
Luxembourg was the second most inefficient economy, although it had one of the highest incomes per capita. This could imply that income per capita measurements include bias in well-being.
In addition, Turkey lies in the middle of the ranking list even though it has faced institutional issues such as the coup d’état. Corruption, a variable related to institutions, does not appear to totally explain efficiency, considering that Mexico has a higher ranking than economies with less corruption, such as New Zealand. With that said, the top 15 economies in the ranking belong to countries that are perceived as having strong institutions.
Innovation is thought to be one of the variables that explain development. The top two economies enforce a strong protection of intellectual property rights and an agile patent system, such as the USA. Additionally, Great Britain is a leader in terms of innovation theory and advances in knowledge generation. Nevertheless, South Korea, one of the countries perceived as being very innovative, is ranked 19 of 34 countries. The same can be said about Ireland, whose strategy in recent years has also been strongly centred on innovation. This could imply that innovation and knowledge generation have an accumulative effect.
Germany is another interesting case. It is syndicated as having earned the most within the European Union, yet is the fourth most efficient of the European countries. By contrast, Great Britain is highlighted for its accomplishments in efficiency, although it may be leaving the EU in the short term.
In general, the results comply with the behaviour that was expected: that more advanced economies are more efficient than emerging economies, and that there are factors that must be further analysed, as some aspects had not been examined by previous empirical studies.
6. Conclusions
Technical efficiency is achieved when economies maximize output using all available inputs. Determining a country’s level of efficiency provides a valuable insight into economic behaviour, and enables comparisons to other economies. If countries are not using their resources properly, they can make adjustments to increase production and improve efficiency.
The results obtained in this study identified the OECD economies that have idle resources and compares their behaviour to other countries. Countries with lower efficiency rankings have a much greater potential for increasing productivity considering the current combination of productive factors.
Moreover, the study revealed that the top ten most efficient OECD countries are from North America and central Western Europe, as well as Australia and Japan. These results coincide with their relationship as trade partners. On the other hand, Latin American representatives occupy some of the lower rankings, such as Mexico (24) and Chile (28). Finally, countries with higher levels of efficiency have higher GDPs, and vice versa.
These results should influence public policies to focus on increasing the productivity and competitiveness of individual economies. In terms of the relevant literature, these results demonstrate an alternate method for analysing economic development. The results also provide investors and managers with a new mechanism for evaluating potential for investment, or for examining better business climates, which can influence public policies in other countries.
The objective of this study was to utilize the Stochastic Frontier Methodology to analyse economic performance, and a limitation of the analysis was only using traditional factors of production, labour and capital. However, a second stage of this study will assess other economic growth determinants to widen the scope of the present study. Also, other dependent variables that must be considered in future research are differences between income per capita and GDP, or alternative definitions to measure development growth rather than economic growth.
Future studies should apply the methodology to continental contexts, or regional blocks, i.e., measuring the efficiency of different economies in a continent or region, or to create a world efficiency ranking. It could also be applied to local contexts, measuring the efficiency of different regions/states of a country in order to determine which are the most efficient and to identify specific problems. Studies of this nature will help develop focused public policy, lay out specific conditions, and extend regional growth, in order to work toward more equal conditions and increased efficiency in every country.
Disclosure statement
No potential conflict of interest was reported by the authors.
References
- Acemoglu, D., & Robinson, J. A. (2012). Por qué fracasan los países. [Why countries fail.] Bogotá, Colombia: Editorial Planeta Colombiana.
- Acemoglu, D., & Robinson, J. A. (2015). The rise and decline of general laws of capitalism. Journal of Economic Perspectives, 29(1), 3–28. doi:10.1257/jep.29.1.3
- Acikgoz, S. & Mert, M. (2014). Sources of growth revisited: the importance of the nature of technological progress. Journal of Applied Economics, 17(1), 31–62.
- Aghion, P. & Howitt, P. (1992). A model of growth to creative destruction. Econometrica, 60(2), 323–351.
- Aigner, A., Lovell, C. A. K., & Schmidt, S. (1977). Formulation and estimation of stochastic production function models. Journal of Econometrics, 6(1), 21–37. doi:10.1016/0304-4076(77)90052-5
- Albert, M. G. (1998). The technical efficiency of the Spanish industry (in Spanish). Revista Española de Economía, 15, 67–84.
- Altinay, G., & Karagol, E. (2005). Electricity consumption and economic growth: evidence from Turkey. Energy Economics, 27(6), 849–856. doi:10.1016/j.eneco.2005.07.002
- Alvarez, I., & Delgado, M. J. (2005). Evaluación de la eficiencia técnica en los países miembro de la Unión Europea. [Evaluation of technical efficiency in the member countries of the European Union.]. Gestión de Políticas Públicas, 14(1), 107–128.
- Aragon-Mendoza, J., Pardo del Val, M., & Roig-Dobón, S. (2016). The influence of institutions development in venture creation decision: A cognitive view. Journal of Business Research, 69(11), 4941–4946. doi:10.1016/j.jbusres.2016.04.056
- Arrow, K. J. (1962). The economic implications of learning by doing. Review of Economic Studies, 29, 155–173.
- Barro, R. J. (1990). Government spending in a simple model of endogeneous growth. Journal of Political Economy, 98(5), S103–S125.
- Barro, R. J. (1999). Determinants of economic growth: implications of the global evidence for Chile. Cuadernos de Economía, 36(107), 443–478.
- Barro, R. J. (2003). Determinants of economic growth in a panel os countries. Annals of Economic and Finance, 4, 231–274.
- Battese, G. E., & Coelli, T. J. (1992). Frontier production functions, technical efficiency and panel data: With application to paddy farmers in India. Journal of Productivity Analysis, 3(1–2), 153–169. doi:10.1007/BF00158774
- BBC News. (2009). Waking up to reality in Iceland, BBC.co.uk. Retrieved from http://news.bbc.co.uk/1/hi/world/europe/7852275.stm
- Blazquez-Fernandez, C., Cantarero, D., & Perez, P. (2014). Disentangling the heterogeneous income elasticity and dynamics of health expenditure. Applied Economics, 46(16), 1839–1854. doi:10.1080/00036846.2014.887197
- Bodenstein, T., Faust, J., & Furness, M. (2017). European Union Development Policy: Collective action in times of global transformation and domestic crisis. [Special Issue]. Development Policy Review, 35(4), 441–453. doi:10.1111/dpr.12189
- Burnside, C. & Dollar, D. (2000). Aid policies and growth. American economic review, 90(4), 847–868.
- Cass, D. (1965). Optimun growth in an aggregative model of capital accumulation. The Review of economic studies, 32(3), 233–240.
- Chirwa, T., & Odhiambo, N. (2016). Macroeconomic determinants of economic growth: A review of international literature. South East European Journal of Economics and Business, 11(2), 33–47. doi:10.1515/jeb-2016-0009
- Ciarreta, A., & Zarriaga, A. (2007). Electricity consumption and economic growth: Evidence from Spain (BILTOKI Working Paper 2007.01). Departamento de Economía Aplicada III (Econometría y Estadística). Universidad del País Vasco, España. Retrieved from https://dialnet.unirioja.es/servlet/articulo?codigo=2226004.
- Coelli, T., Prasada, D. S., & Battese, G. (1998). An introduction to efficiency and productivity analysis. Boston, MA: Klumer Academic Publishers.
- Coelli, T., Rao, P., O’Donell, C., & Battese, G. (2005). An introduction to efficiency and productivity analysis. New York: Springer.
- Cojocaru, L., Falaris, E. M., Hoffman, S. D., & Miller, J. B. (2016). Financial system development and economic growth in transition economies: New empirical evidence from the CEE and CIS countries. Emerging Markets Finance and Trade, 52(1), 223–236. doi:10.1080/1540496X.2015.1013828
- Cole, J. (2004). Determinantes del crecimiento económico mundial. 1980-1999. [Determinants of global economic growth. 1980–1999]. Ciencias Económicas/San José, 24 (Enero-Junio 2004), 29–48.
- Dang, G., & Sui Pheng, L. (2015). Theories of economic development. In Infrastructure investments in developing economies (pp. 11–26). Singapore: Springer.
- De Gregorio, J. (2016). Financial integration, financial development and economic growth. Estudios Económicos/Santiago, 26(2), 137.
- De la Fuente, H., Berné, C., Pedraja, M., & Rojas, J. L. (2009). Analysis of technical efficiency and marketing productivity for a life insurance company (in Spanish). Revista Panorama Socioeconómico, 38, 44–59.
- De la Fuente, H., Vallina, A. M., & Pino, J. I. (2013). Análisis de los determinantes del desarrollo económico. Un estudio econométrico comparativo entre Chile y otros países de diferentes niveles de desarrollo. [Analysis of the determinants of economic development. A comparative econometric study between Chile and other countries of different levels of development]. Revista Horizontes Empresariales, 12(1), 38–52.
- Diéguez, J., & González, V. (1994). Precisions about the concepts of productivity, efficiency, effectiveness, performance and economy (in Spanish). Costos & Gestión, 12, 275–291.
- Dornbusch, R., Fischer, S., & Startz, R. (2004). Macroeconomía. Novena Edición. Madrid, España: McGraw-Hill.
- Easterly, W, and Wetzel, D. (1989). Policy determinants of growth: survey of theory and evidence (Policy Research Working Paper Series 343). The World Bank.
- Easterly, W. and Levine, R. (1997). Africa’s growth tragedy: policies and ethnic divisions. The Quaterly Journal of Economics, 112(4), 1203–1250. doi: 10.1162/003355300555466.
- Farrell, M. J. (1957). The measurement of productive efficiency. Journal of the Royal Statistical Society A, 120(3), 253–281. doi:10.2307/2343100
- Fernández-Serrano, J., Berbegal, V., Velasco, F., & Expósito, A. (2018). Efficient entrepreneurial culture: A cross-country analysis for developed countries. International Entrepreneurship and Management Journal, 14(1), 105–128. doi:10.1007/s11365-017-0440-0
- Fisher, S. (1992). Macroeconomic stability and growth. Cuadernos de Economía, 29(87), 171–186.
- Fouquet, R., & Broadberry, S. (2015). Seven centuries of European economic growth and decline. Journal of Economic Perspectives, 29(4), 227–244. doi:10.1257/jep.29.4.227
- Fuentes Solís, R., & Ferrada Rubio, S. (2016). Innovación Tecnológica en Empresas Chilenas: Un Estudio Empírico Basado en Patentes. Journal of Technology Management & Innovation, 11(4), 56–64. doi:10.4067/S0718-27242016000400008
- Furman, J. L., Porter, M. E., & Stern, S. (2002). The determinants of national innovative capacity. Research Policy, 31(6), 899–933. doi:10.1016/S0048-7333(01)00152-4
- González-Cruz, T., & Devece, C. (2018). Entrepreneurial innovation, judgment, and decision-making as a virtuous process. International Entrepreneurship and Management Journal, 14(2), 245–248. doi:10.1007/s11365-018-0510-y
- Gronroos, C., & Ojasalo, K. (2004). Service productivity: Towards a conceptualization of the transformation of inputs into economic results in services. Journal of Business Research, 57, 414–423.
- Grossman, G. & Helpman, E. (1991). Quality ladders and the theory of growth. The Review of Economic Studies, 58(1), 43–61.
- Gu, W., Qian, X., & Lu, J. (2018). Venture capital and entrepreneurship: A conceptual model and research suggestions. International Entrepreneurship and Management Journal, 14(1), 35–50. doi:10.1007/s11365-017-0463-6
- Haavio, M., Mendicino, C., & Punzi, M. T. (2014). Financial and economic downturns in OECD countries. Applied Economics Letters, 21(6), 407–412. doi:10.1080/13504851.2013.864025
- Hai, D. P., Roig-Dobón, S., & Sánchez-García, J. L. (2016). Innovative governance from public policy unities. Journal of Business Research, 69(4), 1524–1528. doi:10.1016/j.jbusres.2015.10.135
- Jones, C. I. (2015). Pareto and Piketty: The macroeconomics of top income and wealth inequality. Journal of Economic Perspectives, 29(1), 29–46. doi:10.1257/jep.29.1.29
- Jumbe, C. B. L. (2004). Cointegration and causality between electricity consumption and GDP: Empirical evidence from Malawi. Energy Economics, 26(1), 61–68. doi:10.1016/S0140-9883(03)00058-6
- Kerr, S. P., Kerr, W., Özden, Ç., & Parsons, C. (2016). Global talent flows. Journal of Economic Perspectives, 30(4), 83–106. doi:10.1257/jep.30.4.83
- Knight, M., Loyza, N., & Villanueva, D. (1993). Testing the neoclassical theory of economic growth: a panel data approch. Staff Papers (International Monetry Fund), 40(3), 512–541.
- Kodde, D. A., & Palm, F. C. (1986). Wald criteria for jointly testing equality and inequality restrictions. Econometrica, 54(5), 1243–1248. doi:10.2307/1912331
- Koopmans, T. (1965). On the concept of optimal growth. In The Econommetric approach to development planning (1st edn), North Holland, Amsterdam, 225–287.
- Lucas, R. E. Jr. (1988). On teh mechanics of economic development. Journal of Monetary Economics, 22, 3–42.
- Magazzino, C. (2014). Electricity demand, GDP and employment: Evidence from Italy. Frontiers in Energy, 8(1), 31–40. doi:10.1007/s11708-014-0296-8
- Mankiw, G. (2012). Principios de Economía 6ª Edición. Ciudad de México: Cengage Learning.
- Mankiw, N., Romer, D. & Weil, D. (1992). A Contribution to the Empirics of Economic Growth. Quarterly Journal of Economics, 407–437.
- Medved, D., & Kavcic, S. (2012). An empirical study of efficiency in Croatia and Slovenia insurance markets. Economic Research-Ekonomska Istraživanja, 25(1), 87–98. doi:10.1080/1331677X.2012.11517496
- Meeusen, W., & van Den Broeck, J. (1977). Efficiency estimation from Cobb-Douglas production functions with composed error. International Economic Review, 8(2), 435–444. doi:10.2307/2525757
- Nicholson, W. (1997). Teoría Microeconómica: Principios básicos y aplicaciones. [Microeconomic Theory: Principles and Applications]. (6th ed.). Madrid, España: Editorial McGraw-Hill.
- Peri, G. (2016). Immigrants, productivity, and labour markets. Journal of Economic Perspectives, 30(4), 3–29. doi:10.1257/jep.30.4.3
- Ramsey, F. P. (1928). A mathematical theory of saving. The economic Journal, 38(152), 543–559.
- Ranis, G., Stewart, F., & Ramire, A. (2000). Economic growth and human development. World Development, 28(2), 197–219. doi:10.1016/S0305-750X(99)00131-X
- Romer, Paul. (1986). Increasing Returns and Long-Run Growth. Journal of Political Economy, 94(5), 1002–1037.
- Sala-I-Martin, X., Doppelhofer, G., & Miller, R. I. (2004). Determinants of long-term growth: A Bayesian averaging of classical estimates (BACE) approach. American Economic Review, 94(4), 813–835. doi:10.1257/0002828042002570
- Sheshinski, E. (1967). Optimal accumulation with learning by doing. In S. Karl, (Ed.), Essays on the Theory of Optimal Economic Growth, Cambridge: MIT Press.
- Simionescu, M., Lazányi, K., Sopková, G., Dobeš, K., & Balcerzak, A. P. (2017). Determinants of economic growth in V4 countries and Romania. Journal of Competitiveness, 9(1), 103. doi:10.7441/joc.2017.01.07
- Solow, R. (1956). A contribution to the theory of economic growth. The Quarterly Journal of Economics, 70(1), 65–94. doi:10.2307/1884513
- Stiglitz, J. (2002). El Desarrollo no es sólo el crecimiento del PIB. [Development is not only GDP growth]. Iconos, 13, 72–86.
- Swan, T. W. (1956). Economic growth and capital accumulation. Economic Record, 32(2), 334–361. doi: 10.1111/j.1475-4932.1956.tb00434.x.
- Tran, K. C., & Tsionas, E. G. (2009). Estimation of nonparametric inefficiency effects stochastic frontier models with an application to British manufacturing. Economic Modelling, 26(5), 904–909. doi:10.1016/j.econmod.2009.02.011
- UNDP. (1990). Human development report 1990. New York: Oxford University Press. Retrieved from http://hdr.undp.org/sites/default/files/reports/219/hdr_1990_en_complete_nostats.pdf
- Uzawa, H. (1965). Optimum technical change in an aggregative model of economic growth. International economic review, 6(1), 18–31.
- Vergara, R. (2005). Productividad en Chile: Determinantes y Desempeño. [Productivity in Chile: Determinants and Performance]. (Working Paper 296). Instituto de Economía. Pontificia Universidad Católica de Chile. Retrieved from http://economia.uc.cl/wp-content/uploads/2015/01/dt_296.pdf