?Mathematical formulae have been encoded as MathML and are displayed in this HTML version using MathJax in order to improve their display. Uncheck the box to turn MathJax off. This feature requires Javascript. Click on a formula to zoom.
Abstract
We check on the short term if self-employment in Romania influences unemployment and vice versa. Age, education and gender characteristics treat both variables, and self-employment considers both cases with and without employees. The objective is to look at the job creation and unemployment reduction in quarterly variation during the 1999Q1–2017Q3 period. On autoregressive models, we apply the Toda and Yamamoto (1995) procedure, detailed by Giles (Citation2011), to assess for Granger Causality. We found for unemployment rates a push effect in the self-employment rate for adults and youth with low education level to self-employment without employees’ rate for adults and self-employment with employees’ rate for old adults. We establish a ‘Schumpeter’ effect for the adult with a low level of education self-employment to unemployment, for adults’ males with tertiary education and self-employed, and older adults self-employed without employees to unemployment. We conclude that unemployment work as an inclusion mechanism for some vulnerable groups but inefficient for others. Self-employment with employees is less diversified, indicating a high-risk aversion and low start-up effect. In general, the labour market presents a unidirectional flexibility effect.
1. Introduction
Both unemployment and entrepreneurship phenomena are subjects for public policies which involve significant budgets. Active Labour Market Policies (A.L.M.P.s) point to accelerate positive transitions towards employment. Entrepreneurship programs (E.S.I. funds) spend in new competitive economic sectors’ creation, with the purpose to create new jobs. The desirable scenario is that unemployment pushes the entrepreneurship increase, and the increase of the entrepreneurship causes unemployment decrease. ILO (Citation2019) points to the presence of ‘the phenomenon of labour market segmentation’ at the world scale. These separate submarkets or segments, distinguished by different characteristics and behavioural rules, shape various models (Jakstiene, Citation2010).
Self-employment/entrepreneurship has an ambiguous relationship with unemployment (Audretsch, Carree, & Thurik, Citation2001; Babaginda & Semasinghe, Citation2013). This relationship which is at the crossroads for many policies (Pinelli, Citation2015), is relevant for growth and job creation and unemployment reduction (Bokhari, Alothmany, & Magbool, Citation2012), presents interest for active measures like direct job creation and start-up incentives (E.U. Commission). This topic, which stirs debates caused by the concept of self-employed persons with or without employees, is blurred. There are many approaches: entrepreneurship (Babangida & Semasinghe, 2013; Bokhari et al., Citation2012), new firms start-ups, small business ownership, and innovators.
We build our empirical approach on the theories of necessity entrepreneurship (known in the literature also as a refugee effect) and wealth effect of entrepreneurship (also known as Schumpeter/entrepreneurial effect) in the abundant literature by, e.g., Cueto, Mayor, and Suárez (Citation2015), Dvouletý and Lukeš (Citation2016) or Dvouletý (Citation2017).
Our original contribution is the macro-econometric empirical analysis of the relationship between entrepreneurship and unemployment with the background of the labour market segmentation theory. Self-employment is defined by its typologies: self-employment with and without employees. The policy interest requests transparency for target groups defined by age, education and gender, and not only relevant labour market policies. The ‘age’ is relevant for the presence of the labour market, reflecting the labour resource and working age. Also, the youths represent the new entrants, adults the active ones, and older adults the exits groups. The education level (low, medium and high) reflects the skills and human quality profile. Gender (total, males and women) characteristics offer insights regarding working life balance, gender stereotypes, equality, and access to management. This study is not available for Romania.
The main research question is to check if self-employment in Romania influences unemployment and vice versa. The secondary research question is what is the best target group defined by age, education and gender, and its aggregation level to confirm the desirable scenario? The relationship exists between two hypotheses (unemployment-push and Schumpeter effect). The ‘refugee’ or ‘unemployment-push’ hypothesis (U.P.H.): a higher level of unemployment will have a positive lagged effect on start-up activities in a given spatial area. The ‘Schumpeter/entrepreneurial’ hypothesis (S.E.H.): a higher level of start-up activities will have a negative lagged effect on unemployment in a given spatial area.
2. State of the art
Literature is precious and shows ambiguous results. Both U.P.H. and S.H.E. theories are validated by Cole et al. Applied Spatial Durbin Model (S.D.M.). Audretsch et al. (Citation2001) analysed changes in unemployment and in the number of business owner. Audretsch, Carree, van Stel, and Thurik (Citation2005) and Thurik et al. (Citation2007) investigated the dynamic interrelationship between self-employment and unemployment rates. Faria, Cuestas, and Mourelle (Citation2008) performed Granger causality tests and STAR-EXT estimation for nine O.E.C.D. countries during 1972–2007 (using COMPENDIA database), and revealed a bidirectional and nonlinear relation between business creation and changes in unemployment. UPH theory was validated by Lash, Gundolf, and Kraus (Citation2007) for France, which provides strong support for unemployment as a key factor for entrepreneurship. Halicioglu and Yolac (Citation2015) revealed more comprehensive insights into the understanding of the refugee effect by applying the ‘technique of Pesaran et al. (Citation2001) approach to co-integration which presents non-spurious estimates’. Garba, Djafar, and Mansot (Citation2013) examined in Nigeria the influence of poverty, unemployment, and G.D.P. on entrepreneurship. S.H.E. theory is validated by Bokhari et al. (Citation2012) who analysed 31 selected countries during 2008–2010 with data from Global Entrepreneurship Monitor (G.E.M.). Dilankiev (Citation2014) found for Georgia the one-way relationship between entrepreneurship rate and unemployment rate. Verheul, van Stel, Thurik, and Urbano (Citation2006) examined the interrelations between self-employment and unemployment rates for Spain in the period 1972–2004 compared with the general pattern shaped by the 23 O.E.C.D. countries.
At the same time none of the UPH or SHE are validated by Szewczyk, Widera, and Parvi (Citation2013, p. 159), who examined the relationship between entrepreneurship and unemployment in Opolskie Voivodship. Babangida et al. (2013) exposed that ‘countries with high rate of entrepreneurial activity have a low rate of unemployment’. Baptista and Thurik (Citation2007) focused on the case of Portugal. Ghavidel et al. (Citation2011, p. 189) said the result of simultaneous equations as a panel of ‘data applied separately for developing and developed countries show Schumpeter effect is established as definite, but refugee effect is not clear’. Chen (Citation2014) estimated the V.A.R. model for entrepreneurship relations with economic growth and employment in Taiwan, using quarterly macro data from 1987 to 2012 and indicating that ‘economic growth might improve the aggregate employment situation in the short run (after one-quarter) but worsen after a longer period (two quarters later)’. Acs, Audretsch, Braunerhjelm, and Carlsson (Citation2012) provided empirical evidence to endogenous growth models, in that entrepreneurship is one mechanism facilitating the spillover of knowledge to research & development and human capital, thereby promoting economic growth.
A comprehensive image of the state of the arts is displayed in by authors, variables, validated hypothesis, method, and main results.
Table 1. Main developments of other authors regarding the relation between self-employment and unemployment.
3. Methodology
The research explores the medium-term association between self-employment person rates, with and without employees, and (I.L.O.) unemployment person rates from first quarter 1999 to third quarter 2017, with each time series counting 75 terms. We work with unit groups detailed by age, education level and gender, summing 84 variables and their respective time series. The ‘smallest type of unit group’ is with three digits for each characteristic, i.e., SE0RABH: the self-employment rate for the males without employees, persons between the ages 25- and 49-years-old, with a high level of education (See Appendix 1 for codification). The data source is the Eurostat Labour Force Survey (L.F.S.). According to E.U.-L.F.S. Methodology, ‘Self-employed persons are the ones who work in their own business, farm or professional practice’ to earn profit. L.F.S. defines ‘Unemployed persons as persons aged between 15–74 who were without work during the reference week, were currently available for work, and were either actively seeking work in the past four weeks or had already found a job to start within the next three months, according to the Commission Regulation (EC) No 1897/2000.’
Absolute macroeconomic indicators are as follows:
A – total active population [lfsq_agaed], methodological breaks in 2002Q1, 2003Q1, 2005Q1 and 2010Q1
SE – total self-employed population [lfsq_esgaed], time break in series in 2003Q1, 2005Q1, 2010Q1 and 2014Q1
SE1 – total self-employed with employees’ population [lfsq_esgaed]
SE0 – total self-employed without employees’ population [lfsq_esgaed]
UR – unemployment rate [lfsq_urgaed], time break in series in 2002Q1, 2003Q2, 2005Q1 and 2010Q1, 33 variables.
Self-employment rates result from the author’s calculus, considering the following:
SER – self-employed
(1)
(1)
SE1R – self-employment with employees’ rate, 11 variables
(2)
(2)
SE0R - self-employment without employees’ rate, 19 variables
(3)
(3)
Where: a – age class; g – gender; e – education level; Q – Quarter
Descriptive statistics have been made for the 84-time. In total, SER (M = 19.8%, SD = 1.484), SE1R (M = 1.2%, SD = 0.2) SE0R (M = 18.5%, SD = 1.491) and UR (M = 6.9%, Sd = 0.931)
Time series graphs were analysed the 84-time series.
Time series correlations were generated and analysed with respect to the following tables: SE0R [19 variable] and UR [33 variable], SE1R [11 variable] and UR [33 variable] and SER [23 variable], and UR [33 variable].
3.1. Procedure
Structural Analysis with V.A.R. Model is based on concept of causality, keeping in mind the idea that a cause cannot come after the effect.
The approach from the estimation of V.A.R. models to Granger-Causality tests involves the Toda and Yamamoto (Citation1995) model, following the Giles (Citation2011) procedure. We follow the steps, using data at the levels:
3.2. Unit root test
Check the time-series stationarity of the 84 V.A.R. equations results and apply A.D.F.: Augmented Dickey-Fuller Unit Root Test (‘EViews Help: Unit Root Testing’, Citationn.d.):
(4)
(4)
Where: xt are optional exogenous repressors which may consist of constant, or a constant and trend
ρ, δ are parameters to be estimated,
If, |ρ|≥1 is a nonstationary series; If, |ρ|<1 is a (trend-)stationary series.
εt are assumed to be white noise.
3.3. The maximum order of integration (m)
If there are two time-series and one is found to be I(1), and the other is I(2), then m = 2. If one is I(0) and the other is I(1), then m = 1, and so on (Giles, Citation2011).
3.4. Optimal lag selection (p)
Selection is based on significant usual information criteria’s at 5% level (L.R.: sequential modified L.R. test statistic; F.P.E.: Final prediction error; A.I.C.: Akaike information criterion; and/or S.C.: Schwarz information criterion).
3.5. Checking the VAR specification
Check there is no serial correlation in the residuals: V.A.R. Residual Serial Correlation L.M. Tests (52 V.A.R. equations). Null Hypothesis: no serial correlation at lag order h – Prob. The majority prob values are larger than 5% and there is no serial correlation at lag order 5 ‘more than half of p values >0.05, then no autocorrelation’ (Toda & Yamamoto, Citation1995), errors are independent (Pineiro-Chousa, Vizcaíno-González, & López-Carbarcos, Citation2016). We apply the L.M. test/EVIEWS 7 = V.A.R. Residual Serial Correlation L.M. Tests under the ‘Null Hypothesis: no serial correlation at lag order h.’
Checking the Stability (52 V.A.R. equations) Reports, and the inverse roots of the characteristic A.R. polynomial, see Lütkepohl (Citation1991). The estimated V.A.R. is stable (stationary) if all roots have modulus less than one and lie inside the unit circle. If the V.A.R. is not stable, certain results (such as impulse response standard errors) are not valid. There will be roots, which is the number of endogenous variables and is considered the largest lag. If you estimated a V.E.C. with cointegrating relations, roots should be equal to unity’ (Lütkepohl, Citation2005; Toda & Yamamoto, Citation1995).
3.6. Cointegration of the time-series
Checking is made using Johansen’s methodology. If there is a linear stationary combination between random non-stationary variables, then the combined variables are cointegrated (there is a common non-stationary dynamic). We select the unrestricted V.A.R. equations (Jula, Citation2011) and apply Johansen Cointegration test, in ‘V.A.R. model in the levels of the data, including an intercept in each equation’ (Giles, Citation2011), assuming that the variables are a short time associated only.
The EViews 7 software uses the Johansen Cointegration Test created in 1991 and performed on an VAR of order p (Quantitative Micro Software (Firm),), 2010):
(5)
(5)
Where: yt is a vector of non-stationary
I(1) variables is a vector of deterministic variables
εt is a vector of innovations
(6)
(6)
Where:
(7)
(7)
In this test, we ‘estimate Π matrix from unrestricted V.A.R. and test whether we can reject the restrictions implied by the reduced rank of Π’ (Quantitative Micro Software (Firm), Citation2010, p. 686).
3.7. Toda and Yamamoto Wald causality technique – Finalise V.A.R. models
This analysis allows us to investigate causation and direction of causality with an improved Wald approach (Toda & Yamamoto, Citation1995). This approach could be used regardless of the cointegration (Ahmed, Veinhardt, Streimikiene, & Fayyaz, Citation2017). We add in m additional lags of each of the variables into each of the equations [following Giles (Citation2011)] and Granger non-causality test results (52 V.A.R. equations), with the objective to fix the asymptotic. We test for Granger non-causality testing the hypothesis, in that the coefficients of (only) the first p lagged values of U.R. are zero in the S.E.R. equations type, using a standard Wald test. Then, we apply the standard Wald test for the coefficients of the lagged values of S.E.R. in the U.R. equations type.
Test for the absence of Granger causality by estimating the following V.A.R. model:
(8)
(8)
(9)
(9)
Then, testing H0: b1 = b2 = …. = bp = 0, against HA: 'Not H0', is a test that X does not Granger-cause Y.
Similarly, testing H0: d1 = d2 = …. = dp = 0, against HA: 'Not H0', is a test that Y does not Granger-cause X (source Giles, Citation2011).
The effects over time are estimated by the impulse response functions using Cholesky decomposition. Response to Cholesky One S.D. Innovations serve to evaluate the effects induced by various impacts on system variables (impulse response function). ‘Each variable is affected by its own innovations’, as well as by innovations in the other variables (Jula, Citation2011).
4. The Romania case – Entrepreneurship profile
We exploit the quarterly data from Labour for Survey for self-employment rates and unemployment rates (International labour Office methodology) during period 1999Q1–2017Q3 (75 observations). All the individual rates, self-employment, self-employment with employees, self-employment without employees and unemployment, are measured by target groups characteristics disaggregated at the lowest level (with age and education and gender) as well as by different aggregation level. We test with 84 variables corresponding to all potential target groups, detailed by 10 characteristics (five for age, three for education, and two for gender and counting). These time series data are conducted by 52 V.A.R. equations. We apply for each model the Toda and Yamamoto (Citation1995) procedure, as detailed by Giles (Citation2011). The main result is the 16 equations which validate the Granger Causality test and confirm the causal mechanisms (see Appendix 2).
Almost 57% of the target groups are analysed over 36 equations (covering 70% of the total equations) and confirm the ambiguous findings. The Romanian entrepreneurship duration of less than three years indicates a low level of success. The evidence for the studied periods indicates that promoting everyone to entrepreneurship (especially due to high rates of agriculture in Romania) may not make sense.
This conclusion is in line with the high rates of agriculture in Romania, which may not make sense. This conclusion is also in line with the early article by Shane (Citation2009) or the recent paper by Acs, Åstebro, Audretsch, and Robinson (Citation2016).
Romania is a developing country still with high employment in the agriculture sector. Our self-employment data are macro and do not exclude the self-employed person in agriculture. ‘The share of population self-employed in agriculture in total population self-employed’ [lfsa_esgan2] is 69% for Romania in 2016, lower by 6.3pp, compared to the level from 2008. This share is still very high compared with EU28 of 15.1% in 2016, lower by 3.8pp, compared to the 2008 level, but with a convergent decreasing trend. This gap is far too large and implies a limit in comparability on this criterion of entrepreneurship measurement!
Romania’s entrepreneurship profile covers sector NACE Rev. 2 (B-N excluding K64.2), as follows:
‘Birth rate of enterprises’ [tin00142] is 10.16% in 2014, increasing with 0.68pp, compared to the level from 2009 (the last minimum), and decreases sharply with 4.39pp compared to 2013;
‘Survival rate of new enterprises after two years’ [tin00142] was 64.1% in 2014, decreasing sharply from the last maximum of 122.58% in 2012, with a level very close to the minimum of the period 2008–2014 of 60.6% in 2010;
‘Death rate’ [tin00142] of enterprises is 9.35% in 2014, decreasing sharply with 11.34pp, compared to the maximum level of the period of 20.69 in 2009, and close to the level before the crises of 10.37% in 2008;
‘Number of births of enterprises in t’ [tin0170] was 70.7 thousand new enterprises in 2014, decreasing with 29.6 thousand new enterprises, compared to last maximum 2013, and increasing with 31.5 thousand new enterprises, compared to 2009. Increasing the number of new enterprises during 2008–2014 expresses a growing tendency of the quantity of entrepreneurship.
‘Number of deaths of enterprises in t’ [tin0170] was 65 thousand enterprises in 2014, below with 38 thousand compared to the maximum of the crises in 2009, but over with 12 thousand enterprises compared to 2008 level before the crises;
‘Number of enterprises newly born in t-2 having survived to t’ [tin0170] was approximately 51 thousand enterprises, over to the minimum level from 2010 and below with 4.7 thousand enterprises than the maximum level of the period from 2009;
‘Business churn’ [tin0170] decreased at the period minimum of 19.5% in 2014, lower with 10.7pp than the best level registered in 2009;
‘Employment share of enterprise births after one year’ [tin00142] was 3.74% in 2014, lower by 0.61pp, compared to the level from 2013 (last maximum), but increasing with 1.11pp, compared with the last minimum from 2009;
‘Number of persons employed in the population of enterprises newly born in t-2 having survived to t’ [tin0170] was 181.6 thousand employees in 2014, increasing with 2,000 employees, compared to 2012 (last maximum), and decreasing with 33.8 thousand employees, compared to the maximum of the period 2008–2014. The number of persons employed in enterprises that survived two years present a linear tendency of decreasing. In other words, new enterprises cannot create employment growth (after two years). This tendency indicates a low quality of entrepreneurship.
The entrepreneurship in Romania during 2008–2014 presents some worrying features regarding its medium-term survival success, pointing to 2013 as a crisis year. Paradoxically it is increasing its quantity, but is decreasing its hope of survival after two years, with business churn decreasing at its historical minimum. Also, it is a visible fact that entrepreneurship does not generate employment growth.
5. Result and discussion
The 84 variables selected for the self-employment and unemployment by the combined characteristics resulted in 52 V.A.R. equations. The methodological steps present the following results: The time-series stationarity diagnostic was made for each for each 84-time series. Maximum order of integration (m), optimal Lag Length (p), and the validated tests for the selection of Lag length criteria were calculated for 52 unrestricted V.A.R. equations (matched variable pairs by characteristics age, gender and education). V.A.R. specification was checked for no serial correlation in the residuals, and V.A.R. Residual Serial Correlation L.M. Tests for 52 V.A.R. equations.
The checked Stability and Cointegration test results were carried out for the 52 V.A.R. equations. The finalised V.A.R. models, were fulfilled through add in ‘m’ additional lags of each of the variables and into each of the equations and Granger non-causality test results for the 52 V.A.R. equations. The graphical representation of the 12 V.A.R. models that confirm U.P.H. effect and for the four V.A.R. models that confirm S.E.H. are in Appendix 3 and Appendix 4, respectively. Selection of these 16 V.A.R. specification models, for which C.G. relation is validated, are detailed in Appendix 2.
5.1. The U.P.H. valid in six V.A.R. models (Appendix 2) by the following groups
The persons between the ages of 15 and 72 years:
Model 12 [SER; UR] confirms G.C. with a weak relationship (p = 0.1): the unemployment rate increase causes a decrease of self-employment rate after five lags (15 months). The model presents 4/13 significant coefficients and eight coefficients > 0;
Model 1 [SE0R; UR] confirms G.C. with a strong relationship (p = 0.05) as the unemployment rate increase causes a decrease of self-employment without employees’ rate after five lags (15 months). The model presents 5/15 significant coefficients and eleven coefficients > 0;
The youth (the ages of 15 and 24 years) with a low level (ISCED 0–2, best equivalent to lower secondary education) of education group the model 3 [SERYL; URYL], which confirms G.C. with a strong relationship (p = 0.05), and the unemployment rate increase causes a decrease of self-employment rate after six lags (18 months);
The adult (the ages of 25 and 49 years) group
Model 2 [SERA; URA] (model 2) confirms G.C. with a strong relationship (p = 0.05), and the unemployment rate increase causes a decrease of self-employment rate after five lags (15 months);
Model 5 [SE0RA; URA] confirms G.C. with a strong relationship (p = 0.05), and the unemployment rate increases causes a decrease of self-employment without employees’ rate after nine lags (27 months);
The older adults (the ages of 50 and 64 years) group model 4 [SE1RO; URO] confirms G.C. with a strong relationship (p = 0.05), and the unemployment rate increase causes a decrease of self-employment with employees’ rate after three lags (12 months);
Models 6–11 have a robust G.C., one side, and unemployment push effect, but time series are not cointegrated. Then, we ‘have no cross-check on your causality results’ (Giles, Citation2011). In these models, are the following groups: the self-employed without employees with a medium level of education [SE0RM; URM], working-age (the ages of 15 and 64 years) self-employed without employees with a medium level of education [SE0RWM; URWM], adult self-employed with a medium level of education [SERAM; URAM], self-employed with a medium level of education [SERM; URM], self-employed with a medium level of education [SERWM; URWM], and males self-employed with a medium level of education [SERBM; URBM].
5.2. The S.E.H. valid in four V.A.R. models (Appendix 5.1, 5.2) by the groups
The adult groups:
Adults with a low level of education subgroup, the model 15 [URAL; SERAL], confirms G.C. with a strong relationship (p = 0.05), and the self-employed rate increase cause a decrease of unemployment rate after three lags (nine months). The model presents 3/9 significant coefficients and seven coefficients > 0;
Adults male’s subgroup: the model 16 [URAB; SE0RAB] confirms G.C. with a weak relationship (p = 0.1), and the self-employed without employee’s rate increases cause a decrease of unemployment rate after five lags (15 months). The model presents 3/13 significant coefficients and six coefficients > 0;
Adults males with a tertiary level of education subgroup:
Model 14 [URABH; SE0RABH] confirms G.C. with a strong relationship (p = 0.05), and the self-employed without employee’s rate increase causes a decrease of unemployment rate after three lags (nine months). The model presents 5/9 significant coefficients and five coefficients > 0;
Old adult group, the model 13 [URO; SE0RO], confirms G.C. with a strong relationship (p = 0.05), and the self-employed without employee’s rate increase cause a decrease of unemployment rate after seven lags (21 months); thereafter an increasing tendency is noticed. The model presents 5/17 significant coefficients and nine coefficients > 0.
We have reasonable evidence for eight V.A.R. models’ one-way G.C. relationship (). U.P.H. is valid for increasing in unemployment among the active population with effect in increasing duration of self-employment without employees for five lags. The same effect is applicable for self-employment of adults. In the case of youth with a low level of education, entrepreneurship success is longer with one lag. The greatest success of U.P.H. is assured in the case of adult groups in self-employment without employees for nine lags. It is remarkable that, only for old adults, the unemployment increase generates an increase of the self-employment among employees for three lags, which is the shortest span of all. This result indicates the active measures’ eligibility by age group mainly.
Figure 1. Dashboard of G.C. relationship valid between Self-employment and Unemployment in Romania during 1999Q1–2017Q3 period by different groups (segmented by age, education, and gender).
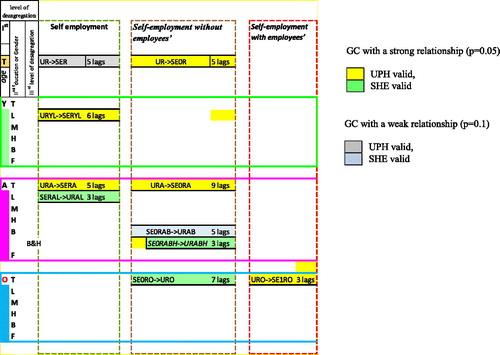
S.E.H. is valid for increasing the self-employment of adults with a low level of education and an effect on decreasing unemployment after three lags. The self-employment without employees of male adults with a high level of education generate unemployment decrease after three lags and after seven lags for old adults. This result indicates that self-employed male adults with tertiary education without employees have sooner effect on decreasing unemployment with four lags than old adults. Successful self-employment depends next on age, knowledge from education, or experience.
The short-run coefficients are partially statistically significant and mostly positive, revealing that short-term relationship between Unemployment rates and the Self–employment rate is ambiguous.
5.3. Discussion
Romania’s case indicates the U.P.H. validation predominantly for the relationship self-employment rate and the unemployment rate, especially for youth group with a low level of education and adults. These results are in line with Lash et al. (Citation2007) results for France. Halicioglua and Yolac (Citation2015) compared cases of Luxembourg, Greece and Portugal. Garba et al. (Citation2013) akin to the Nigeria case, and Verheul et al. (Citation2006) for the Spain case. The U.P.H. is valid in the case of the relationship self-employment without employees’ rate and the unemployment rate but not vice versa, in the case of the group of persons between the ages 15 and 72 years and adults. Indicate a possible link with A.L.M.P.s specific (new job creation, independent employment support, and so on). The highest chances of success are for adults, as individuals are able to develop new entrepreneurial behaviour in the sense of Kuckertz and Wagner (Citation2010). The U.P.H. valid in the case of the relationship self-employment with employees’ rate and the unemployment rate, but not vice versa, in the case of the group of old adults, who present a small duration (only three lags) and lack of circularity. The creation of the new jobs is far too diminished and with a short span of life.
The S.E.H. is valid in cases of adults (with a low level of education and males with a high level of education) and old adults’ groups exclusively on self-employment without employees. These results are in line with Dilankiev (Citation2014) and Ghavidel, Farjadi, Mohammadpour, and Cole (Citation2011).
These results indicate that Romania is on the route towards developed country but suffer on account of the lack of entrepreneurship medium- and long-term success, while lacking robust increase in self-employment with employees caused by unemployment. Innovation missing is one fundamental cause but also the lack of social and environment orientation of entrepreneurs.
The general economic environment, issued from the demography of enterprises indicators analysis, points that the entrepreneurship in Romania during 2008–2014 presents some worry. Paradoxically increasing its quantity but decreasing its hope of survival after two years, business churn is decreasing at its historical minimum. Also, in this short period, after the last crises are visible, the fact that entrepreneurship does not generate employment growth indicates low propensity to contribute to unemployment decrease.
Agriculture in Romania’s entrepreneurship profile is still relevant. The high E.U. 28 shares of self-employment in agriculture of 70% in total self-employment indicate a high probability the presence of Subsistence entrepreneurship (Baptista & Thurik, Citation2007), which was signaled in Portugal, Italy and Greece also.
The quality of Romanian entrepreneurship is in line with the Portugal model. Its large quantity is not according to condition, especially the innovation level in Romanian enterprises is the lowest in the E.U. This fact could explain the low levels of S.M.E.s survival rates, especially following the crises.
Romania, as a former communist country, has low-risk acceptance level, a fact reflected by low levels for persons looking for independent employment. The share of unemployed persons available to the independent job in total unemployment increased from 7% in 2014 to 13.3% in 2015.
In the context of the high rates of unemployment for youth in Romania (three times higher than the national rate), the youth unemployed persons aged between 15 and 24 years, which presents a new tendency of entrepreneurship acceptance as independent employment perspective but less intense compared with the adult unemployed persons. The share of young unemployed people available for self-employment in total unemployed aged between 15 and 24 years was 5.9% in 2014; this share almost doubled in 2015, reaching 9.4% (Pîrciog & Lincaru, Citation2017).
5.4. Limitations of the study
The model depends on time and presents only a short run causality as a result of the Toda-Yamamoto procedure application. This approach presents macroeconomic information invalidated by experts.
A coherent entrepreneurship definition is absent (Iversen, Jørgensen, & Malchow-Møller, Citation2008) which induces measurement errors of self-employment rates and lack of comparability.
Unemployment definition and measurement: We do not analyse the administrative unemployment, which forms a barrier in using the A.L.M.P. data: The presence of high deficits in unemployment measurement in 2014 (Pîrciog & Lincaru, Citation2017); the V.A.R. equation coefficients are not significantly caused by the multiple methodological breaks in series; the cultural model with its propensity to risk availability to assume in a market economy.
6. Conclusions and further developments
In Romania during 1999Q1–2017Q3, the relation between entrepreneurship/self-employment and unemployment is complex and still ambiguous. We find both relations are one way only and differentiated by groups.
The U.P.H. valid for A.L.M.P. mainly target the following groups: youth with a low level of education and for old adults. Unemployment causes self-employment in the case of active population and for adults for less than 18 months. Unemployment causes self-employment without employees for the active population for 15 months, and for adults for 27 months, employment is still specific to agriculture. Unemployment causes self-employment with employees only for old adults and for nine months – the shortest span.
The S.E.H. is valid for A.L.M.P. target groups and not only the following: adults with a low level of education, male adults with a high level of education, and old adults. Self-employment without employees cause unemployment (decrease) after nine months for the first group. Self-employment without employees cause unemployment decrease for the second group after nine months, and for the last group after 21 months. It proves that male adults with a high level of education are the best entrepreneurs.
On the contrary, women present an increasing tendency of low labour market performance, which is confirmed by the lack of causality.
Age is stronger versus gender, and the level of education is stronger than the experience.
Public policies for job creation are not effective in promoting success entrepreneurship in Romania.
6.1. Policy implications of our findings for Romania
Entrepreneurship unemployment relationship presents high relevance of this topic for A.L.M.P.’s and other public policies monitoring. The 1999Q1–2017Q3 results indicate a self-employment profile more than building entrepreneurs system, in the sense of Klein Woolthuis (Citation2010). However, the job creation process is not only reactive in terms of quantity but innovative in terms of quality. Innovation is the long-term ingredient for success. Albort-Morant, Henseler, Leal-Millán, and Leal-Millán (Citation2017) considered eco-innovation as an instrument to assure sustainable competitive advantages. Braunerhjelm, Acs, Audretsch, and Carlsson (Citation2010) and Audretsch, Braunerhjelm, and Carlsson (2012) considered entrepreneurship as ‘an important tool to enhance knowledge diffusion and promote economic growth’. Innovation adoption requests specific skills in flexible allocation. Human capital skills for innovation could be created through education and experience or attracted through occupational or geographical mobility. Labour market segmentation by groups (age, gender, and location) hinders this allocation. Grau Grau and Ramírez López (Citation2017) find relationship entrepreneurship with unemployment significant to the immigration inflows potential, fundamentally in the periods of economic crisis and recovery. The Granger test for developed OECD countries ‘confirms that causality goes in the direction from entrepreneurs to growth’. Șipoș-Gug and Bădulescu (Citation2013) find that entrepreneurship is not a Granger cause for GDP growth in Romania. Also, there is no evidence regarding entrepreneurship and knowledge diffusion in Romanian analysis.
Public policies to encourage individuals to become entrepreneurs request improvement in terms of motivation and effectiveness from policies that address other market failures (health assurances, S.T.E.M. education, and labour market reform) (Acs et al., Citation2016). Successful entrepreneurship needs to attract talents that have the interest to innovate, assuring business growth and fair taxpayers’ money investment.
6.2. Further research developments
This analysis could offer further improvement from the following perspectives: self-employment by the N.A.C.E. sectors (with and without agriculture); the quality of sustainable entrepreneurship (Belz & Binder, Citation2017; Dean, Citation2015); of labour market policies reforms (registered unemployment); of regional and local analysis; group typology, i.e., migrants.
A better view of the relation between self-employment and unemployment could substantially contribute to the proper public policies to drive to the expected results.
Additional information
Funding
References
- Acs, Z., Åstebro, T., Audretsch, D., & Robinson, D. T. (2016). Public policy to promote entrepreneurship: a call to arms. Small Business Economics, 47(1), 35–51.
- Acs, Z., Audretsch, D., Braunerhjelm, P., & Carlsson, B. (2012). Growth and entrepreneurship. Small Business Economics, 39(2), 289–300. doi:10.1007/s11187-010-9307-2,
- Ahmed, R. R., Veinhardt, J., Streimikiene, D., & Fayyaz, M. (2017). Multivariate Granger causality between macro variables and KSE 100 index: Evidence from Johansen cointegration and Toda & Yamamoto causality. Economic Research-Ekonomska Istraživanja, 30(1), 1497–1521. Retrieved from https://doi.org/10.1080/1331677X.2017.1340176 doi:10.1080/1331677X.2017.1340176
- Albort-Morant, G., Henseler, J., Leal-Millán, A., & Cepeda-Carrión, G. (2017). Mapping the field: A bibliometric analysis of green innovation. Sustainability, (9(6), 1011. doi:10.3390/su9061011
- Audretsch, D. B., Carree, M. A., & Thurik, R. (2001). Does self-employment reduce unemployment? Discussion paper T101-074/3 (Discussion paper TI01-074/3). Retrieved from https://pdfs.semanticscholar.org/7b33/3bfff107ca29fcff6bfbb491ab698324d735.pdf.
- Audretsch, D., Carree, M. A., van Stel, A., & Thurik, A. (2005). Does self-employment reduce unemployment? Papers on entrepreneurship, growth and public policy (#07/2005). Accessed June 2017 Retrieved from https://www.econstor.eu/obitstream/10419/19998/1/2005-07.pdf
- Babaginda, M. M., & Semasinghe, D. M. (2013). Entrepreneurship and unemployment: A literature review. International Conference on Business & Information. Accessed June 26, 2017, Retrieved from http://www.academia.edu/5322204/Entrepreneurship_and_Unemployment_A_Litrature_Review
- Baptista, R., & Thurik, A. (2007). The relationship between entrepreneurship and unemployment: Is Portugal an outlier?. Technological Forecasting & Social Change, Accessed July 2017 Retrieved from https://personal.eur.nl/thurik/Research/Articles/The%20relation%20between%20entrepreneurship%20and%20unemployment,%20is%20portugal%20an%20outlier.pdf
- Belz, F. M., & Binder, J. K. (2017). Sustainable entrepreneurship: A convergent process model. Business Strategy and the Environment, 26(1), 1–17. doi:10.1002/bse.1887
- Bokhari, A., Alothmany, N., & Magbool, S. S. (2012). Entrepreneurship and unemployment in the Kingdom of Saudi Arabia. Saudi Economy Conference: Challenges and Opportunities, Accessed August 2017. Retrieved from https://www.researchgate.net/profile/Nazeeh_Alothmany/publication/235751134_Entrepreneurship_and_Unemploymentin_The_Kingdom_of_Saudi_Arabia/links/0912f51319eda567ef000000/Entrepreneurship-and-Unemployment-in-The-Kingdom-of-Saudi-Arabia.p
- Braunerhjelm, P., Acs, Z. J., Audretsch, D. B., & Carlsson, B. (2010). The missing link: Knowledge diffusion and entrepreneurship in endogenous growth. Small Business Economics, 34(2), 105–125. doi:10.1007/s11187-009-9235-1
- Chen, C. (2014). Entrepreneurship, economic growth and employment: A case study of Taiwan. Hitotsubashi Journal of Economics, 55, 77–88. Accessed June 26, 2017. Retrieved from https://hermes-ir.lib.hit-u.ac.jp/rs/bitstream/10086/26817/1/HJeco0550100710.
- Cole, I. (2017). A spatial analysis of unemployment and entrepreneurship: Evidence from the mid-Atlantic region of the United States. Accessed June 26, 2017. Retrieved from http://www.calu.edu/academics/colleges/eberly/business-economics/working-paper-series/_files/ColeReviewofRegionalStudies.
- Cueto, B., Mayor, M., & Suárez, P. (2015). Entrepreneurship and unemployment in Spain: A regional analysis. Applied Economics Letters, 22(15), 1230–1235.
- Dănăcică, D. (2011). Causality between school education and economic growth in Romania. Argumenta Oeconomica No, 1 (26) 2011 PL ISSN 1233-5835, 2011. Accessed August 15, 2017, Retrieved from http://argumentaoeconomica.pl/dokumenty/26.2011/59_26.2011Argumenta_Oeconomica_26_2011.pdf
- Davidescu, A. (2015). Active ageing and shadow economy in Romania. An empirical causality analysis. Management Dynamics in the Knowledge Economy, 3(no. (2), 237–256. Accessed August 15, 2017, Retrieved from file:///G:/Cristina/Downloads/118-451-1-PB.pdf
- Davidescu, A. (2015). The relationship between shadow economy and unemployment rate. An ARDL causality analysis for the case of Romania. Romanian Statistical Review, (nr. 4). Accessed August 15, 2017, Retrieved from http://www.revistadestatistica.ro/wp-content/uploads/2015/09/RRS4_2015_A4.pdf
- Dean, T. J. (2015). Sustainability and entrepreneurship. In C. L. Cooper (Ed.), Wiley encyclopaedia of management (pp. 1–3). Chichester, UK: John Wiley & Sons, Ltd. https://doi.org/10.1002/9781118785317.weom030093
- Dilankiev, A. (2014). Relationship between entrepreneurship and unemployment: The case of Georgia. Journal of Social Sciences, 3. Retrieved June 26, 2017, from: http://oaji.net/articles/2016/2903-1455537612.pdf
- Dvouletý, O. (2017). Relationship between unemployment and entrepreneurship dynamics in the Czech Regions: A panel VAR approach. Acta Universitatis Agriculturae et Silviculturae Mendelianae Brunensis, 65(3), 987–995. doi:10.11118/actaun201765030987
- Dvouletý, O., & Lukeš, M. (2016). Review of empirical studies on self-employment out of unemployment: Do self-employment policies make a positive impact?. International Review of Entrepreneurship, 14(3), 361–376.
- EU Commission. (2017). Accessed June 26, 2017, Retrieved from http://ec.europa.eu/eurostat/web/labour-market/labour-market-policy.
- EViews Help: Unit Root Testing. (n.d.). Accessed February 16, 2019, from http://www.eviews.com/help/helpintro.html#page/content%2Fadvtimeser-Unit_Root_Testing.html%23ww184771.
- Faria, J., Cuestas, J., & Mourelle, E. ( (2008). ). Entrepreneurship and unemployment: A nonlinear bidirectional causality? Discussion Papers in Economics (No. 2008/6). Accessed July 13, 2017, Retrieved from https://www4.ntu.ac.uk/research/document_uploads/85416.pdf
- Garba, A. S., Djafar, F., & Mansot, S. (2013). Evidence of opportunity and necessity driven entrepreneurship in Nigeria. Journal of Entrepreneurship Management and Innovation (JEMI), 9(3). Accessed June 26, 2017, Retrieved from http://repozytorium.wsb-nlu.edu.pl/bitstream/handle/11199/7206/Garba%20Abubakar%20S.%20i%20in.,%20Evidence%20of%20Opportunity%20and%20Necessity%20Driven%20Entrepreneurship%20in%20Nigeria.pdf?sequence=1
- Ghavidel, S., Farjadi, G., Mohammadpour, A., & Cole, I. (2011). The relationship between entrepreneurship and unemployment in developed and developing countries. International Conference on Applied Economics – ICOAE 2011. Accessed June 26, 2017, Retrieved from http://www.calu.edu/academics/colleges/eberly/business-economics/working-paper-series/_files/ColeReviewofRegionalStudiesPaperA.pdf
- Ghavidel, S., Farjadi, G., & Mohammadpour, A. (2011). The relationship between entrepreneurship and unemployment in developed and developing countries. The International Journal of Economic Behavior, 1(1), 71–78.
- Giles, D. (2011). Testing for granger causality. Accessed June 18, 2017, Retrieved from http://davegiles.blogspot.ro/2011/04/testing-for-granger-causality.html.
- Grau Grau, A., & Ramírez López, F. (2017). Determinants of immigration in Europe. The relevance of life expectancy and environmental sustainability. Sustainability, 9, 1093. doi:10.3390/su9071093
- Halicioglu, F., & Yolac, S. (2015). Testing the impact of unemployment on self-employment: evidence from OECD countries. Procedia - Social and Behavioral Sciences, 195, 10–17. Retrieved from http://www.sciencedirect.com/science/article/pii/S187704281503640X
- ILO (2019). Labour market segmentation. Accessed February 14, 2019, Retrieved from https://www.ilo.org/global/topics/employment-security/labour-market-segmentation/lang–en/index.htm.
- Iversen, J., Jørgensen, R., & Malchow-Møller, N. (2008). Defining and measuring entrepreneurship. Foundations and Trends® in Entrepreneurship, 4(1), 1–63. doi:10.1561/0300000020
- Jakstiene, S. (2010). Labour market segmentation: Theoretical aspect. Ekonomika Ir Vadyba: Aktualijos Ir Perspektyvos, 4(20), 53–63. Accessed on February 14, 2019.
- Jula, D. (2011). Econometrie. Retrieved June 18, 2017, from: http://www.postdoc.acad.ro/data/files/ECONOMETRIE_-_prof.Jula.pdf.
- Klein Woolthuis, R. (2010). Sustainable entrepreneurship in the Dutch construction industry. Sustainability, 2(2), 505–523. doi:10.3390/su2020505
- Kuckertz, A., & Wagner, M. (2010). The influence of sustainability orientation on entrepreneurial intentions - Investigating the role of business experience. Journal of Business Venturing, 25(5), 524–539. doi:10.1016/j.jbusvent.2009.09.001
- Lash, F., Gundolf, K., & Kraus, S. (2007). The impact of unemployment on entrepreneurship: Empirical evidence from France. International Journal of Business Research, Retrieved June, 2017, from: http://www.freepatentsonline.com/article/International-Journal-Business-Research/178900190.html
- Lee, K.-W., Jung, W., & Han, S. (2017). Country selection model for sustainable construction businesses using hybrid of objective and subjective information. Sustainability, 9(5), 800. doi:10.3390/su9050800
- Lütkepohl, H. (1991). VAR processes with parameter constraints. In Introduction to Multiple Time Series Analysis (pp. 167–214). Berlin, Heidelberg: Springer.
- Lütkepohl, H. (2005). New introduction to multiple time series analysis. Berlin: Springer. Retrieved June 18, 2017, from: http://www.afriheritage.org/TTT/2%20New%20Introduction%20to%20Multiple%20Time%20Series%20Analysis.pdf
- Pesaran, M. H., Shin, Y., & Smith, R. J. (2001). Bounds testing approaches to the analysis of level relationships. Journal of Applied Econometrics, 16, 289–326.
- Pineiro-Chousa, J., Vizcaíno-González, M., & López-Carbarcos, M. (2016). Reputation, Game Theory and entrepreneurial sustainability. Sustainability, 8(11), 1196. doi:10.3390/su8111196
- Pinelli, M. (2015). Can entrepreneurship solve the youth unemployment crisis? Accessed June 26, 2017, from World Economic Forum. Retrieved from https://www.weforum.org/agenda/2015/09/can-entrepreneurship-solve-the-youth-unemployment-crisis/.
- Pîrciog, S. C., & Lincaru, C. (2017). Evaluarea eficienței și impactului Strategiei naționale de ocupare a forței de muncă 2014-2020 la jumătatea perioadei de implementare. INCSMPS, Labour market, Prognosis, Strategies. Bucharest: INCSMPS.
- Quantitative Micro Software (Firm). (2010). EViews 7: User’s guide II (Vol. II). Irvine CA: Quantitative Micro Software. Accessed from http://schwert.ssb.rochester.edu/a425/ev72.pdf
- Shane, S. (2009). Why encouraging more people to become entrepreneurs is bad public policy. Small Business Economics, 33(2), 141–149. doi:10.1007/s11187-009-9215-5
- Shepherd, D., & Patzelt, H. (2011). The new field of sustainable entrepreneurship: Studying entrepreneurial action linking ‘what is to be sustained’ with ‘what is to be developed. Entrepreneurship Theory and Practice, 35(1), 137–163. doi:10.1111/j.1540-6520.2010.00426.x
- Simionescu, M. (2015). Kalman filter or VAR models to predict unemployment rate in Romania?. Naše Gospodarstvo/Our Economy, 61(3), 3. doi:10.1515/ngoe-2015-0009
- Șipoș-Gug, S., & Bădulescu, A. (2013). Granger causality analysis of the relationship between gross domestic product, unemployment and entrepreneurial activity in Romania. In A. Bădulescu (Ed.), Emerging Markets Economics and Business. 4th Conference of Doctoral Students in Economic Sciences December 2013 (pp. 99–106). Oradea: University of Oradea Faculty of Economic Sciences. Accessed June, 26, 2017, Retrieved from http://steconomiceuoradea.ro/wp/wp-content/uploads/2011/09/Volumul-conferintei-doctoranzi-2013.pdf#page=99
- Szewczyk, M., Widera, K., & Parvi, R. (2013). The relationship between unemployment and entrepreneurship: A case of Opolskie Voivodship. Advanced Research in Scientific Areas, December 2–6, 2013. EDIS - Publishing Institution of the University of Zilina. file:///G:/Cristina/Downloads/The%20Relationship%20between%20.pdf.
- Thurik, A. R., Carree, M. A., van Stel, A. J., & Audretsch, D. B. (2007). Does self-employment reduce unemployment? Retrieved from http://ondernemerschap.panteia.nl/pdf-ez/h200709.pdf.
- Thurik, R. A., Carree, M. A., van Stel, A., & Audretsch, D. (2007). Does self-employment reduce?. Journal of Business Venturing, 23, H200709. Accessed June 26, 2017, Retrieved from http://ondernemerschap.panteia.nl/pdf-ez/h200709.pdf doi:10.1016/j.jbusvent.2008.01.007
- Toda, H. Y., & Yamamoto, T. (1995). Statistical inferences in vector autoregressions with possibly integrated processes. Journal of Econometrics, 66, 225–250. Retrieved from http://www.sciencedirect.com/science/article/pii/0304407694016168
- Verheul, I., van Stel, A., Thurik, R., & Urbano, D. (2006). The relationship between business ownership and unemployment in Spain: A matter of quantity or quality? Estudios de Economia Aplicada, 435–457. Retrieved from: file:///G:/Cristina/Downloads/Dialnet-TheRelationshipBetweenBussinesOwnershipAndUnemploy-2103737.pdf
Appendix 1.
Codification mechanism – example
Notations:
Ex. SE0RAFM – Women Self-Employment without employee’s Rate at adult age (25–49 years) with medium level of education
Appendix 2.
Granger Causality relationship validation
Granger Causality relationship validation
Appendix 3.
The graphical representation of the 12 V.A.R. models that confirm U.P.H. effect
The graphical representation of the variables used in the 12 V.A.R. models in which unemployment (U.R.) cause Granger Causality to self-employment (S.E.R.)

Appendix 4.
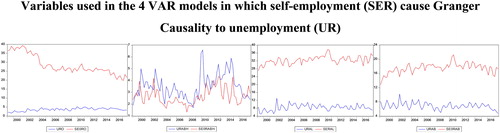
The graphical representation of the four V.A.R. models that confirm S.H.E.
The graphical representation of the variables used in the 12 V.A.R. models in which self-employment (S.E.R.) cause Granger Causality to unemployment (U.R.) (based on Appendix 2) S.E.R. cause C.G. to U.R.
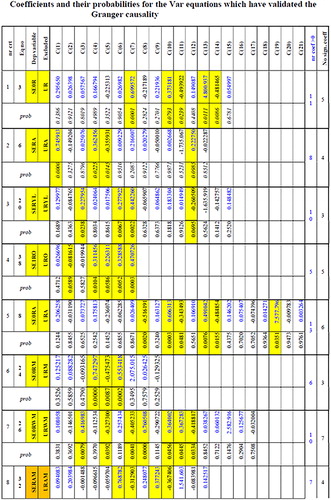
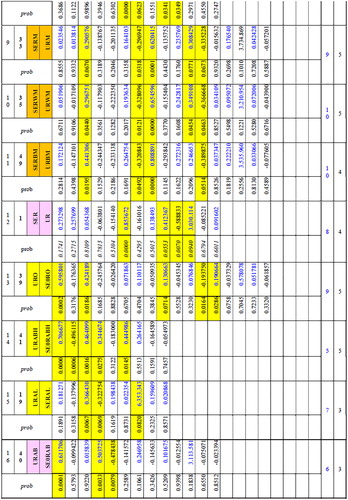
Appendix 5
Appendix 5.1. Coefficients and their probabilities for the V.A.R. equation which have validated the Ganger Causality (part 1)