
 ?Mathematical formulae have been encoded as MathML and are displayed in this HTML version using MathJax in order to improve their display. Uncheck the box to turn MathJax off. This feature requires Javascript. Click on a formula to zoom.
Abstract
A regression discontinuity design was applied to measure the short- and long-term policy effects of the air quality improvement plan implemented for the G20 Hangzhou summit. The analysis considered the effects across 11 prefecture-level cities in Zhejiang, China. Five meteorological indicators (temperature, humidity, pressure, wind speed and rainfall) were employed as control variables. Using these control variables, the short- and long-term policy effects were measured in terms of the changes in the air quality index (AQI) and pollutant concentrations (PM2.5, PM10, CO, SO2, NO2 and O3) 1 year and 2.5 years after policy implementation. The results reveal significant short- and long-term effects of the environmental plan on air quality improvement in cities in Zhejiang. The policy effects of the plan for the G20 summit were stronger in Hangzhou than in other prefecture-level cities. In Hangzhou, the short-term policy effects were stronger than the long-term effects, especially in terms of the decreasing AQI, PM2.5 and PM10 levels. Similar regulations should continue to be implemented for lasting improvements in regional air quality.
1. Introduction
Air pollution causes huge economic losses and creates health risks for people worldwide (Chang et al., Citation2014; Sun, Fang, & Sun, Citation2018). Governments have imposed long-term environmental regulations to control air pollution. However, these long-term environmental regulations do not always have satisfactory effects in terms of reducing air pollution (Zeng, Citation2018). For instance, the Chinese Ministry of Environmental Protection issued an air pollution prevention and control action plan (referred to in this study as the ‘plan’) in September 2013 to control further environmental degradation. This plan set more stringent thresholds for industrial waste gas emissions. However, most of industrial companies tend to prioritise economic revenue over environmental concerns (Christmann, Citation2004). The 2017 Statistical Bulletin of National Economic and Social Development also reported that only 29.3% of cities met the established air quality standards, whilst 70.7% of 338 monitored prefecture-level cities failed to meet the new strict air quality standards.
To resolve this dilemma, the Chinese government has adopted aggressive short-term regulations to achieve stringent pollutant reduction targets more effectively, especially before large-scale events in host regions. During large-scale international events such as the Beijing 2008 Olympic Games, the Expo 2010 Shanghai China and the APEC China 2014, the host cities (Beijing and Shanghai) implemented a series of short-term environmental regulations, including motor vehicle use restrictions, to ensure better air quality. Indirectly, these regulations could stimulate green innovation so that companies might pursue sustainable growth and create a better environment (Dangelico & Pujari,Citation2010; Kallmuenzer, Hora, & Peters, Citation2018).
Both policymakers and scholars have engaged in heated debate on whether short-term regulations such as motor vehicle use restrictions are necessary and whether such short-term regulations can continue to improve the environment. Various approaches have been proposed to investigate whether changes in subsequent environmental outcomes can be attributed to short-term environmental policies. Results have been reported for different short-term environmental regulations (He et al., Citation2016; Lu et al., Citation2018; Qi, Citation2014).
Most short-term regulations in China only involve the host city (i.e. they are single-city policies), although some short-term regulations do involve multiple cities. The G20 Hangzhou summit was held in September 2016 in Hangzhou, China. The local government issued an implementation plan for the prevention and control of air pollution in Zhejiang province (referred to in this study as the ‘G20 Hangzhou summit plan’ or the ‘plan’) on 1 July 2016 to ensure better air quality during the G20 summit. The G20 Hangzhou summit plan proposed a series of regulations to ensure air quality across the province of Zhejiang. Specifically, it stipulated 16 rectification tasks and proposed the closure of certain companies causing high levels of air pollution across all 11 prefecture-level cities, including Hangzhou. Some of the measures were more stringent for Hangzhou. Evaluating the policy effects of these short-term regulations involving multiple cities represents a new research direction and one that is worthy of investigation.
The air quality indicators for Hangzhou and some other cities in Zhejiang witnessed a sudden jump after the implementation of the G20 Hangzhou summit plan. This situation can be represented as a random experiment under realistic constraints between variables. The local randomness of a regression discontinuity design validates the model, which naturally excludes the influence of other unobserved variables and solves the endogeneity problems associated with ordinary least squares (OLS). A regression discontinuity design was applied to measure policy effects accurately. This approach was used to measure, for the first time, the short- and long-term policy effects of the G20 Hangzhou summit plan on multiple cities. The results might be important to evaluate whether these kinds of stringent short-term environmental regulations could be extended for longer periods.
The rest of the paper is organised as follows. Section 2 presents a literature review of policy effect measurement. Section 3 describes the theoretical basis of a regression discontinuity design. Section 3 also describes the data used in this study. Section 4 presents the results of the regression discontinuity design estimation for the short- and long-term policy effects of the G20 Hangzhou summit plan. Section 5 concludes and offers some closing remarks.
2. Literature review
There is strong evidence that evaluating the policy effects of environmental regulations is crucial to adjust and set future measures (Zhang, Chen, & Wen, Citation2012). Scholars have endeavoured to evaluate the policy effects of long- and short-term regulation policies worldwide. Because air condition improvement is typically a goal of society and government, most of the literature focuses on how environmental regulations alleviate regional air pollution.
Normally, air quality regulations directly affect air quality, but the strength of local supervision is also directly related to this effect (Henderson, Citation1996). Beijing was the first city in China to adopt short-term environmental regulations during the 2008 Olympic Games. Many studies have evaluated the policy effects of short-term regulations, reaching a range of conclusions. Chen, Jin, Kumar, and Shi (Citation2013), Chen, Ebenstein, Greenstone, and Li (Citation2013), and Zhang (Citation2016) applied a difference-in-difference model and the synthetic control method, respectively. They confirmed that a series of regulation measures during the Beijing 2008 Olympic Games led to a significant but temporary improvement in air quality in Beijing. Cao, Wang, and Zhong (Citation2014) used a regression discontinuity design and found that both the ‘single and even number limit’ policy during the Beijing 2008 Olympic Games and the later ‘tail number limit’ policy had modest effects on air quality improvement when endogeneity was removed.
Regarding other environmental regulations in different cities in China, Li et al. (Citation2012) concluded that air quality improved during the 2010 Asian Games in Guangzhou. The total effect of this air quality improvement was due to the combined influence of good meteorological conditions (cold air) and government regulations on emissions reductions. Li and Cao (Citation2017) observed that central heating measures at the beginning of the period directly and significantly increased the concentration of a variety of pollutants, whereas central heating measures at the end of the period did not lead to significant discontinuous changes in northern China.
Internationally, studies have shown that not all environmental regulations are effective. When such regulations only apply to new cars, Kathuria (Citation2002) showed that a ban on leaded petrol and commercial vehicles does not improve air quality. Citing other objective factors and a short period of traffic control measures, Davis (Citation2008) found that air quality does not improve. Traffic control measures aggravate air pollution because of stronger negative crowding out effects during the unregulated period. By investigating air quality changes in a given region, Firdaus and Ahmad (Citation2011) found that environmental regulations cannot effectively reduce the current situation of regional air pollution.
There is scant literature on the air quality effects of the regulations brought in prior to the G20 Hangzhou summit. Research on these regulations has predominantly used descriptive analysis, time-series analysis of pollutant concentration and meteorological analysis. Zhao, Luo, Zhen, and Liu (Citation2017) concluded that the concentration of nitrogen dioxide in Hangzhou during the G20 summit decreased because of the decrease in motor vehicle emissions, whilst the concentration of other air quality indicators increased due to adverse meteorological factors rather than the G20-motivated measures. The literature provides inconsistent conclusions on whether the environmental regulations brought in for multiple cities prior to the G20 summit improved air quality. Further exploration of the policy effects of these environmental regulations is necessary to provide robust, statistically significant evidence that can aid future decision making.
Given the measurement approach in the literature, a regression discontinuity design is a widely employed quasi-experimental research method to study the treatment effect in social, behavioural and related sciences (Thistlethwaite & Campbell, Citation1960; Imbens & Lemieux, Citation2008; Lee & Lemieux, Citation2010; Gagliardi & Percoco, Citation2017; Chen et al., Citation2018). Many studies have applied regression discontinuity designs to evaluate the policy effects of environmental regulations (Xi & Liang, Citation2015; Sun, Citation2017). Regression discontinuity designs effectively overcome the endogeneity problems that plague OLS analysis. Units are assigned to treatments based on whether the observed covariate is above or below a known threshold. The conditional probability of receiving treatment (conditional on this covariate) jumps discontinuously at the threshold (Calonico, Cattaneo, & Titiunik, Citation2015). The main assumption with this method is that, near the threshold, only policy variables change significantly, whilst other factors change continuously. Thus, regression discontinuity designs have the characteristics of a ‘local random experiment’ and remove endogeneity. They therefore offer an effective, robust approach for evaluating the effects of regulations.
The environmental regulations were introduced for multiple cities prior to the G20 Hangzhou summit. Highly polluting enterprises were closed immediately to improve air quality with maximum efficiency. We assume that the air quality in Zhejiang province, especially in Hangzhou, suddenly improved after implementation of this G20 Hangzhou summit plan. The assumption coincides with the basic idea of regression discontinuity designs. Therefore, we applied a regression discontinuity design to identify the short- and long-term policy effects of the G20 Hangzhou summit plan on air quality improvement in 11 prefecture-level cities across Zhejiang. By distinguishing the effects of processing variables from other continuously changing variables, we aimed to identify the local average treatment effect (LATE) near the threshold. We thus sought to measure both the short- and long-term policy effects of the regulations implemented for the G20 Hangzhou summit.
3. Regression discontinuity design and data illustration
The regression discontinuity method was introduced by Thistlethwaite and Campbell (Citation1960). It began to be widely applied to economic research in the late 1990s. By enabling causal inference between variables, regression discontinuity offers a good alternative to randomised controlled trials, which are traditionally the optimal solution for endogeneity (Imbens, Citation2010). However, ethical concerns and high administrative costs mean that randomised controlled trials are seldom used in social policy contexts. Hence, economists often resort to quasi-experimental designs for impact evaluations (Qin, Zhuang, & Yang, Citation2017). Of the other common methods, such as difference-in-difference and matching techniques, regression discontinuity designs are deemed the close relations of randomised controlled trials with the greatest internal validity of the alternative quasi-experimental estimators (Lee & Lemieux, Citation2010; Qin et al., Citation2017).
3.1. Regression discontinuity designs
There are two types of regression discontinuity designs. The first one is based on sharp regression discontinuity. In sharp regression discontinuity design, the probability that an individual receives a treatment jumps from 0 to 1 at the cutoff (i.e. at the threshold x = c). The second type is based on fuzzy regression discontinuity. In this type of design, at the threshold x = c, the probability that an individual receives a treatment increases discontinuously from a to b (where 0 < a < b < 1). The implementation of the G20 Hangzhou summit plan was the treatment variable in this study. On the date of implementation (1 July 2016), the regulations were implemented simultaneously in each of the prefecture-level cities in Zhejiang province, and the treatment variable changed significantly. After the implementation, the treatment variable stayed constant. This situation suggests that sharp regression discontinuity fits our study.
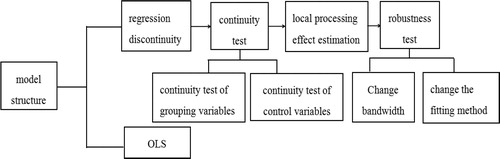
To check the assumption of sharp regression discontinuity for variables other than the implementation of the environmental regulations, we first tested whether the other control factors (influencing factors) underwent continuous changes in the short- and long-term periods. If some other influencing factors also jumped, the effects measured with a regression discontinuity design would capture the combined effect of the G20-motivated environmental regulations and these other influencing factors. Otherwise, the sudden change in the air quality in 11 prefecture-level cities in Zhejiang could be considered to be due to the implementation of these environmental regulations. Second, we conducted the robustness test with changes in both bandwidth and fitting method to provide solid conclusions. The modelling for the regression discontinuity design is presented in .
Figure 1. Modelling of regression discontinuity design. Source: The figure is created by authors.
Consistent with the literature, our study used the sharp regression discontinuity framework to estimate the local average treatment effect (LATE) of environmental regulations brought in for the G20 summit on air quality. The air quality index (AQI) and the concentration of six pollutants (PM2.5, PM10, CO, SO2, NO2 and O3) are the accepted core indices to measure changes in a region’s air quality. The AQI and the concentrations of various pollutants were used as explained variables. The treatment variable (i.e. the G20 Hangzhou summit plan) was used as the explanatory variable. Meteorological conditions are considered to affect air quality significantly. Thus, to measure policy effects accurately, meteorological variables were included as control variables. Before further quantitative measurement, a dummy variable, Dt, to represent the G20-motivated policies was defined:
(1)
(1)
Following the steps for modelling using regression discontinuity designs, we first applied OLS to estimate whether the regulation policy and meteorological variables affected pollutant concentrations. The formula is presented in EquationEquation 2(2)
(2) :
(2)
(2)
Here, yt is the weekly air quality index (AQI) or concentration of pollutants in each city in Zhejiang in week t. The week including 1 January 2016 was taken as the first week (t = 1) in our study. The term Dt refers to the treatment variable of the environmental regulations brought in for the G20 Hangzhou summit. The term Xt is a set of meteorological control variables, including weekly average temperature, weekly average humidity, weekly average air pressure and weekly average wind speed. Finally, εt is the random error term.
In this OLS regression equation, the coefficient β reflects the policy effects of the G20-motivated environmental plan on air quality regulations. After controlling for other control variables, the consistent estimation of coefficient β requires independence between Xt, the non-observable element εt and the policy variable Dt. However, the requirements usually encounter difficulties because the concentration of pollutants tends to increase vertical diffusion on hot, sunny days, whereas the concentration of pollutants tends to decrease vertical diffusion on cold, rainy days. The OLS cannot escape the dilemma of violating independence assumptions and missing key variables. The dilemma usually causes biased regression results and endogeneity problems.
Regression discontinuity assumes that the sample data are randomly distributed around the threshold and that the unobserved characteristics of these samples have non-significant differences. Thus, the regression discontinuity model can solve the issues of missing variables and endogeneity, ultimately yielding more accurate estimates. In our study, the regression discontinuity model is given by EquationEquation 3(3)
(3) :
(3)
(3)
Here, yt, Dt, Xt and εt are the same AQI, treatment variable, meteorological control variables and random error term as in EquationEquation 2(2)
(2) . In addition, f(t – c) is a non-parametric function of the tth week in a prefecture-level city in Zhejiang. Also, c equals to 25 in the long-term period from January 2014 to December 2018 because the implementation date of the G20 Hangzhou summit plan (1 July 2016) was the 25th week of the sample period. A similar value of c can be obtained for the short-term period from July 2015 to June 2017. The interactive item Dtf(t – c) is included because the regression slope coefficients vary on both sides of the threshold. To obtain an accurate measurement, the standard deviation was corrected for heteroscedasticity.
In EquationEquation 3(3)
(3) , β measures the policy effect of the G20 Hangzhou summit plan for air quality improvement. As mentioned in the modelling process of a regression discontinuity design (), the sample data should satisfy both the continuity assumption and the local randomisation assumption for further empirical analysis.
The continuity assumption means that, besides the sudden change due to the environmental regulations brought in for the G20 summit, the consistent estimation of β requires other control variables to change continuously before and after the implementation of the regulations. The local randomisation assumption means that the sample data around the threshold are required to act approximately like a completely randomised experiment.
There are numerous data-driven local-polynomial and partitioning-based inference procedures for regression discontinuity designs. Inference in regression discontinuity designs is typically made using only observations near the threshold, where the discontinuous change in the probability of treatment assignment occurs. Because of its local nature, regression discontinuity uses average treatment effect estimators that are usually constructed using local-polynomial non-parametric regression. Statistical inference is based on large sample approximations. The results can help provide a reference for similar actions in the future and show how to improve air quality in the long run.
3.2. Data illustration and descriptive analysis
The data on air quality and meteorological conditions were collected for the short- and long-term periods. The short-term period refers to the 2-year period from July 2015 to June 2017, which includes a 1-year period after policy implementation; the long-term period refers to the 5-year period from January 2014 to December 2018, which includes 2.5-year period after policy implementation. As discussed, the study used seven indicators (AQI, PM2.5, PM10, CO, SO2, NO2 and O3), as well as meteorological control variables, to explain air quality in 11 prefecture-level cities in Zhejiang province. The 11 prefecture-level cities are Hangzhou, Ningbo, Jiaxing, Shaoxing, Wenzhou, Quzhou, Huzhou, Taizhou, Zhoushan, Jinhua and Lishui.
The indicators are weekly air quality index (AQI), fine particles (PM2.5), inhalable particles (PM10), sulphur dioxide (SO2), carbon monoxide (CO), nitrogen dioxide (NO2) and Ozone (O3). These indicators reflect seven air pollutant concentrations in 11 prefecture-level cities in Zhejiang province. The AQI index is a dimensionless index of overall air quality. It ranges from 0 to 500. Higher values of AQI denote worse air quality. The unit of CO is mg/m3, and the unit of all other indices is μg/m3. The historical data of the air quality indicators were collected from the online platform of the Chinese Air Quality Monitoring and Analysis platform (https://www.aqistudy.cn/historydata/).
Research in environmental science has confirmed that weather conditions significantly affect the diffusion of pollutants. Favourable weather conditions are significant in the diffusion of pollutants and in improving air quality. Therefore, our study also included meteorological elements as control variables. The detailed meteorological control variables are daily average temperature (°C), daily average humidity (%), daily average precipitation (mm), daily average wind speed (m/s) and daily average air pressure (hPa). These variables were chosen based on research by Li and Cao (Citation2017). The meteorological data were collected from Weather Underground (https://www.wunderground.com/). The raw data were reported in daily values. However, air quality tends to fluctuate because of other unstable conditions. Therefore, we adjusted and recalculated the weekly data on the air quality variables and meteorological variables to avoid seasonality. The detailed air quality indicators and control indicators are presented in .
Table 1. Selected indicators and study period.
The basic institutional background of the regression discontinuity application in this study is that Zhejiang province formally implemented its environmental plan on 1 July 2016. The treatment variable (policy dummy variable) jumped on 1 July 2016. Thus, 1 July 2016 was the threshold of dummy regulation variable Dt. The value of the regulation dummy variable depending on the segmented period is presented in . Depending on the regulation implementation breakpoint, the dummy variable took the value 0 before 1 July 2016 and 1 after 1 July 2016. This definition is consistent with the variable definition of Dt in EquationEquation 1(1)
(1) .
Table 2. Regulation time for short- and long-term periods.
Hangzhou was the host city of the G20 summit and is the capital of Zhejiang province. Therefore, the regulation strength in Hangzhou was stronger than in other prefecture-level cities in Zhejiang. Observing the air condition fluctuation across different cities in Zhejiang reveals that the changing trends were similar. presents the descriptive statistics of various quality indicators (AQI and pollutants) in Hangzhou during a 2-year period (July 2015 to June 2017) and a 5-year period (January 2014 to December 2018). These data offer an example to illustrate the air quality in different cities in Zhejiang before and after the G20-motivated environmental plan was implemented.
Table 3. Mean levels of air quality indicators during long-term period in Hangzhou.
Besides the average levels of various air quality indicators in each period, the relative growth rates of each air quality indicator in Hangzhou in light of the regulations are provided. The data in show that the air quality index (AQI) and most of the pollutant concentrations (PM2.5, PM10, SO2, CO and NO2) in Hangzhou decreased after the implementation of the regulations. Specifically, the levels of SO2, PM2.5, PM10, AQI and NO2 decreased by 40.75%, 31.61%, 26.42%, 10.42% and 10.17%, respectively. The average temperature and rainfall increased by 13.83% and decreased by 6.97%, respectively. According to the literature, rising temperatures and falling rainfall levels tend to increase the concentration of various pollutants. The results (decreasing levels of pollutants) indicate that the air quality in Hangzhou improved after the implementation of the environmental plan.
The descriptive statistics of related indicators for the other 10 prefecture-level cities (Ningbo, Jiaxing, Shaoxing, Wenzhou, Quzhou, Huzhou, Taizhou, Zhoushan, Jinhua and Lishui) in Zhejiang province were similarly obtained. All descriptive statistics show that the air quality index (AQI) and most of the pollutant concentrations decreased after the implementation of the environmental plan on 1 July 2016. These results intuitively confirm that air quality improved after the implementation of the G20-motivated environmental regulations in Zhejiang province.
4. Empirical results of policy effects
4.1. Long-term policy effects
4.1.1. Results of OLS
We first present the estimation results of OLS regression analysis. displays the OLS results for the 11 prefecture-level cities in Zhejiang province over the long-term period. The OLS regression method confirms the effect of the G20 Hangzhou summit environmental plan on air quality indicators (AQI and concentrations of various pollutants), controlling for the influence of meteorological factors.
Table 4. OLS regression estimates of long-term policy effects of G20 Hangzhou summit plan.
After implementing the aforementioned plan, some heavily polluting companies were closed, and many others were forced to close during the emergency period. The estimated coefficients are mostly negative for the air quality indicators for all cities. This result indicates that without considering meteorological factors, the regulation plan had different effects in different prefecture-level cities. It also had overall controlling effects on AQI and air pollutant concentrations across Zhejiang province. Unlike for NO2 and O3, the weekly average AQI and pollutant concentrations of PM2.5, PM10 and SO2 all decreased significantly in Hangzhou after the implementation of the environmental plan (significance level of 10%). The effects of the regulations decreased the AQI and all pollutant concentrations in Ningbo, Wenzhou and Taizhou.
However, air quality was affected by meteorological factors. As mentioned, OLS estimation using the approach shown in may lead to biased results and endogeneity. Therefore, we applied a regression discontinuity design to measure the policy effects of the plan on air quality. The potential problems (e.g. estimation bias) associated with endogeneity justify the use of quasi-experimental estimation methods such as regression discontinuity designs.
4.1.2. Long-term policy effects using a regression discontinuity approach
In the regression discontinuity framework, several key assumptions are necessary to draw causal inference between the treatment variable and the outcome variable (Nichols, 2007). Therefore, ensuring the validity of our results by testing whether each assumption holds is essential (Qin et al., Citation2017). The first assumption of regression discontinuity designs is that the outcome and treatment variables both jump discontinuously at the cutoff of the assignment variable.
First, we conducted the continuity test of grouping variables. Regression discontinuity can overcome the issues of missing variables because it is based on the assumption that the sample points near the threshold are randomly distributed. However, if the grouping rules are known in advance, and the grouping variables can be fully controlled, researchers can choose to enter the treatment group or control group freely. This situation leads to regression discontinuity failure because of endogenous grouping near the threshold. In other words, the assumption is that the grouping variable t has a density function f(t) and that the function is discontinuous at the threshold t = c. If the left limit of the function is not equal to the right limit, the local randomisation hypothesis will no longer be satisfied, and the regression discontinuity design strategy will fail.
As per the modelling steps illustrated in , it is necessary to test the endogenous grouping issue before using a regression discontinuity design. McCrary (Citation2008) proposed a non-parametric density function (given in EquationEquation 4(4)
(4) ) to test the continuity assumption H0:
(4)
(4)
We tested the continuity of grouped variables for 11 prefecture-level cities in Zhejiang province. shows the estimated parameters for the 11 cities based on the sample data for the period January 2014 to December 2018.
Table 5. Continuity test of grouped variables for 11 cities in Zhejiang (January 2014 to December 2018).
The data in confirm the original hypothesis that the density function is continuous at c for all cities. The sample points near the breakpoint are randomly distributed rather than having endogenous grouping. Thus, regression discontinuity is effective. Therefore, regression discontinuity is valid, and the study can be carried out using a regression discontinuity design to measure the policy effects of G20 Hangzhou summit environmental plan for 11 prefecture-level cities in Zhejiang, China.
Second, we conducted the continuity test of control variables. We ensured that the outcome and treatment variables were both continuous functions of the control variables in the absence of the policy treatment. The meteorological variables (average temperature, average humidity, average air pressure, average wind speed and average rainfall) were included in the model as control variables. To determine whether the hypothesis was valid, the meteorological variables for the period January 2014 to December 2018 were estimated by regression discontinuity design. The results are shown in . To determine whether the meteorological control variables experienced continuous changes during the whole implementation period, we included meteorological variables as dependent variables and conducted the regression discontinuity estimation as described by EquationEquation 3(3)
(3) .
Table 6. Meteorological control variables for 11 cities (January 2014 to December 2018).
To verify this assumption, we tested whether there were other extraneous discontinuities in the outcome and treatment variables away from the presumed breakpoint (1 July 2016). We therefore ran the same regression discontinuity for some other hypothetical breakpoints at the boundary of July 2016. Except for the rainfall indicator, all meteorological variables were non-significant. The outcome and treatment variables in are generally continuous at the alternative points, which diagnostically verifies the continuity assumption.
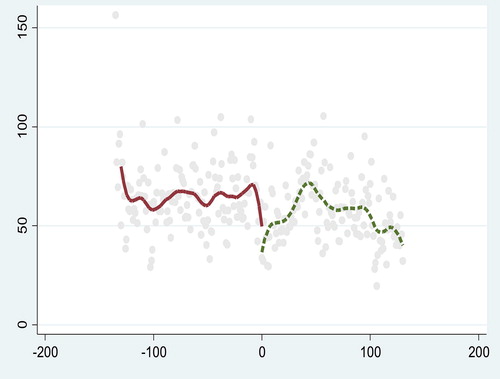
show the scatter and threshold diagrams of the air quality indices for Hangzhou, Ningbo, Wenzhou and Zhoushan before and after the implementation of the G20 Hangzhou summit environmental plan. The upward trend visible in these figures reflects a decreasing value of the AQI. Thus, the air quality improved in the long run. In the long-term period, there was a sudden decrease in the AQI at the cutoff of the dummy variable. Therefore, the plan had an instant significant effect, improving air quality in these prefecture-level cities. Consistent with the descriptive statistics in , the implementation of the plan led to a significant discontinuous decline in AQI, PM10 and CO. This decline was especially notable for values near the cutoff. Similar figures can be observed for the other seven prefecture-level cities. Thus, there is a causal relationship between the regulation policy dummy variable and the improvement of air quality in the 11 prefecture-level cities.
Figure 2. Long-term AQI change in Hangzhou. Source: The figure is created by authors.
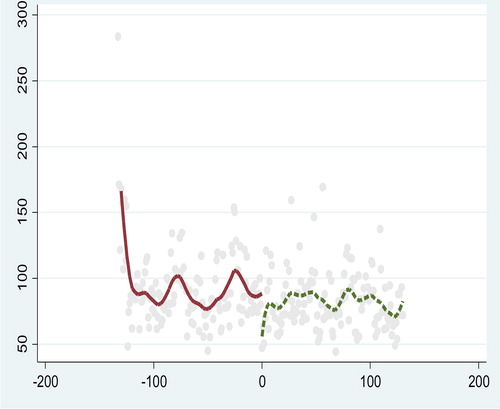
Figure 3. Long-term AQI change in Ningbo. Source: The figure is created by authors.
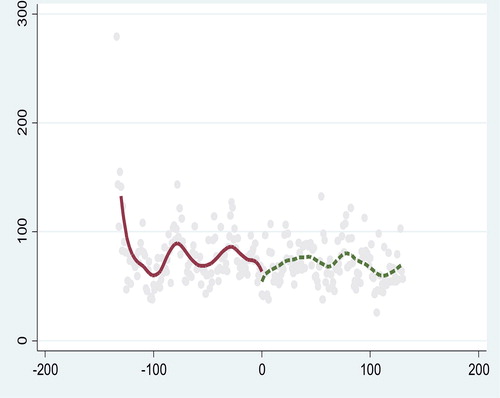
Figure 4. Long-term AQI change in Wenzhou. Source: The figure is created by authors.
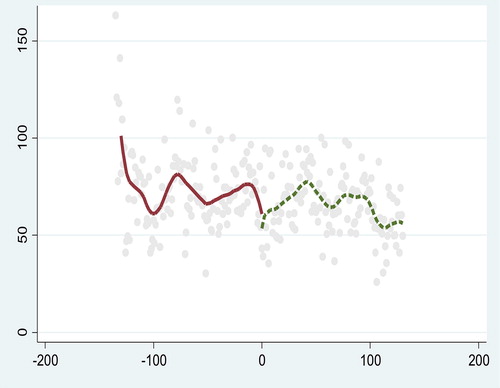
Figure 5. Long-term AQI change in Zhoushan. Source: The figure is created by authors.
We filtered the trends during the policy implementation period and controlled for the effects of the meteorological factors. After performing this step, we performed the accurate regression discontinuity design estimation of the effects of the G20 Hangzhou Summit environmental plan in terms of the discontinuous change of AQI and other pollutant concentrations in 11 prefecture-level cities in Zhejiang. The assumptions of both continuity and local randomisation were satisfied. shows the regression discontinuity results of the long-term policy effect of the plan on air quality. The results show a policy effect 2.5 years after the implementation of the plan. The results show that the implementation of the plan directly resulted in a long-term decrease of AQI by 40.17, 31.24, 25.73 and 23.89 for Hangzhou, Shaoxing, Huzhou and Ningbo, respectively (significance level of 1%).
Table 7. Long-term policy effects of G20 Hangzhou summit plan on air quality in 11 cities (January 2014 to December 2018).
The G20 summit was held in Hangzhou. Therefore, the implementation of the environmental plan was stricter in Hangzhou than in other cities. The estimation results show that the policy effects of the environmental regulations were stronger in Hangzhou than in other prefecture-level cities. Specifically, in Hangzhou, the plan caused significant decreases of 40.17, 14.15 μg/m3, 16.17 μg/m3, 1.53 μg/m3 and 50.81 μg/m3 for AQI, PM2.5, PM10, SO2 and O3, respectively.
Geographically, Shaoxing is the closest city to Hangzhou in Zhejiang province. The regulation implementation strength in Shaoxing was similar to the strength in Hangzhou. Unsurprisingly, Shaoxing ranked second in air quality improvement due to the regulation policy. Specifically, in Shaoxing, the plan caused a significant decrease of 31.24, 9.54 μg/m3, 13.43 μg/m3, 2.83 μg/m3 and 47.39 μg/m3 for AQI, PM2.5, PM10, SO2 and O3, respectively.
The results for the other cities are similar. Almost all cities experienced significant decreases in AQI, PM2.5, PM10 and O3 over the study period. According to the descriptive analysis of the meteorological variables in , the average temperature increased, and the average rainfall decreased. Normally, higher temperatures and lower rainfall levels tend to increase particulate matter and lead to poorer air quality. The decrease in AQI, PM2.5, PM10 and O3 indicates that the environmental regulations had a significant policy effect on air quality improvement.
Third, we conducted the robustness test. The regression discontinuity design is a causal identification method that is extremely sensitive to initial conditions. If the modelling significance depends heavily on specific initial conditions, the regression results are questionable. Robustness testing is employed to ensure the accuracy of the estimation of regression discontinuity designs (Thistlethwaite & Campbell, Citation1960; Imbens & Lemieux, Citation2008; Lee & Lemieux, Citation2010; Xi & Liang, Citation2015; Calonico et al., Citation2015). Considering the characteristics of a regression discontinuity design, the robustness test is carried out by adjusting the bandwidth and the fitting method. The results of the regression discontinuity design are compared under different bandwidths and different kernel function conditions to validate robustness. If the direction, size and significant degree of the estimation under different bandwidths and different fitting methods are similar and change only imperceptibly, the robustness of the regression discontinuity design may be accepted; otherwise, the results should be questioned.
Fitting method selection
This sub-section provides further robustness checks in addition to the traditional validity tests for regression discontinuity estimation. First, although controlling for the baseline covariates is unnecessary to obtain consistent estimates of the treatment effect if the initial condition holds, we nevertheless performed these calculations to check the robustness of our results.
To test the robustness of the results, we used local linear regression, a non-parametric method, to conduct the regression discontinuity estimation. Local linear regression is obtained using weighted least squares estimation over a limited interval (c – h, c + h). The weight is calculated by the kernel density function, and the weights of the points nearer the threshold c are larger.
The triangle kernel is accepted as optimal for non-parametric estimates at the boundary (Qin et al., Citation2017). However, it would be reassuring if the results were robust to the variation of kernel functions. The triangular kernel function was used to estimate the weights in our estimation results (). Rectangular kernel and triangular kernel functions are two widely used kernel functions in regression discontinuity estimation. reports the results using the rectangular kernel in the non-parametric regressions.
Table 8. Robustness test of regression discontinuity estimation with fitting method change (rectangular kernel).
As shown in , the estimates are all statistically significant and almost identical to those in . By comparing the changing direction and significance of the estimated results with different fitting methods of the triangle kernel and rectangular kernel, the estimation results of the policy effects on AQI, PM2.5, PM10 and O3 are observed to be significant and similar for most cities. According to the results of the regression discontinuity design with rectangular kernel, the environmental regulations had a significant decreasing effect on AQI, PM2.5 and PM10 in Hangzhou, Jiaxing, Shaoxing, Jinhua and Lishui (at a significance level of 10%). These results, mean that the air quality improved after the policy was implemented. The results validate the robustness of the regression discontinuity design results with different fitting methods.
2. Bandwidth selection
Furthermore, we selected different bandwidths to validate whether the estimation of regression discontinuity under different bandwidths was stable. Keeping local linear fitting (triangular kernel) as the estimation method, the estimates in were obtained with the original bandwidth minimisation of the optimal bandwidth given by mean squared error. To test the robustness, we employed 1.2 times the optimal bandwidth. The results are reported in .
Table 9. Robustness test of regression discontinuity estimation with bandwidth change (January 2014 to December 2018).
Intuitively, larger bandwidths mean smaller variances. However, because of the inclusion of points far from the threshold, the deviation may become larger. By comparing the impact direction, size and significance of the estimated results under different bandwidths, the estimated policy effects on AQI were observed to be significant and stable, with small fluctuations for all 11 cities in Zhejiang. The results show that the implementation of the environmental regulation policy directly resulted in a decrease of AQI by 38.224, 28.078, 19.516, 33.255, 20.184, 30.001, 22.865, 19.221 and 21.139 in Hangzhou, Ningbo, Jiaxing, Shaoxing, Wenzhou, Huzhou, Taizhou, Jinhua and Lishui (significance level of 5%). The policy effects on other pollutant concentrations were similar. The results validate the robustness of the regression discontinuity design results at different bandwidths. In conclusion, the results of the regression discontinuity design are robust. Furthermore, the implementation of the environmental plan for the G20 summit in Hangzhou improved the air quality in Zhejiang province.
4.2. Short-term policy effects
From a short-term perspective, we performed the regression discontinuity estimation using the sample data for the period July 2015 to June 2017. The sample data passed the continuity test. shows the short-term policy effects of the air quality improvement plan for 11 prefecture-level cities in Zhejiang.
Table 10. Short-term policy effect of G20 Hangzhou summit plan on air quality in 11 cities (June 2015 to June 2017).
We conducted robustness testing, confirming that the results in are robust. The short-term policy effects can be summarised in terms of the following two aspects. First, the plan directly resulted in significant short-term decreases of AQI by 43.794, 24.205, 19.007, 25.979, 23.203, 16.734 and 19.546 over a 1-year period in Hangzhou, Wenzhou, Quzhou, Huzhou, Taizhou, Zhoushan and Lishui. Second, in Hangzhou, the short-term policy effect was stronger than the long-term effect, especially for the decreasing strengths of AQI, PM2.5 and PM10. In Hangzhou, the plan caused significant short-term decreases of 43.79, 16.94, 15.88, 1.60 and 57.54 in AQI, PM2.5, PM10, SO2 and O3, respectively. The plan also caused long-term decreases of 40.17, 14.15, 16.17, 1.53 and 50.81 in AQI, PM2.5, PM10, SO2 and O3, respectively. The short-term effect was slightly stronger than the long-term effect in Hangzhou. In Wenzhou, Quzhou and Taizhou, the identified short-term policy effects in air quality improvement were significant, whereas the long-term policy effects were non-significant.
5. Conclusion and policy implications
On 1 July 2016, the Chinese government issued a plan for the prevention and control of air pollution in 11 prefecture-level cities in Zhejiang province to ensure better air quality during the G20 summit in Hangzhou. Policies have been evaluated for single cities, yet studies evaluating policy effects in multiple cities are scarce. This multi-city approach therefore offers a new research direction and one that is worthy of investigation. We applied a regression discontinuity design to measure the short-term and long-term policy effects of the aforementioned environmental plan on air quality improvement between July 2015 and June 2017 (short-term) and between January 2014 and December 2018 (long-term) in 11 prefecture-level cities in Zhejiang, China. We also evaluated whether these kinds of regulations could be extended for longer periods.
5.1. Conclusions
In this study, we used a dummy variable to indicate whether specific environmental policies to improve air quality for the G20 summit in Hangzhou had been implemented. Using this policy dummy variable as the treatment variable and the meteorological indicators of temperature, humidity, pressure, wind speed and rainfall as control variables, we ensured that the regulation policy threshold resembled a fully randomised experiment. The sample data satisfied the continuity and local randomisation tests for regression discontinuity designs. The local randomness of regression discontinuity designs validates the model, which naturally excludes the influence of other unobserved variables and solves the endogeneity problems associated with the OLS method. After accounting for the trends before and after the implementation of specific environmental regulations and controlling for meteorological factors, we applied a regression discontinuity design to measure the short- and long-term effects of these regulations in terms of changes in the air quality index (AQI) and pollutant concentrations (PM2.5, PM10, CO, SO2 and NO2) 1 year and 2.5 years after the policy variable breakpoint on 1 July 2016.
First, we observed significant short- and long-term effects of the environmental plan on air quality improvement, with the AQI decreasing in Zhejiang. Specifically, the plan directly resulted in significant short-term decreases of AQI by 43.794, 24.205, 19.007, 25.979, 23.203, 16.734 and 19.546 units after 1 year in Hangzhou, Wenzhou, Quzhou, Huzhou, Taizhou, Zhoushan and Lishui. The plan also directly resulted in significant long-term decreases of AQI by 40.17, 31.24, 25.73 and 23.89 units after 2.5 years in Hangzhou, Shaoxing, Huzhou and Ningbo.
Second, the short-term policy effect was stronger than the long-term effect, especially for the decreasing strengths of AQI, PM2.5 and PM10 in Hangzhou. The plan caused significant short-term decreases of 43.79, 16.94, 15.88, 1.60 and 57.54, respectively, for AQI, PM2.5, PM10, SO2 and O3 in Hangzhou. It also caused long-term decreases of 40.17, 14.15, 16.17, 1.53 and 50.81, respectively, for AQI, PM2.5, PM10, SO2 and O3 in Hangzhou. The short-term effect was slightly stronger than the long-term effect in Hangzhou. In Wenzhou, Quzhou and Taizhou the short-term policy effects, in terms of air quality improvement, were significant, whereas the long-term policy effects were non-significant.
Third, Hangzhou hosted the G20 summit. Understandably, therefore, the results show that both the short- and long-term policy effects of the environmental plan were stronger in Hangzhou than in other prefecture-level cities. In the long run, the estimated average temperature increased, and the average rainfall decreased. Normally, higher temperatures and greater rainfall levels tend to increase particulate matter and worsen air quality. The decrease in AQI, PM2.5, PM10 and O3 shows that the environmental regulations had a significant policy effect in terms of air quality improvement in Hangzhou. Shaoxing, which is the closest city to Hangzhou, had the second biggest air quality improvement in the long term as a result of the regulations. Specifically, in Shaoxing, the plan caused a significant decrease of 31.24, 9.54, 13.43, 2.83 and 47.39 for AQI, PM2.5, PM10, SO2 and O3, respectively, in the subsequent 2.5-year period.
5.2. Policy implications
The short-term policy effects of the plan implemented for the G20 summit were stronger than the long-term policy effects in terms of air quality improvement in Zhejiang. To guarantee sustainable air quality improvement, the government should extend some of the short-term regulations to the long term. More attention should be paid to these aspects in long-term governance. Measures taken in short-term environmental policies are often the most effective methods of environmental governance.
Notably, both the short- and long-term policy effects of the plan were stronger in Hangzhou than in other prefecture-level cities. Furthermore, the long-term policy effect in Hangzhou is only slightly weaker than the short-term policy effect. The successful experience of the environmental regulations brought in for the G20 summit in Hangzhou can be used as a reference for other major cities. Thus, stringent policies restricting industrial exhaust gas, coal-fired flue gas, vehicle and ship exhaust gas, other exhaust gas, and dust and ash gas, together with policies to close heavily polluting factories, could be extended to other cities to improve air quality.
Disclosure statement
No potential conflict of interest was reported by the author(s).
Additional information
Funding
References
- Calonico, S., Cattaneo, M. D., & Titiunik, R. (2015). Rdrobust: An R package for robust nonparametric inference in regression-discontinuity designs. The R Journal, 7(1), 38–51. doi:10.32614/RJ-2015-004
- Cao, J., Wang, X., & Zhong, X. H. (2014). Has the restriction policy improved air quality in Beijing?. China Economic Quarterly (in Chinese), 13(3), 1091–1126.
- Chang, Y., Huang, R., & Masanet, E. (2014). The energy, water, and air pollution implications of tapping China’s shale gas reserves. Resources, Conservation and Recycling, 91(9), 100–108.
- Chen, Y., Ebenstein, A., Greenstone, M., & Li, H. B. (2013). From the cover: Evidence on the impact of sustained exposure to air pollution on life expectancy from China’s Huai River policy. Proceedings of the National Academy of Sciences of Sciences, 110(32), 12936. doi:10.1073/pnas.1300018110
- Chen, Y., Jin, G. Z., Kumar, N., & Shi, G. (2013). The promise of Beijing: evaluating the impact of the 2008 Olympic games on air quality. Journal of Environmental Economics and Management, 66(3), 424–443. doi:10.1016/j.jeem.2013.06.005
- Chen, H., Li, Q., Kaufman, J. S., Wang, J., Copes, R., Su, Y., & Benmarhnia, T. (2018). Effect of air quality alerts on human health: a regression discontinuity analysis in Toronto, Canada. The Lancet Planetary Health, 2(1), e19–e26. doi:10.1016/S2542-5196(17)30185-7
- Christmann, P. (2004). Multinational companies and the natural environment: Determinants of global environmental policy standardization. Academy of Management Journal, 47(5), 747–760. doi:10.2307/20159616
- Dangelico, R. M., & Pujari, D. (2010). Mainstreaming green product innovation: Why and how companies integrate environmental sustainability. Journal of Business Ethics, 95(3), 471–486. doi:10.1007/s10551-010-0434-0
- Davis, L. W. (2008). The effect of driving restrictions on air quality in Mexico City. Journal of Political Economy, 116 (1), 38–81. doi:10.1086/529398
- Firdaus, G., & Ahmad, A. (2011). Changing air quality in Delhi, India: determinants, trends, and policy implications. Regional Environmental Change, 11(4), 743–752. doi:10.1007/s10113-011-0207-z
- Gagliardi, L., & Percoco, M. (2017). The impact of European cohesion policy in urban and rural regions. Regional Studies, 51(6), 857–868. doi:10.1080/00343404.2016.1179384
- He, G., Fan, M., & Zhou, M. (2016). The effect of air pollution on mortality in China: Evidence from the 2008 Beijing Olympic Games. Journal of Environmental Economics and Management, 79, 18–39. doi:10.1016/j.jeem.2016.04.004
- Henderson, J. V. (1996). Effects of air quality regulation. American Economic Review, 86(4), 789–813.
- Imbens, G. (2010). Better LATE than nothing: some comments on Deaton (2009) and Heckman and Urzua (2009). Journal of Economic Literature, 48(2), 399–423. doi:10.1257/jel.48.2.399
- Imbens, G., & Lemieux, T. (2008). Regression discontinuity designs: A guide to practice. Journal of Econometrics, 142(2), 615–635. doi:10.1016/j.jeconom.2007.05.001
- Kallmuenzer, A., Hora, W., & Peters, M. (2018). Strategic decision-making in family firms: an explorative study. European J. of International Management, 12(5/6), 655–675. doi:10.1504/EJIM.2018.094497
- Kathuria, V. (2002). Vehicular pollution control in Delhi: need for integrated approach. Economic and Political Weekly, 37(12), 1147–1155.
- Lee, D., & Lemieux, T. (2010). Regression discontinuity designs in economics. Journal of Economic Literature, 48(2), 281–355. doi:10.1257/jel.48.2.281
- Li, J. K., & Cao, J. (2017). Empirical analysis of the effect of central heating on air pollution in China. China Journal of Economics (in Chinese), 4, 138–150.
- Li, T. Y., Deng, X. J., Fan, S. J., Wu, R., Li, F., Deng, T., … Jiang, D. H. (2012). Study on air quality and pollution meteorology conditions of Guangzhou during the 2010 Asian Games. Huan jing ke xue = Huanjing kexue), 33(9), 2932–2938.
- Lu, H., Yue, A., Chen, H., & Long, R. (2018). Could smog pollution lead to the migration of local skilled workers? Evidence from the Jing-Jin-Ji region in China. Resources, Conservation and Recycling, 130(3), 177–187. doi:10.1016/j.resconrec.2017.11.024
- McCrary, J. (2008). Manipulation of the running variable in the regression discontinuity design: A density test. Journal of Econometrics, 142(2), 698–714.
- Qi, W. (2014). Air quality policy assessment under functional data perspective: an analysis of odd-even day traffic restriction scheme in Lanzhou city. Statistics & Information Forum, 29(09), 79–85.
- Qin, X. Z., Zhuang, C. C., & Yang, R. (2017). Does the One-child policy improve children's human capital in urban China? A regression discontinuity design. Journal of Comparative Economics, 45(2), 287–303. doi:10.1016/j.jce.2016.09.001
- Sun, K. (2017). Study on the effect of haze treatment of motor vehicle emission standard analysis based on regression discontinuity design. Soft Science (In Chinese), 31(11), 93–97.
- Sun, D., Fang, J., & Sun, J. (2018). Health-related benefits of air quality improvement from coal control in China: Evidence from the Jing-Jin-Ji region. Resources, Conservation and Recycling, 129(2), 416–423.
- Thistlethwaite, D. L., & Campbell, D. T. (1960). Regression-discontinuity analysis: an alternative to the ex post facto-experiment. Journal of Educational Psychology, 51(6), 309–317. doi:10.1037/h0044319
- Xi, P. H., & Liang, R. B. (2015). Can air pollution influence the local environmental protection expenditure-based on the multiple-cutoffs regression discontinuity design. Statistical Research, 32(09), 76–83.
- Zhang, J. (2016). Did environmental regulation improve air quality in Beijing? Based on the synthetic control method. Collected Essays on Finance and Economics, 6, 104–112.
- Zhang, C., Chen, J., & Wen, Z. (2012). Alternative policy assessment for water pollution control in China’s pulp and paper industry. Resources, Conservation and Recycling, 66(9), 15–26. doi:10.1016/j.resconrec.2012.06.004
- Zeng, J. (2018). Fostering path of ecological sustainable entrepreneurship within big data network system. International Entrepreneurship and Management Journal, 14(1), 79–95.
- Zhao, J. P., Luo, L., Zhen, Y. J., & Liu, H. H. (2017). Analysis of air quality characteristics and meteorological conditions in Hangzhou during the G20 summit. Acta Scientiae Circumstantiae (in Chinese), 37(10), 3885–3893.