
 ?Mathematical formulae have been encoded as MathML and are displayed in this HTML version using MathJax in order to improve their display. Uncheck the box to turn MathJax off. This feature requires Javascript. Click on a formula to zoom.
Abstract
The main objective of this research article is to explore hypothesis about the integration of the banking systems in European Union (EU). Increasing the European Union member states degree of convergence and integration is one of the major challenges faced by the European Economic and Monetary Union (EMU). The empirical analysis is based on the non-linear time-varying coefficients factor model designed by Phillips and Sul for the sample period 2007–2017. Our results indicate the rejection of the convergence hypothesis for EU banking systems. Additionally, our empirical findings reveal that there are significant differences in how European banks assess the non-financial sector and the households sector. During the period 2011–2013, which is a period coinciding with the most severe episodes of the sovereign debt crisis, the dispersion between trajectories increases, involving a segmentation of interest rates, and this leads to the conclusion that the integration of EU banking systems has been negatively influenced by the sovereign debt crisis. The results of the empirical study also suggested that for most clusters, the convergence speed is relative, which does not lead to an absolute integration in the long run.
1. Introduction
This research paper aims to investigate convergence hypothesis about the integration of the banking systems in European Union (EU) Member States. The creation of the European Union (EU) and the Economic and Monetary Union represents a perpetual economic and political challenge. This is determined by the high degree of heterogeneity that characterizes EU Member States. Thus, despite the fact that the stage of development of the Member States was initially similar, the enlargement of the EU to Central and Eastern Europe, and the accession of the former socialist countries, has considerably reduced the level of economic homogeneity.
Against this background, the main challenge, unanimously accepted in the EU treaties, is to increase the Member States degree of convergence and integration. Financial integration plays a key role in the integration process. Eyraud, Singh, and Sutton (Citation2017) define financial integration as the process through which financial markets in two or more countries become more interconnected. This process can be determined by several factors: cross-border financial flows, foreign capital, unified market structures, and so on, considering that integration is signalled by the price convergence of assets with the same characteristics (law of one price). This is to say that there can only be perfect integration if a similar asset has the same price across different markets.
Financial integration is important because financial markets are the main channel for optimal allocation of resources. Moreover, a stable and efficient financial system can accelerate the process of narrowing the development gaps between Member States. Economic literature discusses the benefits of financial integration exhaustively. The most important benefits of financial integration are the following: acceleration of economic growth; reducing vulnerability to crises; increasing liquidity and capitalization; improving financial stability; risk diversification; speeding up consumption; increased foreign direct investment; the strengthening of financial discipline. However, Agénor (Citation2003) also lists some costs that financial integration may induce: loss of macroeconomic stability; inefficient allocation of capital; the volatility of capital flows and an increase in the degree of spillovers. Also, a high level of financial integration can be a determining factor in banking crises. Yet, in our view, the costs of financial integration can be diminished, even eliminated, through an adequate regulatory and supervisory framework.
Considering the importance of integration and economic convergence, and particularly that of financial integration and convergence, the main objective of the present paper is to analyse the degree of financial integration in the EU. In this regard, taking into account data availability, we analyse the integration of banking systems in 24 Member States over the period 2007–2017. The analysis of the integration of banking systems is carried out from the perspective of the law of one price, using as a benchmark the interest rates applied by credit institutions to loans granted and to attracted deposits. We study the integration of banking systems using the model proposed by Phillips and Sul (Citation2007).
Our secondary goals are multiple. First of all, we aim at identifying how the degree of integration has evolved over time. Second, we investigate the manner in which the global financial crisis and the sovereign debt crisis have influenced the dynamics of integration from a financial stability point of view. Thirdly, we look at the differences between developed countries and emerging countries.
In general, the number of research studies investigating the integration of banking systems using interest rates as a benchmark is limited. That is why, in our opinion, our paper complements the literature with some new insights. From our best knowledge, the most representative studies in this respect, which are also the closest to our own objectives and the methodology adopted in the present chapter are: Sørensen and Werner (Citation2006); De Guevara, Maudos, and Pérez (Citation2007); Oplotnik, Vojinović, and Acharya (Citation2011); Rughoo and Sarantis (Citation2012); Rughoo and Sarantis (Citation2014); Arnold and van Ewijk (Citation2014); Paries, Moccero, Krylova, and Marchini (Citation2014). A significant number of empirical studies impose a strict limited sample based only on emerging financial systems in Europe, i.e.: Kenourgios and Samitas (Citation2011), Guesmi and Nguyen (Citation2014), Horvath and Petrovski (Citation2013), Caporale and Spagnolo (Citation2012), Horvath and Huizinga (Citation2015), or on the contrary only on developed financial systems in Europe, such as: Lee and Mercurelli (Citation2014), Pozzi and Wolswijk (Citation2012), Berben and Jansen (Citation2009), Worthington and Higgs (Citation2010), De Guevara et al. (Citation2007).
In our opinion, the empirical analysis carried out in the present paper brings some important contributions to the literature. First of all, as far as we know, there has been no similar research to date based on such a large sample. Rughoo and Sarantis (Citation2012) and Rughoo and Sarantis (Citation2014) used a similar methodology to assess financial convergence for the first 15 integrated European countries. Arnold and van Ewijk (Citation2014) investigated the impact of sovereign risk and credit risk on the convergence of interest rates in the retail banking sector in the euro area and suggested that the level of convergence σ was negatively affected by the global financial crisis. Second, by analysing the integration of banking systems in terms of interest rates, we provide an exhaustive framework for decision-makers, especially considering that this area has not been sufficiently researched in the literature. Third, we use a methodology that allows us to identify the convergence speed and to classify selected countries into convergence clusters.
In the literature, there are various other studies that have analyzed the integration of banking systems in the European Union, based on different criteria. For example, among others, Kılınç, Seven, and Yetkiner (Citation2017) investigated the integration of EU banking systems, having as criteria financial development and liquidity; Matousek, Rughoo, Sarantis, and Assaf (Citation2015); Weill (Citation2009); Casu and Girardone (Citation2010) analyzed the integration of banking systems in the European Union with reference to the efficiency of commercial banks; Evans, Hasan, and Lozano-Vivas (Citation2008) analyzed the influence of regulations on the level of integration of EU banking systems; Pérez, Fumás, and Salas (Citation2005) investigated the integration of banking systems considering the cross-border financial flows and the activity of foreign-owned banks.
In the light of the above considerations, our research hypotheses can be delimited as follows:
H1: In the EU Member States, the degree of financial integration has increased.
H2: The financial and macroeconomic instability generated by the global financial crisis and the sovereign debt crisis have influenced the degree of financial integration.
Integration and economic convergence are the most important pillars of support for European Union. Is there a common pattern for the integration of European Union banking systems? Are there disparities within homogeneous regions such as the euro area and the other member states of the European Union included in the sample? Is there a large heterogeneity within EU member states? How severe are the differences between the old and new EU member states for the integration of European Union banking systems? The aim of this article is to find answers to all of these questions.
2. Research methodology and data collection
2.1. Methodology for testing convergence
In order to study the integration of banking systems in the EU Member States, we use the model proposed by Phillips and Sul (Citation2007) which tests the convergence hypothesis for the data series included in the sample. In addition, if convergence hypothesis is rejected for the whole sample, the model allows clustering selected data series into convergence clusters.
The methodology proposed by Phillips and Sul (Citation2007) uses a nonlinear model that includes a component that varies over time. The model also allows us to observe the dynamics over time and long-term behaviour. The econometric method developed by Phillips and Sul (Citation2007) is an innovative regression based convergence test. Bartkowska and Riedl (Citation2012) suggested that the model designed by Phillips and Sul (Citation2007) enables to detect convergence even in case of transitional divergence, where other methods such as stationarity tests fail, such as Hobijn and Franses (Citation2000) framework.
Assuming we have a panel data sample for the variable where
and
where
is the number of units included in the sample, and
is the period for which data is available. A simple linear pattern can be expressed as follows:
(1)
(1)
where
is a common function with a trend that reveals the state of equilibrium that can follow anon stationary stochastic process or a stationary process;
are specific factors that measure the distance between the common trend
and
are idiosyncratic components. Phillips and Sul (Citation2007) reformulate EquationEquation (1)
(1)
(1) , allowing the variation over time of specific factors, as follows:
(2)
(2)
where
absorbs
Moreover, Phillips and Sul (Citation2007) model the specific factors in a semi-parametric function, as follows:
(3)
(3)
where
has a fixed value,
is independently and identically distributed in the range (0.1) for iand poorly dependent in time; L(t) is a function that varies (like log (t + 1)) for which
like
). This wording certifies that
converges to
for all
and consequently becomes the null convergence hypothesis. However, even if the null hypothesis is valid and
for
the model allows convergence for different periods in which
Thus, the model includes the possibility of heterogeneity over time and even divergence in the sample. As Phillips and Sul (Citation2007) suggest, a high degree of heterogeneity can be introduced into the model, in the situation where the speed of convergence and the function L(t) are specific to each unit in the sample. To have rigorous asymptotes for regression, certain conditions must be imposed for idiosyncratic parameters
and for the random variable
The null hypothesis of convergence can be expressed as follows:
The alternative hypothesis is given by:
The alternative hypothesis assumes the sample’s divergence, but allows the formation of convergence groups. Identification and estimation it is not possible without imposing hypotheses supplementing the dynamic model. In this respect, Phillips and Sul (Citation2007) propose a way to extract the characteristics
by estimating the following transient trajectories:
(4)
(4)
Parameter captures
in relation to the panel average at the time t and describes the evolution of the trajectory for the country i as compared to the average of the sample data. Consequently,
measures the distance of the country i from equilibrium state,
If
is convergent to
the relative trajectory a
is convergent to one, in which case the variation
tending to zero:
(5)
(5)
where
measures the distance of the panel from the common limit. In the hypothesis of convergence,
as
If the convergence hypothesis is rejected, the distance remains positive and t tends to infinity. In this case, Phillips and Sul (Citation2007) suggest several possibilities:
may converge to a constant other than zero, it may converge to a value greater than zero, but not convergent, or it may be divergent. In the case of cluster convergence,
is convergent to a positive constant term.
Regression to test the convergence hypothesis for the whole sample, based on asymmetric convergence in EquationEquation (5)
(5)
(5) , involves estimating the following regression by the least squares method:
(6)
(6)
for
where
and
where
is the estimated coefficient for
into the
Phillips and Sul (Citation2007) suggest estimating regression at a certain point and
Based on their own simulations, Phillips and Sul (Citation2007) suggest that
in situations where
is reduced or moderate (e.g.,
) and
in situations where
is high (for example,
). Considering that for the data series used in our estimates
we will use
The null hypothesis of convergence is rejected in the case Rejection of the null hypothesis does not imply the absence of convergence for different subgroups of panel countries. Consequently, Phillips and Sul (Citation2007) propose a clustering algorithm that allows the classification of countries in the sample into convergence clusters. The procedure is flexible and the results imply several possibilities, i.e.: sample countries convergence, sample countries divergence, convergence clubs and divergent countries.
The clustering algorithm proposed by Phillips and Sul (Citation2007) to delimit panel units in convergence clubs based on regression comprises four main steps:
Sorting data based on the last observation. All units
of the panel are ordered according to the last observation.
Formation of the main group. Selecting units in the panel with the highest values
Selection of units for inclusion in the convergence club. After the formation of the main convergence group, each unit is added separately to it and the regression
Stopping rule. A second group is formed for all units outside the first convergence group. Regression
The value of the coefficient provides important information regarding the speed of convergence. Thus, high coefficient values indicate a significant convergence rate. At the same time, the value of the coefficient
allows us to distinguish between different degrees of convergence. More specifically, if
we will obtain the convergence rate (relative convergence), while
indicates convergence in level - absolute convergence.
Convergence is a long-term goal. Consequently, Phillips and Sul (Citation2007) recommend using the Hodrick-Prescott filter to extract the trend component of the data series. Consequently, for our own estimates, we have set the value of the smoothing parameter to 14.400, a value accepted in the empirical literature. The empirical estimations have been obtain by using the GAUSS 10 econometric software.
2.2. Data description
The European Union (EU) includes 28 Member States. In our sample we have included 24 EU countries: Austria, Belgium, Bulgaria, Czech Republic, Denmark, Estonia, Finland, France, Germany, Greece, Hungary, The Netherlands, Poland, Portugal, Romania, Slovakia, Slovenia, Spain and Sweden. To determine the integration of banking systems in the 24 states, we have used data series for lending interest rates and for deposit interest rates over the period 2007–2017. We have limited our sample to 24 EU Member States for reasons related to data availability. For Cyprus and Malta, data were only available from 2008 (because no data were available prior to 2008) and for Croatia since 2011. As for the UK, we have not identified series of data similar to those included in our estimates. We also used the following syntagmas:” the hard core of the euro area” (Austria, Germany, Netherlands, Belgium, Luxembourg, France) and” the periphery of the euro area” which includes the GIIPS countries, ie: Greece, Ireland, Italy, Portugal and Spain. The hard core of the euro area represents a cluster of the countries with low interest rate disparities, while some Central and Eastern European countries form cluster characterized by high interest rates. The sample period reflects both the effects of the global financial crisis and the effects of the sovereign debt crisis. For the non-financial sector, we have included the following series of data in the estimations: the total interest rate on time deposits and the total interest rate on loans granted. For households, we have included the following series of estimates: the total interest rate on time deposits, the total interest rate on real estate loans and the total interest rate on consumer credit. All series refer to data denominated in national currencies. Interest rates on attracted deposits and on loans granted were extracted from the ECB’s database and from the official databases of each central banking for the sample countries.
provides a complete and detailed framework for the data included in our estimates. A synthetic analysis of the data in this table shows some relevant issues. The main observation is related to the significant differences, both between the average values and between the volatility of the interest rates in the 24 countries included in the sample. However, it should be noted that disparities are more pronounced in the case of the average values for the active interest rate. Thus, in the case of passive interest rates, the average values are more homogeneous. Regarding the average values, intuitively, we can see that the interest rates in the old EU states are lower compared to the new EU states. More specifically, for example, the highest average interest rates applied by credit institutions for the non-financial sector are found in Romania, Bulgaria, Hungary, Greece and Poland, while the lowest values are in Finland, Luxembourg, Austria, Sweden and France. The inclusion of Greece in the group of Central and Eastern European countries can be explained by the sovereign crisis in the country. In Romania, the situation seems to be a special one. Maximum interest rates reach about 19%, almost four times higher than in the Czech Republic, for example. High values at the top of the range can also be seen in the case of Hungary, 12.67%, and Bulgaria, 11.58%. The lowest values in the lower part of the range can be seen in Luxembourg, Sweden and Austria. In general, the previous observations are also valid for the interest rate on mortgages granted to households for housing acquisition. The highest average values can be observed in Hungary, Bulgaria, Romania, Poland and, surprisingly, the Netherlands. On the contrary, low values can be observed in Finland, Estonia, Luxembourg, Portugal and Spain. In this case, too, extreme values at the upper limit of the range can also be identified in Hungary, Romania, Bulgaria, Poland and Slovenia. For the other countries in the sample, the maximum values do not exceed about 6%. The highest interest rates can be seen in consumer credit to households. In this case, the highest average values are found in Central and Eastern European countries, i.e. Hungary, Romania, the Czech Republic, Poland and Bulgaria. The lowest average values are found in Luxembourg, Finland, Austria, the Netherlands and Belgium.
Table 1. Descriptive statistics for data included in the sample.
In the case of interest rates on time deposits attracted from both the non-financial sector and the households, the degree of heterogeneity is lower. The highest average interest rates on deposits attracted from the non-financial sector are in Romania, Hungary, Bulgaria and Poland. Contrariwise, lower values can be seen in Luxembourg, the Czech Republic, Slovakia and Lithuania. It is also noteworthy that, with respect to the maximum values of the upper range, there is a high degree of homogeneity of the values, with the exception of Romania and Hungary. Quite surprisingly, we see higher values with respect to the lower limit of the range in France and the Netherlands. From the analysis of interest rates on term deposits attracted from households, a few interesting elements emerge. Thus, the highest average values are in Romania, Bulgaria, Hungary and, surprisingly, in the Netherlands and France. Similarly to interest rates on term deposits attracted from households, there is a high homogeneity in the higher values of the upper range, with the exception of Romania, Hungary and Bulgaria. In our opinion, the high values for term deposits from the non-financial sector and households in Romania and Hungary can be explained by the liquidity deficit on these markets. Surprisingly, peak values of the upper range are observed in the Netherlands and France. This can be explained by the tendency of these banking systems to protect the economies of the population, despite a lower interest margin.
3. The integration of banking systems: empirical results and discussion
In what follows, we propose to look at how EU interest rate integration has evolved over the past ten years and how financial instability has affected integration in 24 EU Member States. Estimates will be made for both the sample of 24 countries and the sample of the countries in the hard core of the euro area and those at the periphery of the euro area.
presents the results of the convergence algorithm for banking systems in the 24 EU Member States, with the interest rate benchmark for loans to the non-financial sector. The convergence hypothesis for the whole sample of countries is rejected, considering that Under these circumstances, the convergence algorithm proposed by Phillips and Sul (Citation2007) tests the hypothesis of cluster convergence.
Table 2. Cluster convergence algorithm for interest rate on loans to non-financial sector, 2007: 1–2017:10.
The results obtained indicate the grouping of banking systems into three convergence clusters, indicating three convergence points. Thus, the first convergence cluster, which tends towards the highest equilibrium point (i.e. convergence of interest rates to the highest average value in the sample), consists of Ireland, Portugal, Poland, Greece, Bulgaria and Romania, and the speed convergence is low (), which implies relative convergence only. The first cluster of convergence includes the first euro zone countries that have faced the effects of the sovereign debt crisis. In fact, in the euro area, Greece, Ireland and Portugal, in that order, were the first countries to receive financial assistance packages from international lenders. Three countries from Central and Eastern Europe also belong to this group of countries. The second convergence group consists of Austria, Belgium, Germany, Estonia, Spain, France, Lithuania, Slovenia, Denmark, Latvia, Slovakia, Italy, Czech Republic, Hungary and the Netherlands. Its structure is heterogeneous, including banking systems on the periphery of the euro area, from the euro area hard core, as well as emerging banking systems. The heterogeneity is also supported by the negative convergence rate (
). The negative level of the convergence speed expresses a rather short-term, circumstantial integration. The last convergence group consists of Finland, Luxembourg and Sweden. Although the group structure is homogeneous, consisting in banking systems of developed countries, the convergence speed is negative. Finally, it should be noted that the convergence hypothesis between clusters is rejected.
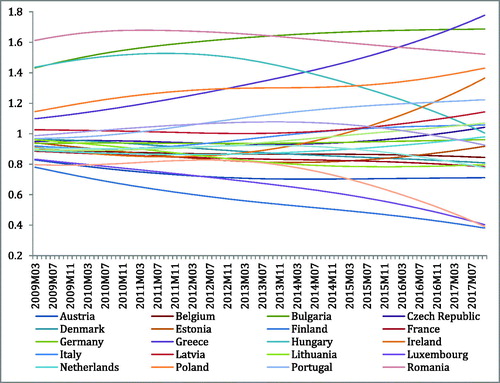
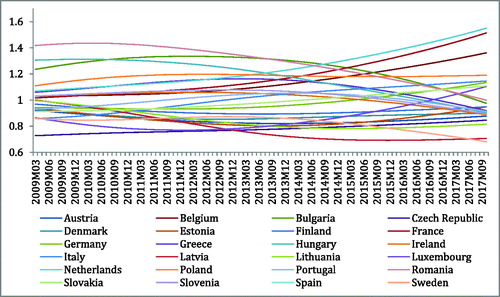
Relevant issues arise from the analysis of interest rate trajectories on loans to the non-financial sector (). Note that the curve dynamics must be interpreted in relation to the average of the sample, which is equal to 1. Consequently, the distance from the average of the sample is an indication of the segmentation of interest rates. The equilibrium points for the three convergence clusters are very clearly delineated. The equilibrium point for the first convergence group is above the average of the sample. Consequently, we can say that in Greece, Bulgaria, Romania, Poland, Ireland and Portugal, interest rates on loans granted by credit institutions to the non-financial sector are higher than the average of the sample. Intuitively, Greece is the country where the rising dynamics of interest rates was the most pronounced. Thus, we can observe that at the beginning of the analysis period, in 2009, the interest rate curve was close to the average of the sample and could be included in the second convergence group. After 2010, the trajectory is rising, which implies a divergence in interest rates in other countries. A similar trend can also be observed in Portugal, but the rising dynamics are much slower compared to Greece. In Ireland, up to 2013, the interest rate trajectory was below the sample average. After 2013, the slope becomes strongly ascendant. In the case of Bulgaria and Poland, we can observe a relatively similar trend of evolution. Contrariwise, in the case of Romania the trajectory slope is descending but not as pronounced, as in Hungary, for example. The equilibrium point for the second convergence club is formed around the average of the sample. Most of the countries included in this cluster have a steady slope for the interest rate. This implies a high degree of predictability. The only exception is Hungary. Thus, if at the beginning of the period analysed, Hungary was very close to Romania, starting with 2012 the slope becomes strongly descending, approaching the average of the sample at the end of the interval. The average of the sample is best reflected in the behaviour of the interest rate in Germany. The last convergence cluster is formed below the average of the sample. For the three countries in this group, we can say that the adjustment process was the most powerful, with the countries in this group being the most advantaged. At the end of the period of the paper, we can see that the dispersion between the trajectories of the countries in the sample is higher, compared to the beginning of the period, which means a lowering of the integration level. At the beginning of the period, with the exception of five Central and Eastern European countries, all countries could form a convergence group around the average of the sample.
Figure 1. Dynamics of interest rate trajectories on loans to the non-financial sector.
Source. Own estimates
presents the results of the convergence algorithm for banking systems in the 24 EU Member States, with the interest rate on mortgages granted to households for the purchase of real estate as a benchmark. The convergence hypothesis for all the countries included in the sample is rejected (53.8206). Consequently, the convergence algorithm identifies eight clusters of convergence and three divergent countries. The first cluster of convergence includes Bulgaria, Hungary and the Netherlands. The inclusion of the Netherlands in this convergence group, above the average of the sample, is quite surprising. However, this is explicable if we take into account the fact that the standard deviation of the interest rate on loans to households for the purchase of real estate is one of the lowest, and the value of the interest rate in the lower range is one of the highest (). The second cluster of convergence also has a heterogeneous structure. It includes: Poland, Romania, Germany, the Czech Republic and Ireland. Actually, given the geographical criterion and the stage of development criterion, heterogeneity is also the case for cluster 3, comprising Slovakia and France, cluster 4 consisting of Greece and Belgium, cluster 5 consisting of Denmark, Slovenia and Italy and cluster 6 consisting of Latvia and Luxembourg. A higher level of homogeneity can be seen in cluster 7, consisting of Austria and Sweden, and cluster 8, consisting of Estonia and Lithuania. The speed of convergence,
for all eight clusters is very low, which implies only relative convergence. Three countries, Spain, Finland and Portugal, evince divergent behaviour. Consequently, they are not included in any convergence cluster. Four pairs of clusters (2 and 3, 3 and 4, 5 and 6, 6 and 7) can form convergence clusters. The high number of convergence clusters, the low convergence rate and the composition of clusters indicate high disparities in the credit market for housing acquisition.
Table 3. Cluster convergence algorithm for interest rate on mortgage loans granted to households for the purchase of buildings, 2007:1–2017:10.
The heterogeneity of the interest rate applied to loans to the non-financial sector reflects the differing characteristics of companies in the European Union (for example, bankruptcy risk, profitability, solvency). In our view, in the long run, the lack of integration will diminish the ability of companies in high-interest countries to compete in a single market with common rules.
The high degree of heterogeneity can also be seen from the trajectory dynamics highlighted in . Moreover, the dispersion between interest rate curves has increased over time, so that, at the end of the analysis period, we see the highest difference between countries above the average and countries below the sample average. The equilibrium point for the first convergence cluster is well above the average of the sample. The inclusion of the Netherlands, along with Bulgaria and Hungary, in this first cluster is determined by the strong upward slope. The second convergence group is formed slightly above the average of the sample. The significant downward dynamics of Romania’s trajectory, especially after 2012, are noteworthy. In our opinion, this development was driven by the government guarantee program, which involved a reduction and capping of interest rates. The equilibrium point for the third and fourth convergence groups tends towards the average of the sample. The dynamics of the trajectory for Greece is quite surprising. Thus, unlike the interest rate on loans to the non-financial sector, in this case we can see a high degree of stability. The last four convergence clusters are formed below the sample average. The three divergent countries, Spain, Finland and Portugal, evince a strong downward trend in interest rates trajectories. In fact, the three countries could form a convergence cluster with an equilibrium point far below the average of the sample. The evolution of interest rates in Spain and Portugal is counterintuitive. Although both countries have been affected by the public debt crisis, having received financial assistance packages, and the banking system in Spain has faced a high degree of instability, interest rates in these countries are on a downward trend compared to other countries, which implies positive effects on the households of the population.
Figure 2. Dynamics of interest rates trajectories for mortgage loans granted to households for the purchase of real estate.
Source: Own estimates
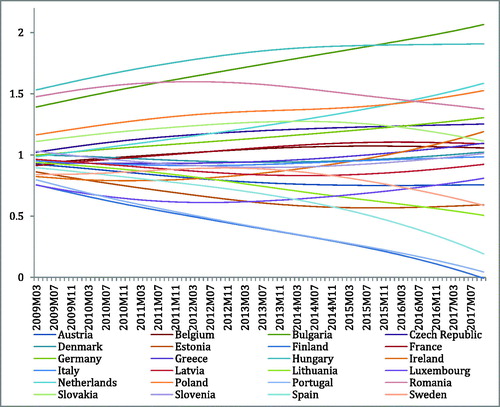
In our opinion, the high segmentation of interest rates on loans to households for the purchase of real estate is determined by the particularities of the residential real estate market in each country, by the way in which long-term bank resources are financed, as well as by the public support programs for the residential market and by the country-specific taxation system.
presents the results of the convergence algorithm for banking systems in the 24 EU Member States, using the interest rate on mortgages granted to households for the purchase of real estate as a benchmark. The hypothesis of convergence for all the countries included in the sample is rejected (357.30).
Table 4. Cluster convergence algorithm for interest rate on consumer credit to households, 2007:1–2017:10.
Under these circumstances, the methodology proposed by Phillips and Sul (Citation2007) identifies five clusters of convergence and four divergent countries. The first convergence group includes four Central and Eastern European countries: Latvia, the Czech Republic, Estonia and Romania. The convergence rate is low (), indicating only relative convergence. From the point of view of the economic development criterion and the geographical criterion, the composition of the second group is heterogeneous. It includes five Central and Eastern European countries and three peripheral countries of the euro area. The same observation applies to the fourth cluster, which includes Slovenia and Italy. It is worth noting that the second and third clusters form a common convergence group. The fourth and fifth clusters include countries in the hard core of the euro area. Convergence speed (
) indicates only relative convergence, which can be easily reversed. Four of the countries included in the sample, Finland, Portugal, Sweden and Denmark, do not converge to any point of equilibrium. Testing the hypothesis of convergence among clusters indicates that two pairs of clusters (1 and 2; 2 and 3) form unitary convergence groups.
describes the dynamics of interest rate trajectories on consumer credit to households. The first convergence group is formed well above the average of the sample. However, we should emphasize that the four countries included in this group have different trajectories. Thus, while for Latvia and Estonia we see strong ascendant slopes, especially for Latvia, for Romania and the Czech Republic, the trajectory curve is more stable. Similarly, the equilibrium point for the second convergence group is formed above the sample average. There is also heterogeneity of interest rate trajectories for this cluster.
Figure 3. Dynamics of interest rate trajectories on consumer credit granted to households.
Source: Own estimates
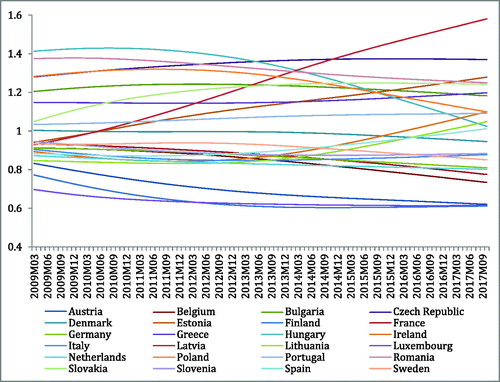
Thus, for Hungary and Poland, the trajectories have a strong downward slope, for Bulgaria and Slovenia, the trajectories are relatively stable, while for Spain, Lithuania, Greece and Ireland the trajectories have a strong ascendant slope. If we carefully analyse the trajectory for Portugal, we can see that this country can be included in the second convergence cluster.
The trajectory curve for Denmark is stable, reflecting the average of the sample. Slovenia and Italy form a convergence group below the average of the sample. Surprisingly, despite the fact that the banking system in Slovenia has been significantly affected by the crisis and Italy has been affected by the tensions generated by rising public debt financing, their interest rate trajectories are stable and have a slow downward trend. The equilibrium point for the fourth convergence group is below the sample average and includes Germany, the Netherlands and France, countries which belong to the hard core of the euro area. Our previous observations also apply in the case of the last convergence group, but we can see that the trajectories have a much stronger downward trend. Given the trajectory of Finland, we can include it in this last convergence cluster.
presents the results of the convergence algorithm for banking systems in the 24 EU Member States, using as benchmark the interest rate for term deposits attracted from the non-financial sector. The convergence hypothesis for all the countries included in the sample is rejected (2.2705). Consequently, the convergence algorithm identifies three equilibrium points for the 24 countries. The first convergence cluster includes eight countries, both from Central and Eastern Europe and from Western Europe. The convergence rate for this cluster is low, reflecting only relative convergence. The second convergence group comprises seven countries. Here too, CEE, euro area hard core and euro area periphery countries are included. This is also true for the third cluster of convergence. The convergence speed for the second and third group (
) indicates only relative convergence. Testing the hypothesis of convergence among clusters reveals that the first and second clusters can form a unitary group with a common equilibrium point.
Table 5. Cluster convergence algorithm for the interest rate on term deposits attracted from the non-financial sector, 2007: 1–2017: 10.
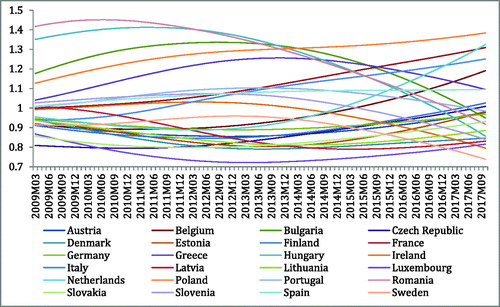
illustrates the dynamics of interest rate trajectories on term deposits attracted from the non-financial sector. On the whole, we can see that the trajectories for the 24 countries are very different. The trajectories also have many inflection points. The equilibrium point for the first convergence group is formed above the sample mean. Besides the heterogeneity of the countries that are included in this convergence group, we can see that there is also a high disparity in the dynamics of the trajectories. Thus, relative to the sample average, the trajectories have a strong downward trend for Romania, Hungary and Bulgaria, but an upward trend for Belgium, France, the Netherlands and Italy. In our view, these differences are determined by the initial levels of interest rates in the countries included in this convergence group. In Romania, Hungary and Bulgaria, the interest rates on term deposits were high. Consequently, the adjustment of interest rates to lower values was made very fast, as compared to the average of the sample. In fact, the three countries start out at the beginning of the analysis period from the highest values and end up reaching values below the sample average at the end of the study period. These observations also hold for the second and third convergence groups. For example, with regard to the second convergence group, for Greece and Portugal, the trajectory trend is strongly downward, whereas in the case of Germany, Finland and the Czech Republic the trajectory is ascending. With regard to the third convergence group, the trajectories have a downward trend for Sweden, Slovenia and Ireland and an upward trend for Austria, Denmark or Estonia. In the case of other countries – Luxembourg, Latvia or Lithuania - there is a U-shaped trend, with the lowest point reached in 2013. In fact, for most countries there is an inflection point in the period 2011–2013, which has resulted in slower or more accelerated adjustments.
Figure 4. Dynamics of interest rate trajectories on term deposits attracted from the non-financial sector.
Source: Own estimates
presents the results of the convergence algorithm for banking systems in the 24 EU Member States, using asa benchmark the interest rate for term deposits attracted from the non-financial sector.
Table 6. Cluster convergence algorithm for interest rate on term deposits attracted from households, 2007:1–2017:10.
The convergence hypothesis for all the countries included in the sample is rejected (9.68481). As a consequence, the convergence algorithm identifies three equilibrium points. The first cluster of convergence is made up of two countries in the hard core of the euro area, the Netherlands and France. The second convergence group has a mixed structure, including CEE countries, hard core of the euro area countries and periphery of the euro area countries. Testing the convergence hypothesis between the first two clusters reveals that they can form a homogeneous convergence group. The last convergence group is consistent and comprises 16 countries. The composition of the group is again heterogeneous. It is also noteworthy that the convergence speed for the three clusters is low (
), indicating only relative convergence.
shows the interest rate trajectories for the term deposits attracted from households.
Figure 5. Dynamics of interest rate trajectories on term deposits attracted from households.
Source: Own estimates
In this case also, we find disparities in the trend of trajectories. By comparing and we can see similarities in the dynamics of interest rates in some countries - Bulgaria, Romania and Hungary – for example.
At a more in-depth look, we find that the equilibrium point for the first convergence group is well above the sample’s average, which implies a slower interest rate adjustment process. The trajectories for the two countries included in the first cluster are very similar. They start out, at the beginning of the analysis period, from an average point of the sample and follow an upward trend throughout the analysis period. We notice that, after 2012, the upward trend is accelerating. The second convergence cluster tends to a point of equilibrium above the average of the sample. However, on closer look, we observe that the trajectories of the countries included in this group are different. Thus, while Romania and Bulgaria have a downward trend, Belgium, Germany, Italy and Slovakia have an upward trend. Practically, the trajectories of the two groups of countries have a mirror-like evolution. Considering the initial interest rates of the two groups (higher in Bulgaria and Romania, lower in Belgium, Germany, Italy), the faster adjustment in the two CEE countries leads to their getting closer to the values for the hard core countries. The third convergence group tends to a point of equilibrium below the sample average. Within this group we can also see differences in interest rate trajectories (for example, for Hungary, Greece, Spain and Latvia, we see a downward trend, while for the Czech Republic we see an ascending trajectory). Many countries in this cluster have a U-shaped dynamics, with the lowest point reached between 2011 and 2013 (Austria, Estonia, Luxembourg). In most cases there is a point of inflection in 2012, from which a more pronounced evolution begins. In our opinion, the sovereign debt crisis is the determinant factor for this evolution.
The results obtained by testing the convergence hypothesis in the banking systems in the European Union indicate a segmentation of the active and passive interest rates. Although the model has revealed the convergence of banking systems across multiple clusters, they still present a high level of heterogeneity. There are other important aspects further revealed through these results. First, we can see there are differences in how banks assess the non-financial sector and the households sector. Second, the composition of the clusters is different from case to case. Third, from 2011 to 2013, a period coinciding with the most severe episodes of the sovereign debt crisis, the dispersion between trajectories increases, implying a segmentation of interest rates. Hence, we can say that the integration of banking systems has been negatively influenced by the sovereign debt crisis. It should be noted that there are differences in how instability influenced interest rates. Thus, medium and short-term interest rates were more affected, as compared to long-term interest rates. For example, in the case of short-term interest rates financial tensions are more visible. Finally, for most clusters the convergence speed is relative, which does not lead to an absolute integration in the long run. In our opinion, given both the low convergence speed and the dynamics of interest rate trajectories, the composition of the clusters reflects a short-term picture valid at the end of the analysis period. Furthermore, relative convergence can also be quickly reversed.
Considering the above, as well as the hypotheses formulated at the beginning of this paper, we can state that hypothesis H1 is rejected, and hypothesis H2 is accepted.
The empirical results indicate the rejection of the convergence hypothesis for selected EU banking systems. Although the model has revealed the convergence of banking systems in the case of certain clusters, there is still a high level of heterogeneity.
4. Conclusions
The segmentation of interest rates and, implicitly, the lack of integration in the European Union are determined by several factors. First, the credit risk associated with the non-financial sector and households in the EU member countries is different. In addition, the residential and non-financial sector in the EU Member States have endogenous characteristics which determine interest rate asymmetries. Second, there is a high degree of heterogeneity in macroeconomic and financial stability (e.g. disparities in sovereign risk, public and private indebtedness) in the case of EU Member State, which is reflected in a different country risk. Third, the banks in the EU Member States operate based on regulatory and supervisory frameworks which are specific to each country. Fourthly, as far as organizational arrangements are concerned, the banking systems in the selected countries are rather different.
The lack of integration of banking systems in the European Union is a serious impediment to the convergence of the Member States. Interest rate divergence leads to disparities regarding assess borrowing costs for non-financial corporations and households, and also generates segmentation effect on real interest rates. These factors lead to diminishing the competitiveness of companies, increasing the indebtedness of companies and households and, ultimately, increasing economic, social and financial disparities between developed and developing countries. Under these circumstances, increasing integration in EU banking systems is imperative. An increased integration will lead to reduced contagion effects and to cost sharing, as well as to similar costs for companies and the population, which, in fact, operate in a single market with common rules.
We believe our findings will be useful for public authorities, decision-makers in credit institutions, managers and investors alike. Integrating banking systems in the EU should be the main concern of EU public authorities. This can be achieved through a process of legislative convergence, by strengthening and consolidating the EU's banking union, by assuming a risk-sharing mechanism and a tax transfer mechanism.
Disclosure statement
No potential conflict of interest was reported by the authors.
References
- Agénor, P. R. (2003). Benefits and costs of international financial integration: theory and facts. The World Economy, 26(8), 1089–1118.
- Arnold, I. J., & van Ewijk, S. E. (2014). A state space approach to measuring the impact of sovereign and credit risk on interest rate convergence in the euro area. Journal of International Money and Finance, 49, 340–357. doi:10.1016/j.jimonfin.2014.04.005
- Bartkowska, M., & Riedl, A. (2012). Regional convergence clubs in Europe: Identification and conditioning factors. Economic Modelling, 29(1), 22–31. doi:10.1016/j.econmod.2011.01.013
- Berben, R. P., & Jansen, J. W. (2009). Bond market and stock market integration in Europe: A smooth transition approach. Applied Economics, 41(24), 3067–3080. doi:10.1080/00036840701367572
- Caporale, G. M., & Spagnolo, N. (2012). Stock market integration between three CEECs. Journal of Economic Integration, 27(1), 115–122. doi:10.11130/jei.2012.27.1.115
- Casu, B., & Girardone, C. (2010). Integration and efficiency convergence in EU banking markets. Omega, 38(5), 260–267. doi:10.1016/j.omega.2009.08.004
- De Guevara, J. F., Maudos, J., & Pérez, F. (2007). Integration and competition in the European financial markets. Journal of International Money and Finance, 26(1), 26–45. doi:10.1016/j.jimonfin.2006.10.008
- Evans, P., Hasan, I., & Lozano-Vivas, A. (2008). Deregulation and convergence of banking: The EU experience. Finnish Economic Papers, 21(2), 104–117.
- Eyraud, L., D., Singh, B. & Sutton, (2017).” Benefits of Global and Regional Financial Integration in Latin America. IMF Working Paper, WP/17/1, International Monetary Fund. doi:10.5089/9781475568684.001
- Guesmi, K., & Nguyen, D. K. (2014). Time-varying regional integration of stock markets in Southeast Europe. Applied Economics, 46(11), 1279–1290. doi:10.1080/00036846.2013.870656
- Hobijn, B., & Franses, P. H. (2000). Asymptotically perfect and relative convergence of productivity. Journal of Applied Econometrics, 15(1), 59–81. doi:10.1002/(SICI)1099-1255(200001/02)15:1<59::AID-JAE544>3.0.CO;2-1
- Horvath, B. L., & Huizinga, H. (2015). Does the European Financial Stability Facility bail out sovereigns or banks? An event study. Journal of Money, Credit and Banking, 47(1), 177–206. doi:10.1111/jmcb.12173
- Horvath, R., & Petrovski, D. (2013). International stock market integration: Central and South Eastern Europe compared. Economic Systems, 37(1), 81–91. doi:10.1016/j.ecosys.2012.07.004
- Kılınç, D., Seven, Ü., & Yetkiner, H. (2017). Financial development convergence: New evidence for the EU. Central Bank Review, 17(2), 47–54. doi:10.1016/j.cbrev.2017.05.002
- Kenourgios, D., & Samitas, A. (2011). Equity market integration in emerging Balkan markets. Research in International Business and Finance, 25(3), 296–307. doi:10.1016/j.ribaf.2011.02.004
- Lee, K. S., & Mercurelli, F. (2014). Convergence in the Core Euro Zone under the Global Financial Crisis. Journal of Economic Integration, 29(1), 20–63. doi:10.11130/jei.2014.29.1.20
- Matousek, R., Rughoo, A., Sarantis, N., & Assaf, A. G. (2015). Bank performance and convergence during the financial crisis: Evidence from the ‘old’ European Union and Eurozone. Journal of Banking & Finance, 52, 208–216. doi:10.1016/j.jbankfin.2014.08.012
- Oplotnik, ŽJ., Vojinović, B., & Acharya, S. (2011). Cross border economic convergence and EU integration process. Lex Localis - Journal of Local Self-Government, 9(2), 179–203. doi:10.4335/9.2.181-205(2011)
- Paries, M., D., Moccero, E., Krylova, C. & Marchini, (2014).” The retail bank interest rate pass-through: The case of the euro area during the financial and sovereign debt crisis. ECB Occasional Paper Series No. 155, European Central Bank.
- Pérez, D., Fumás, V. S., & Salas, J. S. (2005). “Banking integration in Europe”. Banco de España Documentos de Trabajo, no. 0519.
- Phillips, P. C., & Sul, D. (2007). Transition modeling and econometric convergence tests. Econometrica, 75(6), 1771–1855. doi:10.1111/j.1468-0262.2007.00811.x
- Pozzi, L., & Wolswijk, G. (2012). The time-varying integration of euro area government bond markets. European Economic Review, 56(1), 36–53. doi:10.1016/j.euroecorev.2011.05.006
- Rughoo, A., & Sarantis, N. (2012). Integration in European retail banking: Evidence from savings and lending rates to non-financial corporations. Journal of International Financial Markets, Institutions and Money, 22(5), 1307–1327. doi:10.1016/j.intfin.2012.08.001
- Rughoo, A., & Sarantis, N. (2014). The global financial crisis and integration in European retail banking. Journal of Banking & Finance, 40, 28–41. doi:10.1016/j.jbankfin.2013.11.017
- Sørensen, C. K., & Werner, T. (2006). Bank interest rate pass-through in the euro area: a cross country comparison. ECB Working Paper Series No. 580, European Central Bank.
- Weill, L. (2009). Convergence in banking efficiency across European countries. Journal of International Financial Markets, Institutions and Money, 19(5), 818–833. doi:10.1016/j.intfin.2009.05.002
- Worthington, A. C., & Higgs, H. (2010). Assessing financial integration in the European Union equity markets: Panel unit root and multivariate cointegration and causality evidence. Journal of Economic Integration, 25(3), 457–479. doi:10.11130/jei.2010.25.3.457