
 ?Mathematical formulae have been encoded as MathML and are displayed in this HTML version using MathJax in order to improve their display. Uncheck the box to turn MathJax off. This feature requires Javascript. Click on a formula to zoom.
Abstract
This research incorporated virtual currency development factors into the capital asset pricing model (CAPM) and interpreted the effects of bitcoin and fin-tech on the capital market through a deduction of the portfolio theory and innovation diffusion theory (IDT) on changes to financial stocks’ value. This paper examined a total of 67,166 panel data of financial stocks in the two emerging markets of Taiwan and China between July 2016 and April 2019, presenting the following significant findings. (1) Financial stocks in Taiwan’s market are more greatly shocked by the bitcoin and interaction effect between bitcoin and fin-tech than those in China’s market. (2) Even after changing proxy variable or autocorrelation and heteroskedasticity are considered, the asymmetric shocks on financial stocks in Taiwan’s market are still great. (3) The effects of the two variables of bitcoin and interaction with fin-tech on financial stocks are consistently important as the three-factor CAPM model. (4) Transmitted by the changes in currency supply and demand as well as exchange rate volatilities, the spillover effects of virtual currencies and financial innovation indirectly change the currency multiplier of the home country, investors’ sensibility to interest rates, and balance of import and export trades and may eventually impact the gross outputs and inflation of individual economies.
1. Introduction
Bitcoin transactions have risen rapidly, and fin-tech (financial technology) formed by using block chain technology has not only attracted attention, but also gradually become the mainstream of the digital economy and influence financial markets (Barson, Citation2015; Gkillas & Katsiampa, Citation2018). In fact, the development of virtual currencies, or so-called cryptocurrencies, affects the existing financial payment systems and their applications, which can be a mixed blessing for financial stocks. The advantages are using fin-tech to change business models, employing financial innovations to win new market niches, applying the concept of distributed storage to prevent financial records from being tampered with, and having the convenience of third-party payment transactions and secret transfers via private keys. The disadvantages are that the transaction or investment models are completely changed once payments are done, and the situations of banks’ traditional spread models and earning service charges from insurers are declining; in other words, the evolution of virtual currencies may change the face of the financial industry significantly. Moreover, virtual currency development has altered the original transaction practices of investors. Some people now invest and incorporate them into portfolios to spread risk (Bouria, Hussain Shahzad, & Roubaud, Citation2019; Glaser, Zimmermann, Haferkorn, Weber, & Siering, Citation2014), and some researchers even indicated that such portfolios are efficient (Chen, Wu, & Pandey, Citation2014). Guesmi, Saadi, Abid, and Ftiti (Citation2019) indicated that bitcoin not only has significant hedging effects, but also spills over the connotation of virtual currency value changes into the commodities and corporate financial variables in the financial industry through transmission mechanisms. After investigating the statistical properties of bitcoin, Eom, Kaizoji, Kang, and Pichl (Citation2019) found that investors’ sentiment and monetary assets have significant impacts on bitcoin volatilities.
China was the place with the highest bitcoin transaction volume in the world and has quite clear specifications on bitcoin usage and financial supervision. Hence, financial innovations and third-party payments formed by using fin-tech in China are quite common, even linked to 5 G (Wang, Citation2018), and block chain applications can be seen in all walks of life. Correspondingly, Taiwan’s market does not recognize the legitimacy of bitcoin at all, and so fin-tech, block chain technology, and third-party payments are lagging behind other regions, but it is catching up. Due to different attitudes towards virtual currency development, different degrees of policy controls, and fin-tech development in these two emerging markets (Böhme, Christin, Edelman, & Moore, Citation2015), when the value of bitcoin fluctuates, will the financial stock values in these markets also change with the spillover effect of virtual currencies? Which market will be impacted more greatly? The explanation of this issue is in response to the dilemma of transmission mechanisms in the literature of Guesmi et al. (Citation2019). Moreover, in a thriving virtual currency market, both public and private sectors are committed to the development and application of block chain technology, but the financial industry adjusts slowly subject to regulations or restrictions. However, innovations in industries unrelated to finance are not affected and are highly integrated with international standards, and so more choices can be provided to consumers, which squeezes the profits of financial firms. Hence, with more common bitcoin transactions, the degree of fin-tech diffusion will go higher (Rogers, Citation1995; Citation2002), and the effects of the interaction between both on financial stocks will be greater. In consideration of future cash flow, financial stock values in different markets may produce different results. Eom et al. (Citation2019) indicated that volatilities in virtual currency returns are affected by investors’ sentiment and monetary assets, but did not explain whether virtual currency volatilities reversely affect assets in the financial market. An explanation to the second issue can supplement the study gaps of Eom et al. (Citation2019). The above questions are quite interesting, and the differences among them are worth comparing and expecting, but there is no similar discussion in the literature, thus forming the motivation of this paper. This research discusses two series of issues from the perspectives of capital asset pricing theory, portfolio theory, and innovation diffusion theory, offering significant contributions to the literature.
The remainder of this paper is organized as follows: Section 2 presents the theories and research hypotheses; Section 3 describes the research model; Section 4 integrates regression models to explore the differences of various markets; Section 5 discusses the results and presents the suggestions. Based on empirical research, the conclusions are summarized as follows: whether from changes in the value of virtual currency or the degree of interaction between the value of the virtual currency and fin-tech, the effects on the financial stocks in Taiwan’s market are greater than those in China’s market.
2. Theories and hypotheses
Virtual currency development is an important milestone of modern financial market development. In 2018, the government of the state of Ohio in the U.S. allowed using bitcoin to pay taxes. In most European countries it can be used to buy goods and transfer payments. Furthermore, some fund management companies have it as part of their portfolio to reduce system risks (Chen, Lu, Chau, & Gupta, Citation2014). Its application scope is also becoming broader, and bitcoin seems to become the synonym for any virtual currency. Böhme et al. (Citation2015) observed that bitcoin fluctuates more against the U.S. dollar than the U.S. dollar against the euro. Glaser et al. (Citation2014) also found that investors consider bitcoin as an investment target rather than other assets. In some research studies, bitcoin is considered as a negotiable security used for investment, which can increase investment portfolio performance and spread risks (Chen, Lu, et al., Citation2014; Böhme et al., Citation2015). Of course, some people have different views (Bariviera, Citation2017), and there are some in the literature that even agree that bitcoin has three traditional monetary characteristics (Yermack, Citation2013). Overall, bitcoin is expected to become the basis of physical transactions or liquidations in the future.
The New York Stock Exchange launched its Bitcoin Index (NYXBT) in 2015, and the Nasdaq Stock Market also compiled the Financial Technology Index to track changes of fin-tech firms in 2016. In the real world, research of the impacts of virtual currencies and information technology on stock prices have been pushed to another field (Bohume, Christin, Edelman, & Moore, 2015; Gkillas & Katsiampa, Citation2018; Ren & Culpan, Citation2017). By examining 7 different exchange rates between bitcoin and the currencies of major industrial countries, such as bitcoin-U.S. dollar, Chu, Nadarajah, and Chan (Citation2015) found that their statistical properties approximate a hyperbolic distribution and that there is no serial correlation and heteroskedasticity in these exchange rate quotations. 44 Ciaian, Rajcaniova, and Kancs (Citation2018) also showed that overall economic indicators influence the prices of virtual currencies, meaning that the overall economy has a causal relationship with virtual currencies. Guesmi et al. (Citation2019) used the multivariate GARCH model to examine whether bitcoin has spillover effects on the financial market. Their study presented that bitcoin volatilities affect assets or financial variables in the financial market and have significant hedging effects on assets and gold in the stock market. Moreover, bitcoin also has significant hedging effects on other investment commodities, such as petroleum, in addition to gold and stocks. Finally, they also proposed VARMA (1,1)-DCC-GJR-GARCH, the optimal volatility model, as a transmission mechanism of bitcoin to the financial market. In addition, Eom et al. (Citation2019) found that investors’ sentiment and monetary assets have significant impacts on bitcoin volatilities after examining some statistical properties of bitcoin. Bouria et al. (Citation2019) used the cross-quantilogram approach and researched the virtual currency against the Standard and Poor’s 500 Index and American stock index, finding that three virtual currencies (Bitcoin, Ripple, and Stellar) are havens for all American stock indices. The above research shows that, in the new era of the digital economy, securities pricing shall also have new evaluation models. In other words, considering bitcoin as a currency, a value investment target or a hedging tool for discussion is bound to become the focus of future research.
Traditional CAPM emphasizes that stock price changes are closely related to the system risks of home markets (Sharpe, Citation1964; Lintner, Citation1965; Black, Citation1972; Liu & Gao, Citation2019), and the arbitrage pricing theory emphasizes macroeconomic variables’ abilities to predict stock prices (Ross, Citation1976; Fama & French, Citation1993), but both models lack the factors represented by the digital economy era. Moreover, in many research studies on integration and co-movement of stock markets in the world, most Asian stock markets are affected by the U.S. market (Chow, Liu, & Niu, Citation2011). Because the bitcoin index was compiled in the U.S. market (Hileman, Citation2016), financial stocks can be affected not only by the composite stock price indices of their home countries, but also by spillover in the value of bitcoin, particularly in the regions where virtual currency transactions are brisk. Some institutions are even going to issue exchange traded funds (ETF) of virtual currencies, and thus driven by the wealth effect, portfolios are bound to readjust to take profit or to hedge (Glaser et al., Citation2014).
Based on the above discussions, virtual currencies are positive to the digital economy development (Barson, Citation2015) and can be connected with financial sector in the capital market through changes in monetary supply and demand, portfolio adjustment, cross-hedging needs, speculation, exchange rate fluctuation, and worries of high power consumption (Böhme et al., Citation2015; Bouria et al., Citation2019; Chen, Lu, et al., Citation2014; Dyhrberg, Citation2016; Glaser et al., Citation2014; Olson, Vivian, & Wohar, Citation2014; Yermack, Citation2013). As the transmission mechanisms mentioned in Guesmi et al. (Citation2019). In other words, virtual currency values are closely related to changes in financial stocks. China is the largest virtual currency transaction market in the world, and in spite of some legal restrictions on the use of bitcoin, investors are still keen to sell and buy goods related to virtual currencies. When shocks generated from changes in bitcoin’s value arrive, according to the market liquidity theory, because there are enough financial commodities related to bitcoin in China market for investors to choose from, they can hedge or profit without adjusting financial stocks (Bernstein, Citation1987), and virtual currencies have little spillover effect on financial stocks in China’s market. On the contrary, as Taiwan’s market does not recognize the legitimacy of bitcoin transactions, investors cannot adjust positions to avoid shocks through relevant commodities. Even if they can buy or sell cross-border financial goods to put on a hedge, the benefits arising from home bias cannot be offset (French and Porteba, 1991; Tesar and Werner, Citation1995). Therefore, only the positions of domestic financial stocks can be adjusted to reduce risks or increase profits, so that the spillover effect of bitcoin is great. Hence, this research infers that changes in virtual currency values will have a great positive spillover effect on stock markets that lack breadth and depth, as presented in H1.
H1: The effects of changes in virtual currency values on financial stocks in Taiwan’s market are greater than those in China’s market.
From the perspective of the innovation diffusion theory, virtual currency transactions are delivered, diffused, or spread among various members in social systems along with time (Ho, Citation2013; Rogers, Citation1995; Citation2002). With more transaction channels or volumes, discussions on private information and disturbances to relevant stock prices will increase (Antweiler & Frank, Citation2004; Ho, Citation2013; Mai, Shan, Bai, Wang, & Chiang, Citation2018), stimulating higher levels of fin-tech innovations, such as the markets of the United States, Japan, and China. However, in practice, there are also markets that only conduct fin-tech innovations such as block chain without allowing legal virtual currency transactions, such as Taiwan’s market and a minority of countries.
Are the effects from the interaction between virtual currencies and fin-tech on financial stocks good or bad? Banks are leveraged and earn profits from interest margins, by charging operating spreads with other businesses, or taking advantage of differences in foreign exchange or other charges. Block chain technology led by virtual currencies is advancing by leaps and bounds, and some consumers are no longer choosing bank-dominated accounts for transfer payments or portfolio allocations, but are turning to non-banking systems to process routine shopping or consumption, which greatly shrinks banks’ profits. Similarly, insurance expenses in the insurance industry are also declining due to block chain innovations, IoT (Internet of Things) prevalence, and the opening of online smart insurance contracts (World Economic Forum, 2015). Therefore, Brieske, Garlan, and Sielecki (Citation2016) said that fin-tech is a disruption to financial services technology, breaking the existing financial service structures, and rapidly changing suppliers and consumers (Smith & Kumar, Citation2018).
In 2016, Nasdaq listed the Financial Technology Index (KFTX) to track the constituent stocks related to fin-tech. These companies provide electronic integration trading platforms for consumers to use and to conduct financial transfers and then collect charges. They also experience adjusted stock prices with changes to future expected cash flows. When bitcoin’s value moves higher, investments that drive or use block chain technology increase, third-party payments or financial innovations without traditional finance are more common (Barson, Citation2015), incomes and cash flows in the financial industry decrease, and financial stock price performances are worse, implying that fin-tech innovations have negative effects on the values of financial stocks.
With high virtual currency transaction volumes, China’s market has vigorously developed block chain applications, and relevant commodities have grown exponentially (Wang, Citation2018). As the financial industry is restricted by many laws and regulations, the speed of financial innovation, diffusion, and adjustment of non-financial industries is actually fast (Tan & Teo, Citation2000). In this way, the profits of financial stocks will decline. In the first inference, it is believed that financial stocks will be affected by the positive spillover effect of virtual currency values. If the fin-tech factor is considered, then the interaction shall negatively affect financial stocks in the two markets. However, China’s financial market has been promoting third-party payments or block chain applications for some time; thus, according to the efficient market hypothesis (EMH), financial stocks’ values probably have reflected the above interaction effect, and even if the reflection has not occurred, the effects are less. On the contrary, Taiwan’s market neither supports to incorporate virtual currency development into financial supervision nor allows a market mechanism for third-party payments, but is only willing to carry out unidirectional fin-tech innovations. Financial stocks’ values are greatly negatively affected by asymmetric shocks, as presented in H2.
H2: Virtual currency values and the degree of fin-tech changes have greater effects on financial stocks in Taiwan’s market than those in China’s market.
3. Methodology
3.1. Data sources
The purpose of this research is to understand the effects of virtual currency development on financial stocks in two emerging markets. Herein, the virtual currency data come from the bitcoin index (NYXBT) of the New York Stock Exchange (NYSE), along with data of the fin-tech index (KFTX) from the Nasdaq Stock Market, and financial stock price data and control variables of the two emerging markets are from the Taiwan Economic Journal (TEJ).
3.2. Research subjects
This paper compares the financial stock value changes of two areas with different attitudes towards virtual currency governance in the face of the impact of financial innovation events. From 2015 to 2019, the Asian financial market has been quite stable. After the quantitative easing policy of QE was removed in the United States, the interest rates in the loan market have been stable and the risk premium has not expanded, making it a good time to observe the changes in financial stock values by virtual currency events. Bitcoin index (NYXBT) began trading in May 2015, while the fin-tech index (KFTX) was listed in July 2016 to track the stock price performance of fin-tech companies. Under the above two considerations, the study time shifted to the period between July 19, 2016 and April 30, 2019 in this paper. Thus, complete data of the two markets are obtained, and the data in the recent 3 years are taken for analysis and comparison. On this basis, after deduction of incomplete data and comparison, 67,166 data observations in total were collected as the basis for model calculation, including about 44,727 daily data observations of financial stocks in Shanghai and Shenzhen in China’s market and 22,439 daily data observations of financial stocks in Taiwan.
3.3. Research variables
The purpose of this study is to explore the impacts of the interaction between virtual currencies and fin-tech on financial stocks in different areas. In the models of this paper, the three-factor theory mode of CAPM refers to, namely, the excess rates of returns of financial stocks that are dependent variables and affected by 3 control variables, such as size, book-to-market ratio, and excess rate of return of market (Sharpe, Citation1964; Lintner, Citation1965; Black, Citation1972; Fama & French, Citation1993; Liu & Gao, Citation2019). Furthermore, the idea of using a bitcoin index and fin-tech index as independent variables came from Mayers (1972) and Chow et al. (Citation2011). Mayers (1972) introduced human capital of non-market assets into the CAPM model and found that it has a linear substitution relationship with system risks and expected return rates. Chow et al. (Citation2011) argued that the internationally compiled indices have a co-movement effect on the Asian stock market and should be considered. Based on the above reasons, the study models of this paper include 3 control variables and 2 independent variables, and the variable calculation is explained as follows.
3.3.1. Excess return on stock price ( )
)
Regarding financial stock return, the effects of ex-right or ex-dividend on common stocks were considered, and the daily return is described in EquationEq. 3-1(3-1)
(3-1) . The market’s risk-free rate
) came from overnight rate of bank sector and was subtracted from this value to obtain the excess return on stock price.
(3-1)
(3-1)
where,
the return of share i in period t,
the stock price of share i in period t,
the dividend of share i in period t,
the stock price of share i in period t-1,
the dividend of share i in period t-1, S% = dividend rate of stock, N% = cash dividend rate, and F = underwriting price per share of cash increment.
3.3.2. Company size (SIZE)
In this research, for the company size variable the natural logarithm value of the market value of financial companies during the sample period was considered as the control variable of this model, and the formula is described in 3-2.
(3-2)
(3-2)
3.3.3. Book-to-market ratio (BER)
From the book-to-market ratio, a company’s growth in the past can be seen. In this research, the natural logarithm value gained by dividing the market value by the company’s book value was considered as the control variable of this model, and the formula is described in 3-3.
(3-3)
(3-3)
where,
the net-to-market ratio of share i in period t,
the book value of share i in period t,
the market value of share i in period t.
3.3.4. Market excess return ()
The market excess return was also similarly calculated by using the arithmetic average, and the daily return was calculated and used as a control variable by comparing the market indices on the two business days before and after, and the formula is described in 3-4. The market risk-free rate ) also came from overnight rate of bank sector and was then subtracted from this value to obtain the market excess return.
(3-4)
(3-4)
where,
the return of the market index in period t,
the value of the market index stock in period t, and
the value of the market index in period t-1.
3.3.5. Bitcoin index (BI)
The New York Stock Exchange (NYSE) launched the bitcoin index (NYXBT) in May 2015, and its level value represents the dollar value of one bitcoin unit. In this paper, NYXBT index return (BI) was used as a proxy variable for virtual currencies to predict the explanatory variable of changes in financial stock values in Taiwan’s market and China’s market, as shown in EquationEq. 3-5(3-5)
(3-5) .
(3-5)
(3-5)
where, DIt: the return of digital currency index in period t,
the value of the bitcoin index in period t, and
the value of the bitcoin index in period t-1.
3.3.6. Fin-tech index (FTI)
In 2016, Nasdaq and Keefe Bruyette and Woods (KBW), an investment bank, listed the Financial Technology Index (KFTX), which covers 49 constituent stocks related to fin-tech, such as VISA, ACIW, and Paypal. In this paper, KFTX index return was used as a proxy variable for fin-tech (FTI) to predict the effects of fin-tech on financial stock values in the two emerging markets, as shown in EquationEq. 3-6(3-6)
(3-6) .
(3-6)
(3-6)
where, FTIt: the return of fin-tech index in period t,
the value of fin-tech index in period t, and
the value of fin-tech index in period t-1.
3.4. Research model
As previously mentioned, the Capital Asset Pricing Model (CAPM) takes into account that stock prices are affected by market system risks. This paper wants to closely observe the effects of virtual currency development on financial stock prices, and during the limited observation period these macroeconomic variables of daily data, such as interest rate and inflation rate, cannot show subtle changes. Therefore, from the micro-perspective, based on the three-factor model of CAPM (Fama & French, Citation1993), this paper used panel data for analysis by adding the two digital currency variables, namely bitcoin index (BI) and interaction effect between bitcoin and fin-tech (BI*FTI). The original model is shown in EquationEq. 3-7(3-7)
(3-7) .
(3-7)
(3-7)
where,
is the return of share i in period t,
the risk-free return in period t,
the market return in period t,
the company’s market capitalization of share i in period t,
the book-to-market ratio of share i in period t,
the return of bitcoin index in period t,
the return of fin-tech index in period t,
the model residual, and
is the regression coefficient of the model. The original model Equation(3-7)
(3-7)
(3-7) was then respectively used as the characteristic model for Taiwan’s market Equation(3-8)
(3-8)
(3-8) and China’s market Equation(3-9)
(3-9)
(3-9) . Relevant variables are described in Model 3-6; only
represents the characteristic model coefficient of Taiwan’s market, and
represents the characteristic model coefficient of China’s market.
(3-8)
(3-8)
(3-9)
(3-9)
This research established another two dummy variables to observe the differences between various markets: is the dummy variable of Taiwan’s market, and
is the dummy variable of China’s market. Because the panel data are either for Taiwan’s market or for China’s market, therefore,
and the two equations were further reformulated to EquationEq. 3-10
(3-10)
(3-10) to verify the two hypotheses,
(3-10)
(3-10)
4. Analysis of results
This section discusses the results of data analysis, including basic statistical analysis of all variables, correlation coefficient matrix, regression analysis, and robustness analysis.
4.1. Basic statistical analysis
There are a total of 7 main variables in this research, including market excess return (), excess return on stock price (
), company size (SIZE), book-to-market ratio (BER), bitcoin index (BI), fin-tech index (FTI), and interaction between bitcoin index and fin-tech index (BI *FTI). By statistical calculations, the mean, standard deviation (SD), median, maximum value, minimum value, kurtosis, and skewness of all variables are obtained, as shown in . According to the results in , during the sample period the excess return per stock in both Taiwan’s market and China’s market is negative. However, the mean of the book-to-market ratio in Taiwan’s market is larger than 1, while that in China’s market is smaller than 1, indicating that the financial stocks of Taiwan are mostly value stocks, while the financial stocks of China are dominated by growth stocks. The two markets are fundamentally very different. Please refer to for other values.
Table 1. Basic statistics of variables.
mainly examines the correlation between variables. As can be seen from the correlation coefficient matrix table, in Taiwan’s market the excess return per stock () is significantly and negatively correlated with book-to-market ratio (BER) and the interaction (BI*FTI) between bitcoin and fin-tech index, but is significantly and positively correlated with market excess return (
) and fin-tech index (FTI). In China’s market, the excess return per stock (
) is significantly and positively correlated with fin-tech index (FTI), company size (SIZE), and market excess return (
), but negatively correlated with book-to-market ratio (BER), bitcoin values (BI), and the interaction (BI*FTI) between bitcoin and fin-tech indices. Initially, the results of the analysis on partial data are in line with the three-factor theory and Hypothesis 1 in this paper, but the results of some data are not, which need further analysis.
Table 2. Correlation coefficient matrix of variables.
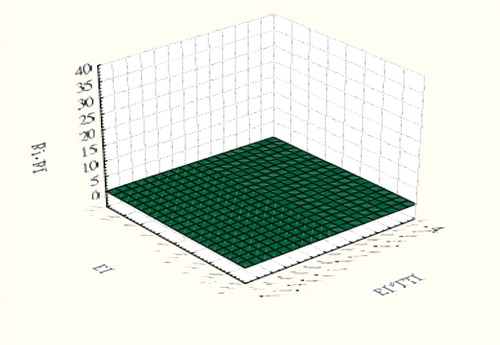
From the variable scatter plots of the two markets respectively shown in and , the excess return per stock and the market excess return of China’s market seem to fluctuate greatly. However, based on the comparative analysis on the 3 D surface plots shown in and , in China’s market the effects of changes in bitcoin values (BI) and interaction (BI*FTI) on the fluctuation of excess return on financial stocks are not as dramatic as expected, but rather smooth, which may be caused by strict financial supervision systems and appropriate coordination of relevant financial products. In contrast, Taiwan’s market does not recognize the legitimate status of bitcoin, but does accept fin-tech innovations. However, under the impact by two indices, the excess return on financial stocks seem to fluctuate more greatly than that of China’s market. This may imply the asymmetric virtual currency development environment cannot reduce market instability and reveals the possibility of Hypothetical Inference 2.
Figure 1. Variable scatter plot of Taiwan’s market.
The graphs from top left to bottom right respectively show the fluctuation trends of variables, including (), BER, (
), SIZE, BI, FTI and BI*FTI, with time in Taiwan’s market.
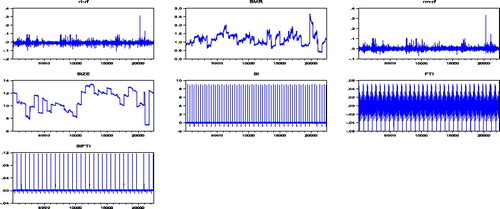
Figure 2. Variable scatter plot of China’s market.
The graphs from top left to bottom right respectively show the fluctuation trends of variables, including (), BER, (
), SIZE, BI, FTI, and BI*FTI, with time in China’s market.
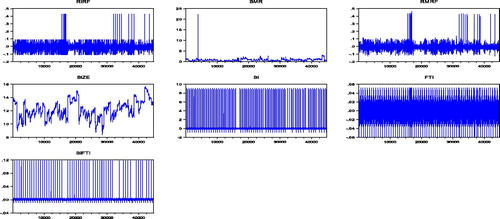
Figure 3. 3D surface plot in Taiwan's market.
This graph shows the variable relationships among (Ri -Rf ), BI and (BI*FTI) in Taiwan's market data.
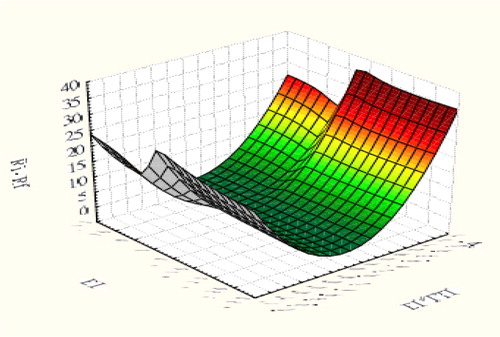
Figure 4. 3D surface plot in China's market.
This graph shows the variable relationships among (Ri -Rf ), BI and (BI*FTI) in China's market data.
From the results of the basic statistical analysis in this section, the financial stocks in China’s market and Taiwan’s market are essentially different in the face of the impacts from the digital economy. The positive attitude from authorities of China’s market towards virtual currencies has low impacts on financial stocks, while the financial stocks in Taiwan’s market have reacted in the opposite way. In other words, the spillover effects of virtual currencies or financial innovation change the values of the parent country’s financial industry through variations in currency supply and demand, portfolio adjustments, and exchange rate volatilities, which make up the transmission mechanism mentioned by Guesmi et al. (Citation2019). Under such international integration, monetary policies should be developed based on the impacts of the extensive use of virtual currencies, because the uncertainty of currency demand will increase and the multiplier effect of currency will also change, affecting the macro-control effects of the central bank and ultimately affecting gross real outputs and inflation of the entire economy. Furthermore, the changes in corporate and personal use habits will also accelerate the conversion between cash and interest-bearing assets. Overall, people would like to hold more interest-bearing assets and subsequently become more sensitive to interest rates, which facilitate the central bank’s operations in the open market.
4.2. Panel regression analysis
Before regression analysis, the specification test of Hausman (Citation1978) should be conducted to track data regression. If the results of the Hausman Test reject null hypothesis, then in this paper the fixed effect model shall be used for estimation; otherwise, the random effect model shall be used for estimation. It is found after verification of Hausman statistics that the m value of Taiwan’s market is 436.015 (p < 0.01) and that of China’s market is 485.071 (p < 0.01), and both reject the null hypothesis estimated by the random effect - namely, the fixed effect shall be selected for the regression model for the estimations.
This section discusses panel multivariate regression analysis on the causal relationship between the variables and validates H1 and H2. Based on the 6 research variables, the excess return per financial stock is taken as the dependent variable (), and the market excess return (
), company size (SIZE), book-to-market ratio (BER), bitcoin index (BI), and the interaction (BI*FTI) between bitcoin index and fin-tech index are taken as the independent variables. After panel least regression, the coefficients are shown in . In Model A, the excess return per stock (
) of Taiwan’s market is significantly and positively correlated (0.000264, p < 0.1) with bitcoin index (BI) and is significantly and negatively correlated (-0.113118, p < 0.01) with the interaction (BI*FTI). In Model B, the excess return per stock (
) of China’s market is insignificantly correlated with bitcoin index (BI) and is significantly and negatively correlated (-0.173892, p < 0.01) with the interaction (BI*FTI). The F values in the models of the two markets are significant, and the table models fit well.
Table 3. Table of regression analysis on the two markets.
The first hypothesis in this paper intended to verify the changes in virtual currency values having greater effects on financial stocks in Taiwan’s market than those in China’s market. According to the regression analysis on combined data in , the cross-term (D1*BI) of bitcoin index (BI) and the dummy variable (D1) is significantly and positively correlated (+0.001402, p < 0.01) with excess return per stock (), which supports H1. When bitcoin values change, the effects on the financial stocks in Taiwan are far greater those in China’s market. In other words, investors in Taiwan’s market avoid risks arising from virtual currencies or increase profits by adjusting the positions of financial stocks. The second hypothesis in this paper intends to prove that the interaction between virtual currency values and fin-tech changes have much greater negative effects on financial stocks in Taiwan’s market than those in China’s market. According to the cross-term (D1*BI*FTI) coefficient of the interaction (BI*FTI) between bitcoin index and fin-tech index in , there is significantly and negatively correlated with excess return per stock (
) (-0.139097, p < 0.01) - that is, Taiwan’s market does not support to incorporate virtual currency development into financial supervision, but is only willing to carry out fin-tech innovations, and its financial stocks are greatly shocked by system asymmetry, which supports H2. In terms of results, this is not optimistic.
Table 4. Table of regression analysis on combined data in the two markets.
The results of the regression analysis on panel data in this section are consistent with the inferences of the basic statistical analysis in the previous section. Under different official attitudes towards financial governance, the financial stock value changes are significantly different in China’s market and Taiwan’s market under the dual impacts of virtual currencies and financial innovation. After a long study, the attitude of China’s central bank on virtual currencies changed from previous strict regulation to positive management in October 2019. China will likely be the first country in the world to issue virtual currencies. In contrast, Taiwan’s market is not yet ready for them, and the indulgence in virtual currency volatilities and hackers’ theft of bitcoin may negatively affect the financial market of the parent country. Due to changes in corporate or personal consumption or investment ideas, it may be too late for Taiwan’s central bank to respond to the structural changes in currency demand.
4.3. Robustness analysis
In the last section, this paper explores whether the results of the simple regression analysis on the above two hypotheses are different due to different proxy variables or model estimation methods, and the data in mainly describe the results of robustness analysis on the combined data in the two markets. Regarding Model A, the main aim is to understand whether the different proxy variable influences the research results. In this research, samples were obtained after Changing proxy variable of interaction effect of the two markets. After pool regression, it is found that the values of the main research variables, such as D1*BI (+0.000278) and D1*BI*FTI (-0.021, p < 0.01), are shown in with the same directions and partial significance. The value of Model F also has a high degree of interpretation, showing that the results of H1 and H2 are quite stable without being affected by different proxy variable. Regarding Model B, as the data are from time series, it is suspected that the regression results of the consolidated tracking data may be auto-correlated. Because the Durbin-Watson statistics of the model in is 2.4387, or far away from 2, it is determined that autocorrelation exists. In addition, after the standardized residuals test of the model’s residual heteroskedasticity in , it is found in this paper that the statistical value of Jarque-Bera is 41,681,629 (p < 0.01), showing that heteroskedasticity exists in the tracking data model. For the samples covering possible changes in time series and cross-market structures, newly-west regression was readjusted for all data. From the results, the values of the main variables, such as D1*BI (+0.000686, p < 0.01) and D1*BI*FTI (-0.137242, p < 0.01), are shown in , with the same directions and significance, which also indicates that the results of H1 and H2 are established, and that the robustness of the model and that of the conclusion are good. Comprehensively, financial stocks in Taiwan’s market are more greatly shocked by virtual currency development than those in China’s market, which is worthy of reference for relevant authorities to implement policies.
Table 5. Table of robustness analysis on combined data in the two markets.
5. Conclusion and suggestions
According to the correlation of variables in , virtual currencies and the interaction term do have great positive effects on China’s capital market, which is consistent with the market intuition. However, after comparing and , we find that Chinese financial stocks do not fluctuate greatly, because sufficient breadth and depth of the market can stabilize international shocks (Bernstein, Citation1987). However, the virtual currency development environment negatively affects the financial industry, and restrictions from regulations and interruptions of the original financial service types (Brieske et al., Citation2016) dramatically shrink profits. In the past, one often hears about this, but there were no actual data to prove it. Based on the investigation in this research, the situation does exist.
This paper used models to compare two emerging Asian markets that happen to be in two different worlds for virtual currency development. Moreover, in the research, individual data were used for model estimation. It was thus difficult to infer whether the overall financial industry index is the same as that employed in this research, and thus the fallacy of composition might have been committed. In the end, this paper did not explore and did not research community comments or effect of Fin-Tech innovation, as proposed by Mai et al. (Citation2018), because it is difficult to collect social and media comments in China’s market. Lovell (Citation2019) discussed taxation, regulation, or some hidden liability issues of cryptocurrencies. Finally, the perspective of the present paper is based on the idea that financial innovation destroys the niche of the financial industry, and some other scholars emphasized that banks are the real beneficiaries of financial innovation (Molnár, Citation2018). Future research can further explore these issues.
Disclosure statement
No potential conflict of interest was reported by the authors.
References
- Antweiler, W., & Frank, M. Z. (2004). Is all that talk just noise? The information content of internet stock message boards. The Journal of Finance, 59(3), 1259–1294. doi:10.1111/j.1540-6261.2004.00662.x
- Bariviera, A. F. (2017). The inefficiency of bitcoin revisited: A dynamic approach. Economics Letters, 161, 1–4. doi:10.1016/j.econlet.2017.09.013
- Barson, M. (2015). Technological change and innovation in the financial sector. Speech to the Zhurch Business Club. Retrieved from Swiss Financial Markt. Supervisory Authority: https://www.finma.ch/en/∼/media/finma/dokumente/dokumentencenter/myfinma/finma-publikationen/referate-und-artikel/20150910-vortrag-fintech-bnm.pdf.
- Bernstein, P. L. (1987). Liquidity, stock markets, and market makers. Financial Management, 16(2) 54–62. doi:10.2307/3666004
- Black, F. (1972). Capital market equilibrium with restricted borrowing. The Journal of Business, 45(3), 444–455. doi:10.1086/295472
- Böhme, R., Christin, N., Edelman, B., & Moore, T. (2015). Bitcoin: Economics, technology, and governance. Journal of Economic Perspectives, 29(2), 213–238. doi:10.1257/jep.29.2.213
- Bouria, E., Hussain Shahzad, S. J., & Roubaud, D. (2019). Cryptocurrencies as hedges and safe-havens for US equity sectors. The Quarterly Review of Economics and Finance. doi:10.1016/j.qref.2019.05.001
- Brieske, T. D., Garlan, K., & Sielecki, M. (2016). FinTech 2.0: Creating new opportunities through strategic alliance. Deutsche Bank. https://cib.db.com/docs_new/GTB_FinTech_Whitepaper_(DB012)_A4_DIGITAL
- Chen, A., Lu, Y., Chau, P. Y., & Gupta, S. (2014). Classifying, measuring, and predicting users’ overall active behavior on social networking sites. Journal of Management Information Systems, 31(3), 213–253. doi:10.1080/07421222.2014.995557
- Chen, Y., Wu, P., & Pandey, V. K. (2014). The value of Bitcoin in enhancing the efficiency of an investor's portfolio. Journal of Financial Planning, 27(9), 44–53.
- Chow, G. C., Liu, C., & Niu, L. (2011). Co-movements of Shanghai and New York stock prices by time-varying regressions. Journal of Comparative Economics, 39(4), 577–583. doi:10.1016/j.jce.2011.06.001
- Chu, J., Nadarajah, S., & Chan, S. (2015). Satistical analysis of the exchange rate of Bitcoin. PloS One, 10(7), e0133678–27. doi:10.1371/journal.pone.0133678
- Ciaian, P., Rajcaniova, M., & Kancs, D. (2018). Virtual relationships: Short- and long-run evidence from BitCoin and altcoin markets. Journal of International Financial Markets Institutions & Money, 52, 173–195. doi:10.1016/j.intfin.2017.11.001
- Dyhrberg, A. H. (2016). Hedging capabilities of bitcoin. Is it the virtual gold? Finance Research Letters, 16(C), 139–144. doi:10.1016/j.frl.2015.10.025
- Eom, C., Kaizoji, T., Kang, S. H., & Pichl, L. (2019). Bitcoin and investor sentiment: Statistical characteristics and predictability. Physica A: Statistical Mechanics and Its Applications, 514, 511–521. doi:10.1016/j.physa.2018.09.063
- Fama, E. F., & French, K. R. (1993). Common risk factors in the returns on stocks and bonds. Journal of Financial Economics, 33(1), 3–56. doi:10.1016/0304-405X(93)90023-5
- French, K. R., & Poterba, J. M. (1991). Investor diversification and international equity market. American Economic Review, 81, 222–226.
- Gkillas, K., & Katsiampa, P. (2018). An application of extreme value theory to cryptocurrencies. Economics Letters, 164, 109–111. doi:10.1016/j.econlet.2018.01.020
- Glaser, F., Zimmermann, K., Haferkorn, M., Weber, M., & Siering, M. (2014). Bitcoin - asset or currency? Revealing users' hidden intentions. ECIS 2014, Tel Aviv.
- Guesmi, K., Saadi, S., Abid, I., & Ftiti, Z. (2019). Portfolio diversification with virtual currency: Evidence from bitcoin. International Review of Financial Analysis, 63, 431–437. doi:10.1016/j.irfa.2018.03.004
- Hausman, J. A. (1978). Specification test in econometrics. Econometrica, 46(6), 1251–1271. doi:10.2307/1913827
- Hileman, G. (2016, January 28). State of Bitcoin and Blockchain. New York, NY: Coin Desk. Retrieved from https://www.coindesk.com/state-of-bitcoinblockchain-2016/
- Ho, C. M. (2013). Private information, overconfidence and intraday trading behaviour: Empirical study of the Taiwan stock market. Applied Financial Economics, 23(4), 325–345. doi:10.1080/09603107.2012.720012
- Lintner, J. (1965). The valuation of risk assets and the selection of risky investments in stock portfolios and capital budgets. The Review of Economics and Statistics, 47(1), 13–37. doi:10.2307/1924119
- Liu, H., & Gao, Y.-C. (2019). The impact of corporate lifecycle on Fama–French three-factor model. Physica A: Statistical Mechanics and Its Applications, 513(1), 390–398. doi:10.1016/j.physa.2018.09.037
- Lovell, A. M. (2019). Avoiding liability: Changing the regulatory structure of cryptocurrencies to better ensure legal use. Iowa Law Review, 104(2), 927–955.
- Mai, F., Shan, Z., Bai, Q., Wang, X., & Chiang, R. H. L. (2018). How does social media impact bitcoin value? A test of the silent majority hypothesis. Journal of Management Information Systems, 35(1), 19–52. doi:10.1080/07421222.2018.1440774
- Mayer, D. (1972). Non-marketable assets and the determination of capital market equilibrium under uncertainty. In M. Jensen (Ed.), Studies in the theory of capital markets (pp. 223–248). New York: Praeger.
- Molnár, J. (2018). What does financial intermediation theory tell us about fintechs? Vezetéstudomány / Budapest Management Review, 49(5), 38–46. doi:10.14267/VEZTUD.2018.05.04
- Olson, E., Vivian, A., & Wohar, M. (2014). The relationship between energy and equity markets: Evidence from volatility impulse response functions. Energy Economics, 43, 297–305. doi:10.1016/j.eneco.2014.01.009
- Ren, S., & Culpan, T. (2017). Ethereum’s wild ride needs to slow. Bloomberg Businessweek, July 13.
- Rogers, E. M. (1995). Diffusion of innovations (4th ed.). New York, NY: The Free Press.
- Rogers, E. M. (2002). Diffusion of preventive innovations. Addictive Behaviors, 27(6), 989–993. doi:10.1016/S0306-4603(02)00300-3
- Ross, S. A. (1976). The arbitrage theory of capital asset pricing. Journal of Economic Theory, 13(3), 341–360. doi:10.1016/0022-0531(76)90046-6
- Sharpe, W. F. (1964). Capital asset prices: A theory of market equilibrium under conditions of risk. The Journal of Finance, 19(3), 425–442. Retrieved from http://www.jstor.org/stable/2977928 doi:10.2307/2977928
- Smith, C., & Kumar, A. (2018). Crypto-currencies - An introduction to not-so-funny moneys. Journal of Economic Surveys, 32(5), 1531–1559. doi:10.1111/joes.12289
- Tan, M., & Teo, T. (2000). Factors influencing the adoption of internet banking. Journal of the Association for Information Systems, 1(1), 1–42. doi:10.17705/1jais.00005
- Tesar, L., & Werner, I. (1995). Home bias and high turnover. Journal of International Money and Finance, 14(4), 467–493. doi:10.1016/0261-5606(95)00023-8
- Wang, J. (2018). From aperture satellite to “Internet finance”: Institutionalization of ICTs in China's financial sector since 1991. Telecommunications Policy, 42(7), 566–574. doi:10.1016/j.telpol.2018.04.004
- World Economic Forum Annual Meeting. (2015). Retrieved from https://www.weforum.org/events/world-economic-forum-annual-meeting-2015
- Yermack, D. (2013). Is bitcoin a real currency? An economic appraisal. (Working Paper Series). Cambridge, MA: National Bureau of Economic Research.