?Mathematical formulae have been encoded as MathML and are displayed in this HTML version using MathJax in order to improve their display. Uncheck the box to turn MathJax off. This feature requires Javascript. Click on a formula to zoom.
Abstract
We adopt a long-run perspective to investigate the size of the shadow economy and explore the trends in this area. The analysis is based on a panel of peripheral EMU countries over the period 1965-2015. Our empirical approach relies on a multiple indicators and multiple causes (MIMIC) framework. This approach is a variant of structural equation modelling (SEM). We used two sets of variables, (i.e. potential determinants and indicator variables) to estimate an underlying (unobserved) index that measures the evolution of the shadow economy. Ascertaining the relative importance of the shadow economy enabled analysis of its relationship with other institutional and social issues (e.g. corruption, productivity and economic growth), and helped identify the channels through which the shadow economy might negatively influence the performance of different economies. In the sampled countries, shadow activity increased over the study period. It also seemed to be affected by the economic cycle.
1. Introduction
Non-declared activities are present worldwide. Defining non-declared activities remains largely controversial in the academic literature. Despite this controversy, non-declared activities are widely considered to include all legal production and provision of goods and services that are deliberately concealed from public authorities to avoid either tax or social security contributions or to avoid meeting certain legal standards or conforming to certain administrative procedures. Whichever definition is used, common practice is to report the size of the non-declared economy as a percentage of gross domestic product (GDP). This approach enables international and intertemporal comparisons by removing units of currency.
The consensus is that the shadow economy, tax evasion and corruption cause severe damages to the economy. One argument in support of this position is the unfair (ruinous) competition that arises between the entrepreneurs in the shadow economy or those using bribes and those in the official economy who do not use bribes. Entrepreneurs in the former group obtain an advantage and can run a profitable business at the cost of those in the latter group. One common policy measure is to increase effective punishment to eradicate the shadow economy, tax evasion and corruption.
Gylys (Citation2005) listed various terms from the literature that describe underground economic activities. Such terms include non-observed, irregular, unofficial, shadow, black, grey, hidden and unobserved economy. For Schneider and Enste (Citation2000), shadow transactions take a variety of forms including household production, neighbourhood help, sales of stolen products, imperfect reporting by firms and, in particular, self-employment, gambling and drugs.
The main purpose of this paper is to investigate the drivers and estimate the relative importance of the shadow economy in four peripheral European Economic and Monetary Union (EMU) countries: Portugal, Italy, Greece and Spain. Our research adds to the literature by analysing the dynamics of the shadow economy from a long-run perspective over the period 1965 to 2015. To the best of our knowledge, it is the first study to estimate a shadow economy time series spanning five decades. A multiple indicators multiple causes (MIMIC) model was used to estimate the size and development of the shadow economy for the selected countries. This model provides insight into the relationship between cause and indicator variables and a latent variable (here, the shadow economy) based on covariance structures.
The paper is structured as follows. Section 2 provides a review of the literature and the key estimation methods that were used. Section 3 provides a brief description of the MIMIC model employed in this study. The model estimated in this study is also presented. Section 4 discusses the results. Section 5 offers some concluding remarks.
2. A brief review of the literature
2.1. Defining the underground economy
Empirical research on the size and development of the shadow economy has grown substantially in recent decades. However, there continues to be little consensus in the literature. This lack of consensus relates not only to methods that should be used to estimate the size of the shadow economy but also the estimates themselves because different empirical studies have produced vastly different estimates and patterns.
For Schneider, Buehn, and Montenegro (Citation2010), the shadow economy includes any market-based legal production of goods and services that are deliberately concealed from public authorities to avoid tax payment or social security contributions, compliance with labour market standards (minimum wages, maximum working hours, safety standards, etc.) and compliance with administrative procedures such as completing statistical questionnaires or administrative forms.
Thomas (Citation1992) divided the underground economy into four part for which statistics on the volume of activity are not entered into national accounts: households (household consumer goods), unofficial (retail producers not required to keep accounting books), irregular (illegal production of legal goods) and illegal (production of illegal goods). In the underground economy, economic actors produce legal goods and services but hide all or part of their activities from the authorities to avoid tax and other statutory payments or compliance with pertinent regulations and guidelines.
As highlighted by Tedds (Citation2005), the underground economy is not considered when making policy choices. This oversight may lead to inefficient policies because the underground economy also effectively redistributes income and wealth in ways that are not necessarily consistent with the redistribution intentions of the tax system. Further, the shortfall in reported income associated with the underground economy erodes the tax base and tax revenue.
According to some authors, the underground economy is beneficial for economic growth. For example, Dell’Anno (Citation2008) found a positive correlation between unofficial and official GDP. This empirical evidence on the procyclicality of the shadow economy supports the conclusion that the two sectors are complements rather than substitutes for Latin American countries.
2.2. Measuring the underground economy
Measuring the size of the informal economy is a demanding task. According to Tedds and Giles (Citation2002) and Tedds (2005), several modelling approaches can be found in the academic literature. These approaches rely on parameters such as the circulation of currency in the economic system, national accounts, MIMIC models and relationships between different economic variables. Dell’Anno, Gómez-Antonio, and Pardo (Citation2007) sorted the alternatives into three categories: direct methods (studies of forms of undeclared revenue), indirect methods (studies of clues from official statistics) and modelling approaches.
Effectively, six key methods have been used to estimate the size of the underground economy. They are briefly summarised here. A more detailed account can be found in Tedds and Giles (Citation2002). Schneider and Enste (Citation2000) provide a detailed discussion of the statistical techniques that the literature offers to estimate the size of the shadow economy.
In the first three approaches, measurements are based on the amount of currency in circulation in the economy. The Gutmann (Citation1977) method, or the currency ratio method, dates back to Cagan (Citation1958). This method studies the ratio of currency to deposit demand. The idea is that increases in the ratio with respect to some base year are the result of the need to hold cash for underground transactions. Tanzi (Citation1980) proposed a second method that relaxes the assumption of a constant ratio of cash to the money supply by making this ratio a function of the interest rate, per capita income, various tax variables and the share of wages in national income.
Feige (Citation1979) developed the transactions approach. This approach is based on the quantitative theory of money where M is money V is velocity, P is prices and T is total transactions. The Feige (Citation1979) transaction method examines the relationship between the total value of transactions (measured by adding currency transactions to cheque-based transactions, except purely financial ones) and measured GDP.
A fourth approach, the national accounts/judgemental method, involves no formal modelling of the underground economy. Instead, it rests on breaking down either the expenditure or income side of national accounts into its components and then applying subjective judgements as to the maximum likely levels of unrecorded incomes or expenditures.
The fifth approach is the latent variable or MIMIC model. This approach uses a structural econometric model. The application treats the size of the underground economy as an unobservable (latent) variable that is linked to a collection of (observable) indicators that reflect changes in the size of the underground economy as well as a set of (observed) causal variables that are believed to be important drivers of underground economic activity. Giles (Citation1999b) estimated the relative size of the underground economy in New Zealand over the period 1968 to 1994 using the MIMIC method. This method has also been criticised (see Breusch, Citation2005b; Dell’Anno & Schneider, Citation2006). In this study, we employ this method to estimate the size of the underground economy.
These macroeconomic measures, however, have been criticised for not being based on consumer theory and for employing flawed econometric techniques (Thomas, Citation1992). A technique developed by Dilnot and Morris (Citation1981) and modified by Pissarides and Weber (Citation1989) and Lyssiotou, Pashardes, and Stengos (Citation2004) responds to these criticisms. This expenditure-based method uses estimates of the relationship between food consumption and income (i.e. an Engel curve) to measure the size of the underground economy.
Recent approaches include those of Williams and Schneider (Citation2016), Teobaldelli and Schneider (Citation2012), Teobaldelli (Citation2011) and Schneider (2010), who analysed the influence of public institutions on the shadow economy in OECD countries. Other scholars, such as Draeseke and Giles (Citation1999), have employed a fuzzy variant of these studies.
3. Data and empirical methodology
3.1. Multiple indicators and multiple causes models
Multiple indicators and multiple causes (MIMIC) models constitute a particular type of structural equation modelling (SEM). This form of modelling, which is widely applied in psychometrics and social science research, relies on the statistical theory of unobserved or latent variables. This theory was developed in the 1970s by Zellner (Citation1970) and Jöreskog and Goldberger (Citation1975). The statistical idea behind SEM is to compare a sample covariance matrix with the parametric structure imposed upon it by a hypothesised model.
SEM offers a method to test the consistency of a structural theory using empirical data. Accordingly, it is largely confirmatory rather than exploratory. In fact, in confirmatory factor analysis, the theory is tested by examining the consistency of actual data with the hypothesised relationships between all unobserved (latent) factors and observed (measured) variables. In general, this confirmatory factor analysis has two goals: to estimate the parameters (coefficients, variances, etc.) and to assess the fit of the model.
Essentially, a latent variable is a statistical device used to summarise the data in a collection of correlated response variables. Hence, a latent variable describes the data for a set of items and reduces them to a single new measure.Footnote1 The principal goal of this model is to examine the relationship between an unobserved variable and a set of observable variables using their covariances.
There are three major reasons for using latent variable models. First, the approach is parsimonious because these models can summarise information contained in many response variables using only a few latent variables. Second, when properly specified, a latent variable model can minimise the biasing effects of measurement errors on estimating treatment effects. This property often makes this approach more accurate than a traditional version of the same analysis. Third, latent variable models investigate effects between primary conceptual variables rather than between any particular set of ordinary response variables. Consequently, a latent variable model is often viewed as more theoretically appropriate than a simpler analysis with response variables only. The MIMIC framework is based on two equations. EquationEquation (1)(1)
(1) defines the latent variable as a function of its causes:
(1)
(1)
where
encompasses the causes of the unobserved η. EquationEquation (2)
(2)
(2) describes how the y terms are congeneric measures of η:
(2)
(2)
where
are indicators of the latent variable. This framework means that the standard error may be considered a latent variable linked to a number of observable indicators (reflecting changes in the size of the standard error) as well as a set of observed causal variables, which are regarded as some of the most important determinants of unreported economic activity. Hence, the MIMIC model compares a sample covariance matrix (i.e. the covariance matrix of the observed variables) with the parametric structure imposed upon it by a hypothesised model.Footnote2
The MIMIC unobserved estimates represent relative weights. Hence, another approach is needed to normalise these estimates. Their validity depends on the reliability of this second approach. Hence, from these estimates, it is exceedingly difficult to draw statistically confirmed conclusions about the causal relationships in the real world and not only in the estimated model.
3.2. A MIMIC model for the underground economy
MIMIC modelling is a theory-based approach that can be used to confirm the influence of a set of exogenous causal variables on the latent variable (here, the shadow economy). It can also be used to analyse the effect of the shadow economy on macroeconomic indicator variables. The first scholars to apply MIMIC modelling to measure the size of the shadow economy in 17 OECD countries were Frey and Weck-Hanneman (Citation1984).
Underground economic activity is, by definition, not directly observable or reported. However, it may be assumed that shadow activities depend positively on the opportunity costs of remaining formal and negatively on the probability of detection and potential fines. The literature suggests some potentially observable causes of the underground economy. Changes in certain tax rates are thought to be one cause because they alter people’s incentives to evade paying taxes. Changes in people’s opportunities to evade taxes is another cause. Such changes may be reflected in changes in the sectors where people are employed (e.g. the growth of sectors where evasion is easier) the type of employment (e.g. shifts from paid to self-employment) or market structures (e.g. the supplanting of small shops by large stores). Changes may also occur in people’s attitudes towards the morality of cheating on their taxes. Frey and Weck-Hanneman (Citation1984) argued that the causal variables in MIMIC models are in fact determinants of hidden economic output and that it is reasonable to interpret their combined effect as a measure of the underground economy.
There is considerable theoretical and empirical agreement on the factors that determine the relative size of the underground economy. These factors include the tax burden, regulations, enforcement, labour force characteristics, trust in the government and morality. Growth in the underground economy may also reflect citizens’ dissatisfaction with public services received in exchange for taxes and hence with tax rates (Hill, Citation2002). Evasion of tax payments, in turn, lessens the government’s ability to finance public goods and services. There are also various possible indirect indicators of changes in the level of underground activity. Some studies have focused on monetary factors such as changes in cash holdings that can be linked statistically to changes in tax rates as indicators of changes in the underground economy.
Hence, the model estimated in this study, as in Tedds and Giles (Citation2002), relies on structural equation modelling. The model contains a latent variable (the underground economy) and two main sets of variables: causal variables, which affect the latent variable, and indicator variables, which represent variations in the variations of the latent variables.
3.2.1. Main causes of the shadow economy
Four causal variables were used. On the basis of both economic theory and widespread international empirical evidence, these variables are widely believed to be key drivers of underground activity, as in Giles and Caragata (Citation1998, Citation2001) or Schneider and Enste (Citation2000). The structural model, or the equation describing the relationships between the latent variable and the causes, xq, had the following components:
First, an index of self-employed people was included. This index was defined as the rate of self-employment to total employment (SER). This index captured those who are more likely to participate in the underground economy and tax evasion (a positive sign is expected).
Second, two measures were included to capture the tax burden and incentives to avoid tax payments: tax on goods or services and social security contributions, both in relation to total GDP.
Finally, the unemployment rate (UR) was included to address a relative measure of unemployment. As Alañón-Pardo and Gómez-Antonio (Citation2005) argue, the relationship between the unemployment rate and the underground economy is ambiguous.
3.2.2. Indicators of the shadow economy
The measurement model, or the system of equations that links the indicators and the unobservable variable that they intend to capture, had the following components:
The real GDP rate of growth because the literature suggests that shadow and official GDP are correlated.
A monetary measure, defined as the rate of growth of M3.
The larger the shadow economy, the more cash will be used, ceteris paribus. This cash is usually measured as or
or cash per capita outside the banking sector (see Hassan & Schneider, Citation2016; Williams & Schneider, Citation2016). Onnis and Tirelli (Citation2015) performed empirical analysis using a panel based on a panel of 43 countries for the period 1981 to 2005. They showed that variations in the relative size of the unrecorded sector have a significant negative effect on the velocity of circulation of money. Ceteris paribus, the higher the share of the shadow economy is, the higher the demand for currency will be, and the velocity of circulation of money will be lower. Official sector goods are often purchased using credit transactions, so, ceteris paribus, money velocity in the official sector should be higher than in the unrecorded sector, as in Breusch (Citation2005a, Citation2005b).
Kirchgässner (Citation2017) reported that a necessary condition for testing whether a variable x has a causal impact on variable y is that the two variables are measured independently. The MIMIC approach assumes that causal relationships exist and that, therefore, estimates are a linear combination of these (supposedly) causal variables that more or less fits several indicator variables. This linear combination is assumed to be a representation of the unknown variable shadow economy.
In summary, the first step in the MIMIC model estimation in this study was to confirm the hypothesised relationships between the shadow economy (latent variable) and its causes and indicators. Once the relationships had been identified and the parameters estimated, the MIMIC model results were used to calculate the MIMIC index. However, this analysis provided only relative not absolute estimates of the size of the shadow economy. Therefore, an additional procedure (i.e. benchmarking or calibration) was required to calculate absolute values of the size of the shadow economy. These methods include the currency demand approach and the income discrepancy method. One approach is the basic regression equation for the currency demand, as proposed by Tanzi (Citation1983):
(3)
(3)
where
and
ln denotes natural logarithms,
is the ratio of cash holdings to current and deposit accounts, TW is a weighted average tax rate (as a proxy of changes in the size of the shadow economy), WS/Y is the proportion of wages and salaries in terms of the national income (to capture changing payment and money holding patterns), rt is the interest paid on savings deposits (to capture the opportunity cost of holding cash) and Y/N is the per capita income.
Any excess increase in currency (i.e. the amount unexplained by the conventional or normal factors) is then attributed to the rising tax burden and the other reasons leading people to join the shadow economy. The first step to calculate figures for the size and development of the shadow economy is to compare the difference between the development of currency when the direct and indirect tax burden and government regulation are held at their lowest values and the development of currency when the tax burden and government regulations are held at their current (high) values. Assuming the same income velocity for currency used in the shadow economy as for legal M1 in the official economy, the size of the shadow economy can be computed and compared to official GDP. This approach is one of the most commonly used approaches. It has been applied to many OECD countries but has nevertheless been criticised on various grounds.
3.3. Data and sources
The annual data for the period 1965 to 2015 employed in this research were drawn from AMECO, World Bank and OECD databases. GDP at constant market prices (OVGD) was obtained from the AMECO database. GDP is the expenditure on final goods and services minus imports: final consumption expenditures, gross capital formation and exports less imports. Gross signifies that no deduction has been made for the depreciation of machinery, buildings and other capital products used in production. Domestic means that it is production by the resident institutional units of the country. Product refers to final goods and services, which are those that are purchased, imputed or otherwise as the end consumption of households, non-profit institutions serving households and the government; fixed assets; and exports (minus imports). GDP per capita data were measured in US dollars at current prices and purchasing power parity (PPP) prices. GDP data were measured in million US dollars at current prices and PPPs. Data were internationally comparable across countries for any single year. All OECD countries compile their data according to the 2008 System of National Accounts (SNA).
The ratio of liquid liabilities to GDP was obtained from World Bank databank.Footnote3 Liquid liabilities are also known as broad money, or M3. They are the sum of currency and deposits in the central bank (), plus transferable deposits and electronic currency (M1), plus time and savings deposits, foreign currency transferable deposits, certificates of deposit and securities repurchase agreements (M2), plus travellers’ cheques, foreign currency time deposits, commercial paper, and shares of mutual funds or market funds held by residents.
Unemployment rate is the number of unemployed people as a percentage of the labour force,Footnote4 where the latter consists of the unemployed plus those in paid or self-employment. Unemployed people are those who report that they are without work, that they are available for work and that they have taken active steps to find work in the last four weeks. When unemployment is high, some people become discouraged and stop looking for work. They are then excluded from the labour force. Therefore, the unemployment rate may fall, or stop rising, even though there has been no underlying improvement in the labour market.
Self-employment is defined as the employment of employers, workers who work for themselves, members of producers’ co-operatives and unpaid family workers.Footnote5 The latter are unpaid in the sense that they lack a formal contract to receive a fixed amount of income at regular intervals, but they share in the income generated by the enterprise. Unpaid family workers are particularly important in farming and retail trade. All persons who work in corporate enterprises, including company directors, are considered employees. Self-employment may be seen either as a survival strategy for those who cannot find any other means of earning an income or as evidence of entrepreneurial spirit and a desire to be one’s own boss. Employed people are as those aged 15 or over who report that they have worked in gainful employment for at least one hour in the previous week or who had a job but were absent from work during the reference week. This indicator is measured as a percentage of the employed population considered (total, men or women).
Tax on goods and services is defined as all taxes levied on the production, extraction, sale, transfer, leasing or delivery of goods, on the rendering of services, or on the use of goods or permission to use goods or to perform activities. They consist mainly of value added and sales taxes.Footnote6 These taxes cover multi-stage cumulative taxes; general sales taxes, whether levied at manufacture/production, wholesale or retail level; value-added taxes; excises; taxes levied on the import and export of goods; taxes levied in respect of the use of goods and taxes on permission to use goods, or perform certain activities; taxes on the extraction, processing or production of minerals and other products. This indicator relates to all government levels and is measured as a percentage of both GDP and total taxation.
Social security contributions are compulsory payments paid to general government that confer entitlement to receive a (contingent) future social benefit.Footnote7 These benefits include: unemployment insurance benefits and supplements; accident, injury and sickness benefits; old-age, disability and survivors’ pensions; family allowances; reimbursements for medical and hospital expenses or provision of hospital or medical services. Contributions may be levied on both employees and employers. Such payments are usually allocated to finance social benefits and are often paid to those institutions of general government that provide such benefits. This indicator relates to all government levels and is measured as a percentage of both GDP and total taxation.
4. Results and discussion
This section presents the results of the empirical analysis. The path for each country is presented in .
The estimated path in shows that the theoretical predictions of the model described in Subsection 3.2 are confirmed for Greece, Italy, Portugal and Spain. The tax and social security payment burden, particularly the self-employment rate, are the primary drivers of the shadow economy, closely followed by the status of the official economy. Unemployment is also a key cause of shadow economic activity. The homogeneous index for the shadow economy is plotted in .
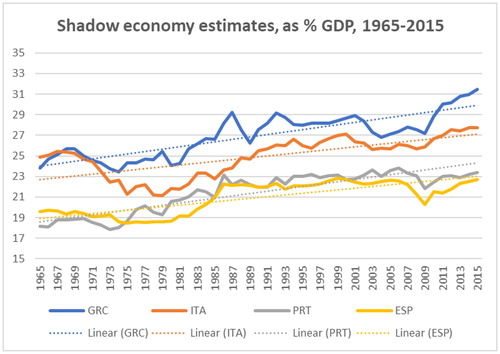
The MIMIC model is considered confirmatory rather than explanatory. The use of MIMIC (or its variant DYMIMIC) approach for investigating the size and development of the shadow economy provides relative estimates only, but it does not provide estimates of the absolute size of the shadow economy. Once the estimates from the MIMIC model have been obtained, a benchmark must be used to convert these estimates into percentage units, as described by Giles (Citation1999a). We use the estimates provided by Schneider et al. (Citation2010) for 2000 as a benchmark. Once the index obtained from the MIMIC model had been set against this benchmark, the rest of the estimated series could be found proportionally. The shadow economy estimates are presented in .
The choice of calibration procedure is one of the most controversial issues when using and evaluating (DY)MIMIC estimates of the size of the shadow economy. Overall, the estimates in indicate that the underground economy in Greece, Italy, Portugal and Spain grew steadily relative to measured GDP between 1965 and 2015. Our time series estimates also capture differences between these four countries. Portugal and Spain evolved similarly, whereas Italy, and especially Greece, had higher values and a steeper upward trend.
The results were compared with those reported in similar studies. Our study supports previous research. In particular, it extends the time series estimated in recent research (Medina & Schneider, Citation2018) as well as earlier research by Dell’Anno et al. (Citation2007). The cited scholars adopted a similar approach, but their estimations extended until 2001 only.
5. Conclusions
This paper provides fresh evidence to advance the debate on how to measure the shadow economy. We adopted a long-run perspective to analyse the dynamics of the shadow economy for the peripheral EMU countries of Portugal, Italy, Greece and Spain from 1965 to 2015. We used a multiple indicators multiple causes (MIMIC) approach. This approach involves using latent variables that are predicted by observed variables. First, it is important to establish a theoretical model to explain the relationship between the exogenous variables and the latent variable.
Our research addresses some of the limitations noted in the literature. In particular, we estimated a homogeneous model for four peripheral EMU countries (Greece, Italy, Portugal and Spain), using data for a long period (1965–2015). Despite extensive academic research on this issue, the conclusions of the studies in this area contradict one another. The lack of consistency in reported results arguably owes to many factors, including the different ways that variables have been measured, the analysis methods, and the presence or absence of control variables that might affect the relationship between the exogenous variables and the latent variable.
The results of our research may be compared to those of similar studies. Our study complements recent research by Medina and Schneider (Citation2018) and the earlier study by Dell’Anno et al. (Citation2007). The cited scholars adopted a similar approach, but their estimates extended to 2001 only.
All determinants considered in this study had the sign predicted by the theory. Shadow activity increased in Greece, Italy, Portugal and Spain from 1965 to 2015. The results reveal both similarities between Spain and Portugal and differences in the size of Italy’s and especially Greece’s shadow economies, both of which were larger.
By estimating the importance of the evolution of underground activity, we provide academics and policymakers with the means to consider this issue when designing policies. Our results can thus help improve the efficiency and equality of these policies. Notably, estimated underground activity seems greater in countries with weaker tax compliance institutions (i.e. Greece). Enste (Citation2018) argued that increasing sanctions against illicit work is ineffective at reducing the underground economy. Policies should instead focus on the causes of flight from the official economy.
These results are not free from limitations. In particular, the calibration procedure is one of the most controversial issues when using and evaluating (DY)MIMIC estimates of the size of the shadow economy. Nevertheless, our framework produces plausible results that also capture how the evolution of the shadow economy might have been affected by the global financial crisis and the subsequent economic situation.
Authors contributions
The authors contributed equally to this work.
Acknowledgements
The authors thank three anonymous referees for their comments and suggestions, as well as the participants in the 2019 INEKA Conference (Verona).
Disclosure statement
The authors declare no conflict of interest. The founding sponsors had no role in the design of the study; in the collection, analyses, or interpretation of data; in the writing of the manuscript; or in the decision to publish the results.
Additional information
Funding
Notes
1 It is often assumed that the latent variable is superordinate to the items upon which it is based.
2 For a detailed explanation of these calculation methods, see Schneider (Citation2011) and Schneider and Enste (Citation2013).
3 World Bank, Liquid Liabilities to GDP for Greece, Italy, Portugal and Spain [DDDI05ESA156NWDB], retrieved from FRED, Federal Reserve Bank of St. Louis; (Accessed 01 February 2019).
4 OECD (2019), Unemployment rate (indicator). doi: 10.1787/997c8750-en (Accessed on 01 February 2019).
5 OECD (2019), Self-employment rate (indicator). doi: 10.1787/fb58715e-en (Accessed on 01 February 2019).
6 OECD (2019), Tax on goods and services (indicator). doi: 10.1787/40b85101-en (Accessed on 26 January 2019).
7 OECD (2019), Social security contributions (indicator). doi: 10.1787/3ebfe901-en (Accessed on 26 January 2019).
References
- Alañón-Pardo, A., & Gómez-Antonio, M. (2005). Estimating the size of the shadow economy in Spain: A structural model with latent variables. Applied Economics, 37(9), 1011–1025. doi:10.1080/00036840500081788
- Breusch, T. (2005a). The Canadian underground economy: An examination of Giles and Tedds. Canadian Tax Journal, 53(2), 367.
- Breusch, T. (2005b). Estimating the underground economy using MIMIC models (Working Paper). Econometrics 0507003, University Library of Munich, Germany.
- Cagan, P. (1958). The demand for currency relative to the total money supply. Journal of Political Economy, 66(4), 303–328. doi:10.1086/258056
- Dell’Anno, R. (2008). What is the relationship between unofficial and official economy? An analysis in latin American countries. European Journal of Economics, Finance and Administrative Sciences, 12, 185–203.
- Dell’Anno, R., Gómez-Antonio, M., & Pardo, A. (2007). The shadow economy in three Mediterranean countries: France, Spain and Greece. A mimic approach. Empirical Economics, 33(1), 51–84. doi:10.1007/s00181-006-0084-3
- Dell’Anno, R., & Schneider, F. G. (2006). Estimating the underground economy by using MIMIC models: A response to T. Breusch’s critique (Tech. Rep., Working Paper 0607). Linz, Austria: Department of Economics, Johannes Kepler University of Linz.
- Dilnot, A., & Morris, C. N. (1981). What do we know about the black economy? Fiscal Studies, 2(1), 58–73. doi:10.1111/j.1475-5890.1981.tb00457.x
- Draeseke, R., & Giles, D. E. (1999). A fuzzy logic approach to modelling the underground economy. In Proceedings of the International Conference on Modelling and Simulation (Modism 99), University of Waikato, New Zealand, Vol. 2, pp. 453–458.
- Enste, D. H. (2018). The shadow economy in OECD and EU accession countries–empirical evidence for the influence of institutions, liberalization, taxation and regulation. In Size, causes and consequences of the underground economy (pp. 135–150). London: Routledge.
- Feige, E. L. (1979). How big is the irregular economy? Challenge, 22(5), 5–13. doi:10.1080/05775132.1979.11470559
- Frey, B. S., & Weck-Hanneman, H. (1984). The hidden economy as an ‘unobserved’ variable. European Economic Review, 26(1-2), 33–53. doi:10.1016/0014-2921(84)90020-5
- Giles, D. E. (1999a). Measuring the hidden economy: Implications for econometric modelling. The Economic Journal, 109(456), 370–380. doi:10.1111/1468-0297.00440
- Giles, D. E. (1999b). Modelling the hidden economy and the tax-gap in New Zealand. Empirical Economics, 24(4), 621–640. doi:10.1007/s001810050076
- Giles, D. E., & Caragata, P. J. (1998). The learning path of the hidden economy: Tax and growth effects in New Zealand (Tech. Rep.). Victoria: Department of Economics, University of Victoria.
- Giles, D. E., & Caragata, P. J. (2001). The learning path of the hidden economy: The tax burden and tax evasion in New Zealand. Applied Economics, 33(14), 1857–1867. doi:10.1080/00036840110018720
- Gutmann, P. M. (1977). The subterranean economy. Financial Analysts Journal, 33(6), 26–27. doi:10.2469/faj.v33.n6.26
- Gylys, P. (2005). Economy, anti-economy, underground economy: Conceptual and terminological problems. Ekonomika, 72, 1–11. doi:10.15388/Ekon.2011.0.927
- Hassan, M., & Schneider, F. (2016). Modelling the Egyptian shadow economy: A mimic model and a currency demand approach. Journal of Economics and Political Economy, 3(2), 309–339.
- Hill, R. (2002). The underground economy in Canada: Boom or bust. Canadian Tax Journal, 50(5), 1641–1654.
- Jöreskog, K. G., & Goldberger, A. S. (1975). Estimation of a model with multiple indicators and multiple causes of a single latent variable. Journal of the American Statistical Association, 70(351a), 631–639. doi:10.2307/2285946
- Kirchgässner, G. (2017). On estimating the size of the shadow economy. German Economic Review, 18(1), 99–111. doi:10.1111/geer.12094
- Lyssiotou, P., Pashardes, P., & Stengos, T. (2004). Estimates of the black economy based on consumer demand approaches. The Economic Journal, 114(497), 622–640. doi:10.1111/j.1468-0297.2004.00234.x
- Medina, L., & Schneider, F. (2018). Shadow economies around the world: What did we learn over the last 20 years? (IMF Working Paper No. 18/17). Washington, DC: International Monetary Fund. doi:10.5089/9781484338636.001
- Onnis, L., & Tirelli, P. (2015). Shadow economy: Does it matter for money velocity? Empirical Economics, 49(3), 839–858. doi:10.1007/s00181-015-0914-2
- Pissarides, C. A., & Weber, G. (1989). An expenditure-based estimate of Britain’s black economy. Journal of Public Economics, 39(1), 17–32. doi:10.1016/0047-2727(89)90052-2
- Schneider, F. (2010). The influence of public institutions on the shadow economy: An empirical investigation for OECD countries. Review of Law & Economics, 6(3), 441–468. doi:10.2202/1555-5879.1542
- Schneider, F. (2011). Handbook on the shadow economy. Massachusetts: Edward Elgar Publishing.
- Schneider, F., Buehn, A., & Montenegro, C. E. (2010). New estimates for the shadow economies all over the world. International Economic Journal, 24(4), 443–461. doi:10.1080/10168737.2010.525974
- Schneider, F., & Enste, D. H. (2000). Shadow economies: Size, causes, and consequences. Journal of Economic Literature, 38(1), 77–114. doi:10.1257/jel.38.1.77
- Schneider, F., & Enste, D. H. (2013). The shadow economy: An international survey. Cambridge: Cambridge University Press.
- Tanzi, V. (1980). The underground economy in the United States: Estimates and implications. PSL Quarterly Review, 33(135), 427–453.
- Tanzi, V. (1983). The underground economy in the United States: Annual estimates, 1930-80. Staff Papers - International Monetary Fund, 30(2), 283–305. doi:10.2307/3867001
- Tedds, L. M. (2005). The underground economy in Canada. In C. Bajada & F. Schneider (Eds.), Size, causes and consequences of the underground economy. An international perspective (pp. 157–178). Farnham, United Kingdom: Ashgate Publishing.
- Tedds, L. M., & Giles, D. (2002). Taxes and the Canadian underground economy (Tech. Rep.). Toronto: Canadian Tax Foundation.
- Teobaldelli, D. (2011). Federalism and the shadow economy. Public Choice, 146(3-4), 269–289. doi:10.1007/s11127-009-9590-0
- Teobaldelli, D., & Schneider, F. (2012). Beyond the veil of ignorance: The influence of direct democracy on the shadow economy CESifo Working Paper Series 3749, CESifo Group, Munich.
- Thomas, J. J. (1992). Informal economic activity. (LSE handbooks in economics). Upper Saddle River, N.J.: Prentice Hall.
- Williams, C. C., & Schneider, F. (2016). Measuring the global shadow economy: The prevalence of informal work and labour. Massachusetts: Edward Elgar Publishing.
- Zellner, A. (1970). Estimation of regression relationships containing unobservable independent variables. International Economic Review, 11(3), 441–454. doi:10.2307/2525323
Appendix A.
Tables
Table A1. Shadow economy, maximum and minimum, peripheral EMU countries (1965–2015).
Appendix B.
Figures
Figure B1. MIMIC path estimated ratio.
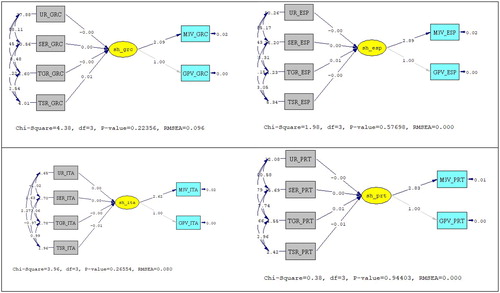
Figure B2. Shadow economy index, peripheral EMU countries (1965–2015).
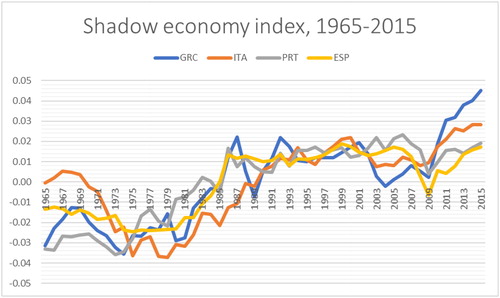
Figure B3. Shadow economy to GDP, peripheral EMU countries (1965–2015).