
Abstract
The research for this article was built upon the discussion concerning sustainable value stream mapping (Sus-VSM), which had recently emerged towards advancing sustainable manufacturing systems. Research on this sustainable-oriented lean tool has been confined to only a handful of studies only. Specifically, the lack of a continuous improvement process, where subsequent value stream developmental maps can be established to continue the cycle, is highlighted as a notable shortfall of this application. To fill the gap, this paper proposes a methodological approach, based on the DMAIC improvement cycle, to systematically implement and conduct Sus-VSM studies. The proposed methodology is practically validated with an industrial case to support this narrow body of knowledge. The research findings revealed that a DMAIC-based approach can be effectively applied to systematize the Sus-VSM towards sustainable manufacturing. The paper also provides a guiding reference for operations managers who wish to undertake similar improvement projects and make their manufacturing operations more sustainable, and, hopefully, inspire other researchers and practitioners to broaden the study of this under-researched field, which is now receiving growing interest in various industries.
1. Introduction
Riding on sustainability as its constant standard reference, manufacturing systems have undergone numerous revolutions from its initial substitution-based ‘traditional manufacturing’; the revolution began with the waste reducing ‘lean manufacturing’, followed by the environmentally-driven ‘green manufacturing’ which introduced the highly popular 3 R concept (reduce, reuse, recycle) in the 1990s, to the present-day ‘sustainable manufacturing’ which offers better stakeholder value as compared to the previous two practices through the introduction of the 6 R concept, i.e. reduce, reuse, recycle, recover, redesign, and remanufacture (Jawahir et al., Citation2006; Faulkner & Badurdeen, Citation2014).
Sustainability-driven innovations via these practices have been widely acknowledged. Innovation is identified to be highly crucial in developing sustainable manufacturing systems (Brown, Amundson, & Badurdeen, Citation2014), which in turn requires “the creation of manufactured products which use processes that minimize negative environmental impacts, conserve energy and natural resources, are safe for employees, communities, and consumers and are economically sound” (US DOC., Citation2010). Such revolution necessitates a profound knowledge of the workings of waste systems that not only incorporate time-based wastes (muda), but also those that are attributed to the environment and society. Due to the fact, a methodology was proposed by Faulkner and Badurdeen (Citation2014) which incorporates the value stream mapping (VSM) technique from lean manufacturing with added metrics to gage the sustainability of the environmental and societal impacts, thus known as Sus-VSM.
Based on relevant literature, several studies have examined the integration of additional metrics to extend the VSM, with the majority focusing on energy-related metrics (Torres & Gati, Citation2009; Kuriger & Chen, Citation2010; Dadashzadeh & Wharton, Citation2012). Others had focused on ‘sustainable’ VSM (Fearne & Norton, Citation2009; Paju et al., Citation2010), which mainly entails environmental performance. From here, it is apparent that the VSM used in analyzing green and sustainable manufacturing has not been defined properly (Duflou et al., Citation2012). In general, the lack of research on this sustainable-oriented lean tool is still considered limited (Powell, Lundeby, Chabada, & Dreyer, Citation2017; Hartini, Ciptomulyono, Anityasari, Sriyanto, & & Pudjotomo, 2018).
Apart from the above-mentioned shortcomings of the Sus-VSM, another one of its glaring weaknesses is the lack of lean practices and tools that would otherwise contribute to the utilization of cutting-edge statistical/mathematical tools, the ability to gather and utilize statistical data as a means for process control and monitoring, as well as the ability to identify lingering issues following the elimination of waste. As one of the lean tools identified to enhance sustainability performance (Brown et al., Citation2014; Faulkner & Badurdeen, Citation2014), Sus-VSM ought to be treated as the enabler of a continuous improvement process whereby following the creation of a current-state map and the accomplishment of the future-state map, ensuing future-state maps can be established to continue the cycle. Nevertheless, Prashar (Citation2017), Powell et al. (Citation2017), and Garza-Reyes, Torres Romero, Govindan, Cherrafi, and Ramanathan (Citation2018) had provided empirical evidence that such application would be more effective and efficient with the use of a systematic approach that incorporates logically and well-defined sequenced transitional stages. Hence, ‘other tools’ that could help reduce or eliminate the said shortcomings are needed.
Such ‘other tools’ may be derived from Six Sigma considering the highly compatible integration between Lean and Six Sigma (LSS) as proven by numerous studies, which were presented in the theoretical framework of this paper. Six Sigma entails a project-based approach aimed at improving process and quality of product (Ray & Das, Citation2010; Gitlow, Levine, & Popovich, Citation2006). For process improvement, Six Sigma is carried out using the DMAIC methodology (Sin, Zailani, Iranmanesh, & Ramayah, Citation2015) throughout the define, measure, analyze, improve, and control phases. Therefore, to establish a continuous cycle of improvements for the Sus-VSM, this study aims to (1) propose a sequenced approach that is logical and well-defined using the DMAIC method so that industries can carry out systematic studies on Sus-VSM and (2) present the proposed approach’s application not only for validation, but also for guiding operations managers who intend to embark on such improvement projects. This proposed methodology allows for a systematic, repetitive, and continuously improving cycle for the Sus-VSM together with the provision of uniquely characterized sequencing. Therefore, this paper contributes in filling the gap in literature concerning the use of Sus-VSM for meeting the triple bottom line requirements in sustainable manufacturing systems and supporting the Lean Six Sigma’s body of knowledge by proposing a DMAIC-based approach for systematically implementing and conducting Sus-VSM studies.
To further these purposes, this paper is organized as follows: Section 2 provides the theoretical perspectives on the under-researched domains, i.e. ‘LSS’; Section 3 presents the research methodology, entailing the proposed DMAIC-based approach to Sus-VSM; Section 4 clarifies the steps included in implementing the proposed approach through an industrial application; and, lastly, Section 5 which outlines the conclusions, limitations, and future research suggestions.
2. Literature review
In the effort to achieve sustainable-oriented operational improvement, the powerful concepts of lean manufacturing and Six Sigma have been proven to be highly efficient. The principals and tools of Six Sigma have been integrated with that of lean manufacturing to form the unified Lean Six Sigma (LSS) approach. LSS impacts positively on organizational profitability, efficiency, customer satisfaction, and quality (Cherrafi, Elfezazi, Chiarini, Mokhlis, & Benhida, Citation2016) as well as on the maximization of profit and competitiveness (Salah, Rahim, & Carretero, Citation2010; Lee, Garza-Reyes, Kumar, Rocha-Lona, & Mishra, Citation2013). This section examines the foundational theory and tools of both concepts.
2.1. Lean manufacturing
Lean manufacturing (LM) was first established for the Japan-based Toyota Production System by Taiichi Ohno and Shigeo Shingo in the 1950s (Herron & Hicks, Citation2008). It has since gained a large following by various industries worldwide, spreading the waste (muda) reduction concept (Miguélez, Errasti, & Alberto, Citation2014). In the manufacturing world today, LM is regarded as the most prominent concept due to its empirically-proven ability to improve organizational competitiveness (Hines, Holweg, & Rich, Citation2004) via the reduction of inventories and lead-times and improvement of productivity and quality (Abdul Wahab, Mukhtar, & Sulaiman, Citation2013). More and more assessments are being carried out on LM practices which are also increasingly used to facilitate the development of better sustainable manufacturing strategies (Kuriger & Chen, Citation2010 and Faulkner, Templeton, Gullett, & Badurdeen, Citation2012). Similarly, Brown et al. (Citation2014) and Faulkner and Badurdeen (Citation2014) reiterate the suitability of LM as a technique in ensuring sustainable manufacturing improvement activity. According to Womack and Jones (Citation1996) and Mason-Jones, Naylor, and Towill (Citation2000), a change in the conventional views on LM can improve organizational efficiency and effectiveness.
The considerable support towards VSM by many authors is relatively expected owing to its rising popularity, efficacy and ease in facilitating sustainable performance improvement (Gholami et al., Citation2019). In proving that VSM is the most comprehensively fitting tool to achieve continuous improvement activities, several simulations were carried out by Abdulmalek and Rajgopal (Citation2007). It was found to be impactful for waste elimination activities which facilitate in the visualization and analysis of information as well as the demonstration of value and non-value-added tasks in the mapping. Hartini et al. (Citation2018) pointed out that improvised LM tools like VSM can possibly possess a better visualization functionality of the triple bottom lines for sustainability performance assessment.
Riding on its demonstrated capabilities, VSM is currently being practiced extensively with even modified versions that integrate features of sustainability (Gholami et al., Citation2019). Several pioneering studies proposed possible VSM modifications that incorporate sustainable elements such as the SVSM or sustainable VSM by Simons and Mason (Citation2002) which focuses on enhancing product manufacturing sustainability through the analysis of GHG gas emissions. The assumption is that the sustainable elements are indirectly incorporated as a result of the economic or environmental benefits as well as social benefits that ensued. Another modified VSM is the sustainable value chain map (SVCM) developed by Fearne and Norton (Citation2009) which is a combination of the abovementioned SVSM and the sustainability metrics; the SVCM emphasizes the relationships and information flows between UK food retailers and food manufacturers.
A modified version of the value stream concept incorporating environmental aspects was developed by Wills (Citation2009) who coined it as green value stream or Environmental Value Stream Mapping (E-VSM). Another version of the E-VSM methodology incorporating the lean and environmental toolkit of the U.S. Environmental Protection Agency (EPA) was developed by Torres and Gati (Citation2009). A case study in the Brazilian sugar and alcohol manufacturing industry was used to validate this extended methodology. Meanwhile, Paju et al. (Citation2010) came up with the VSM-based Sustainable Manufacturing Mapping (SMM), which incorporates certain sustainability indicators, discrete-event simulation and lifecycle assessment. To measure the energy and environmental performance of sustainable manufacturing companies, a lean sustainable production assessment tool was proposed by Kuriger and Chen (Citation2010). A modified VSM coined as E-VSM by Kurdve et al. (Citation2011) was applied at Volvo Penta Vara and Volvo Construction Equipment Braås. An approach towards greening the functional information technology areas of companies called the Green Value Stream Mapping (GVSM) was introduced by Dadashzadeh and Wharton (Citation2012).
Proper metrics and methods are identified by Faulkner and Badurdeen (Citation2014) in the all-encompassing methodology for developing the Sustainable Value Stream Mapping (Sus-VSM). Three case studies were examined by Brown et al. (Citation2014) to validate the extent of the Sus-VSM tool’s applicability as well as its timeliness and limitations in the assessment and visualization of the sustainability performance of various manufacturing systems. Meanwhile, to improve the operations of prominent logistics firms in Monterrey, Mexico, the Sustainable Transportation Values Stream Mapping (STVSM) was introduced by Garza-Reyes, Villarreal, Kumar, and Molina Ruiz (Citation2016). Garza-Reyes et al. (Citation2018) also introduced an approach for the systematic implementation and administering of Environmental-VSM (E-VSM) studies centered on the Plan-Do-Check-Act (PDCA) improvement cycle by Deming.
Based on the studies presented above, there is a clear indication that lean tools, specifically VSM, are beneficial in addressing sustainability issues. Nevertheless, specific studies on this sustainable-oriented application are still starkly limited in comparison to the substantial number of previous studies on traditional VSM. This is exacerbated by the dearth in lean practices and tools that can gather and utilize statistical data for process control and monitoring as well as identify lingering issues following waste elimination using quality and advanced statistical/mathematical tools. An all-encompassing sustainable VSM assessment is not only able to detect the range of possible wastes/impacts in the economic, environmental and societal dimensions, but also provide a systematic approach made up of sequential transitional stages that are logical and properly defined so as to ensure an overall implementation that is effective and efficient.
2.2. Six sigma
Apart from the powerful lean approach that is primarily centered on waste (muda) elimination, another equally powerful tool is used predominantly for inconsistency (mura) elimination or process variation (Miguélez et al., Citation2014). The worldwide application of Six Sigma is testimony of its significant role in facilitating organizational success as attested by many firms. Initially introduced in the 1980s by Motorola, the concept was further developed by the likes of General Electric (GE) and AlliedSignal towards the end of the 1990s (Braunscheidel, Hamister, Suresh, & Star, Citation2011). The concept of Six Sigma has since grown in reputation and is implemented globally by numerous firms including Fortune 500 companies (Goh, Citation2002) as it significantly contributes to improvements in financial and operational performance as well as customer satisfaction by minimizing substandard products and services (Garza-Reyes, Citation2015). This therefore has garnered it the reputation of being a primary quality business tool for the 21st century (Mader, Citation2008; Pepper & Spedding, Citation2010).
Prior to this, there was no definitive outcome from associating quality management practices with financial performance (Powell et al., Citation2017). Many progressive Six Sigma firms engage financial and accounting personnel to specifically identify the financial benefits offered by Six Sigma projects (Pyzdek, Citation2014), which is a feature that distinguishes Six Sigma from other quality management methods (Pande & Holpp, Citation2002).
The implementation of Six Sigma process improvement projects relies on the DMAIC methodology (Sin et al., Citation2015), which is an acronym of the five incorporated phases namely: Define, Measure, Analyze, Improve, and Control. These are the step-by-step phases, from beginning to end, that are involved in the process of the improvement project (Wheeler, Citation2010; Satolo, Andrietta, Miguel, & Calarge, Citation2009). As identified in many studies, the effectiveness of Six Sigma is characterized by DMAIC’s structural rigorousness and discipline (Harry, Mann, De Hodgins, Hulbert, & Lacke, Citation2010). Therefore, this model provides a sequence of problem management steps utilizing quality and statistical tools, thus forming a standardized problem solving routine. According to Pyzdek (Citation2014), being a learning model, DMAIC underlines the importance of data collection and analysis even prior to its main focus of executing problem-solving and improvement initiatives. Hence, DMAIC users are provided with a decision-making and implementation platform that is based on actual and scientifically-proven facts. This is an effective alternative in achieving the maximum potential of a process improvement project (Garza-Reyes, Citation2015).
2.3. Lean six sigma
Relevant literature demonstrates the complementary nature of Six Sigma to the lean philosophy through its provision of problem management tools and know-how for identified lean issues. The combination of lean and Six Sigma have been proven to be highly effective by numerous studies (e.g. Shah, Chandrasekaran, & Linderman, Citation2008; Thomas, Barton, & Chuke-Okafor, Citation2008; Salah et al., Citation2010; Pepper & Spedding, Citation2010; Hilton & Sohal, Citation2012; Assarlind, Gremyr, & Bäckman, Citation2012; Lee et al., Citation2013; Powell et al., Citation2017), thus forming the integrated improvement method called ‘Lean Six Sigma (LSS)’. LSS improves speed by eliminating waste, and quality by reducing process variability in a simultaneous manner (Salah et al., Citation2010; Hilton & Sohal, Citation2012; Assarlind et al., Citation2012; Lee et al., Citation2013). In a survey of 2511 firms engaged in LSS-based projects, Shah et al. (Citation2008) came to the conclusion that LSS is a powerful integration tool that ensures continuous improvement. It is believed that LSS is applicable across industries and organizations, and there was a tendency by researchers to incorporate LSS throughout improvement activities (Powell et al., Citation2017).
For organizations to acquire the benefits offered by both strategies, a standard operational framework for executing LSS is an apparent necessity (Miguélez et al., Citation2014; Powell et al., Citation2017). Lean implementation is executable using several frameworks, but Six Sigma undoubtedly resorts to the DMAIC framework (Thomas et al., Citation2008; Garza-Reyes, Flint, Kumar, Antony, & Soriano-Meier, Citation2014), as previously discussed. Nevertheless, choosing the right approach for implementing LSS is always crucial in ensuring its success; therefore, before using the DMAIC approach, LSS needs to be discerned from ‘pure’ Six Sigma to direct more focus on the enhanced value-added via the introduction of basic lean mapping techniques such as VSM.
3. Methodology: proposed DMAIC-based approach to Sus-VSM
The academic literature indicated that the relationship between lean manufacturing and Six Sigma has been studied in relation to their theoretical integration, their synergies, the potential benefits of their integration in different contexts, and their impact on organizational performance. Abu, Gholami, Saman, Zakuan, and Streimikiene (Citation2019) pointed out that lean manufacturing has positive impacts on operations performance (i.e. quality enhancement, inventory reduction, better delivery and productivity as well as reduced cost), business performance (i.e. profitability, sales and customer satisfaction improvements), environmental performance, social performance and sustainable performance. Six Sigma improves the quality of processes in a project-based approach (Ray & Das, Citation2010; Gitlow et al., Citation2006). It applies tested and validated quality tools and techniques with a bottom-line that aligns with senior managers in order to enhance financial and operational performance as well as customer satisfaction by minimizing substandard products and services (Shah et al., Citation2008; Garza-Reyes, Citation2015). This indicates the likelihood of employing these approaches for sustainable manufacturing.
Since both approaches have unique features and benefits, which only more effective combinations would retain, this section is aimed to address the important question risen: “how can the two approaches be effectively combined into one system towards sustainable manufacturing?”, which were fundamentally formulated to further the research purposes. To this end, researchers such as Powell et al. (Citation2017) had incorporated VSM into the DMAIC approach to access the environmental sustainability of the food industry. Nagi and Altarazi (Citation2017) also incorporated VSM into the DMAIC approach, but with a focus on assessing the economic impact in the carpet-making process. In the studies by Bendell and Bendell (Citation2006), Thomas et al. (Citation2008), Engelund, Breum, and Friis (Citation2009) and Miguélez et al. (Citation2014), VSM and DMAIC were applied independently whereby VSM was used to identify waste whilst by DMAIC was used as the problem solving tool; meanwhile, the LSS should be applied as a systematic unified approach (Garza-Reyes, Citation2015).
In this regard, a DMAIC-based approach to the implementation of Sus-VSM was proposed to provide an effective and comprehensive method to enable the deployment of Sus-VSM studies in systematic, repeatable, and continuous cycle of improvement manner. However, the lack of research on this LSS research stream is indeed apparent. A Sus-VSM, which is a lean tool to enhance sustainability performance (Brown et al., Citation2014; Faulkner & Badurdeen, Citation2014), like the conventional VSM, involves constant implementation plans for continuous improvement at value-stream level. To be more effective, it should be considered a continuous improvement process where, based on the establishment of a current-state map and after achieving the proposed future-state map, subsequent future-state maps can be drawn to enable a continuous improvement cycle.
In this context, the use of the DMAIC model can provide Sus-VSM with a more specific and holistic project-based orientation to the implementation and achievement of lean initiatives, as, according to Garza-Reyes (Citation2015), the Six Sigma’s DMAIC methodology could be generalized as the base over which lean initiatives are implemented, managed, sustained, and improved. Consequently, this study provides a unique characteristic of sequencing and linking lean, and Six Sigma’s tools during the five phases of DMAIC, as follows. Each phase is elaborated on the clearer stages, as discussed in detail in the next section through an industrial application, so that the method can be easily followed and implemented by the practitioners and researchers.
The Define phase of DMAIC – consisting in clarifying the project’s scope, identifying the problem, and defining goals (Basu, Citation2004; Pyzdek, Citation2014; Garza-Reyes, Citation2015). It can objectively ensure selecting the right project, as, Kirkham, Garza-Reyes, Kumar, and Antony (Citation2014) pointed out that improvement projects selected objectively are more successful than those that are prioritized subjectively. Three main stages for performing this phase are taken out in this study – D1. clarifying the scope and goal, D2. identifying the sustainability metrics, and D3. defining the data collection method (see Section 4.1).
The Measure phase of DMAIC – consisting in establishing reliable/applicable metrics to help monitoring key process characteristics, the scope of the parameters considered and their performance to understand their progress towards the objectives established in the Define phase (Basu, Citation2004; Pyzdek, Citation2014). Once that wastes and their metrics have been defined, current Sus-VSM studies can be conducted to identify the sources of waste and establish the scope of the parameters, as well as their current performance (Garza-Reyes, Citation2015). As such, two main stages for implementing this phase are taken out – M1. establishing the sustainability metrics and M2. creating the current-state Sus-VSM (see Section 4.2).
The Analyze phase of DMAIC – involving in the analysis of the system in order to identify ways to reduce the gap between the current performance and the desired goals (Garza-Reyes et al., Citation2014). Thus, after creating the current Sus-VSM, the following phase in the proposed approach refers to the analysis, interpretation, and proposal of strategies for the elimination/minimization of the identified wastes. Two main stages for implementing this phase are taken out – A1. analyzing the identified wastes and A2. identifying the performance improvement opportunities/areas (see Section 4.3).
The Improve phase of DMAIC – consisting in developing the future-state Sus-VSM map, which portrays the improvements that a process’ value stream can attain by incorporating the wastes elimination/minimization approaches formulated in the previous phase. However, a future VSM depicts the ‘as-it-should-be’ state (Henrique, Freitas Rentes, Godinho Filho, & Francisco Esposposto, Citation2016). Therefore, the main stage for implementing this phase is I1. creating the future-state Sus-VSM (see Section 4.4).
The Control phase of DMAIC – involving in setting the mechanisms for ongoing monitoring and institutionalizing the improvement actions taken (Basu, Citation2004; Pyzdek, Citation2014), ensuring that all employees perform the improvement processes in a uniform manner (Garza-Reyes, Citation2015). Thus, the main stage for implementing this phase is considered to be C1. monitoring and institutionalizing the improvement actions taken (see Section 4.5).
Anderson and Kovach (Citation2014) and Vinodh, Kumar, and Vimal (Citation2014) applied the DMAIC approach and integrated the Lean Six Sigma methodology throughout the waste reduction project and observed significant improvements in terms of operational performance and lower failure rate which translates into positive sustainability impacts in general. The methodology used in this case study integrated the LM tools specifically the Sus-VSM to illustrate the value stream mapping for all the processes, activities, values and information throughout the process and to identify the potential areas for improvement and opportunities for waste reduction. The DMAIC-based approach was utilized in parallel with the Sus-VSM to further analyse the criticality and priority of the identified areas. The systematic approach and its successful application will be discussed in Section 4.
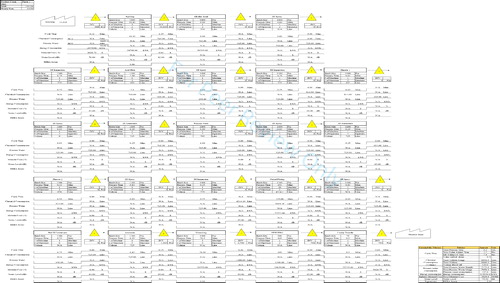
In this regard, the DMAIC approach to Sus-VSM implementation was applied in one of the hard disc drive substrate manufacturing industries in Malaysia. Specifically, the application focused on the nickel plating (EN-Plating) process that performing nickel plated on the aluminum disc, as shown in , where the EN-Plating process begins with the Racking station and ends at the Caddy Transfer station. This manufacturing process was selected due to the EN-Plating process waste, which has been listed in the first schedules waste of the environmental quality in Malaysia as Environmentally Hazardous Substance (EHS), under the Malaysian Environmental Quality Act (EQA) 1974 (Aja, Al-Kayiem, Zewge, & Joo, Citation2016). This industrial application of the proposed approach led to an empirical study, which most appropriate research methods are action research (Garza-Reyes et al., Citation2018).
Figure 1. The current-state Sus-VSM.
Source: The Authors.
The researchers have been advocated performing the action research process, which is a variation of the case study where the researcher is not an independent observer but a participant in the process, to develop and refine the DMAIC methodology within a lean improvement program (Miguélez et al., Citation2014). Therefore, and as advocated by Coughlan and Coghlan (Citation2002), the action research was evidenced to be an effective method not only to document and report the experiences and lessons learnt by the authors while carrying out the Sus-VSM but also to test it and draw conclusions regarding its effectiveness. It makes a valuable practical contribution to advancing the narrow body of knowledge on the under-researched scope.
4. Applying the proposed approach: results and discussion
4.1. Define phase
4.1.1. D1: Clarifying the scope and goal
Clear objectives and goal setting facilitate a clear and systematic pathway in any research (Chiarini & Vagnoni, Citation2015). Six Sigma begins with the Define phase, where the scope of the research is clearly determined and finalized in alignment with the problem statement. Sin et al. (Citation2015) highlighted organizational experience as the most important key for successful Six Sigma projects. Thus, team members should consist of Six Sigma and subject matter experts in the relevant scope. With the expert team established, a brainstorming session is conducted to gain the information and input required. In this sense, this study set the goal to give the Sus-VSM implementation a focal point, so as to effectively identify and measure sustainability metrics in the value stream of the EN-Plating process (see ) to then formulate and undertake suitable approaches to eliminate/minimize wastes in order to move on to the future-state.
The current project scopes out an electroless nickel plating (EN-Plating) process in one of the hard disc drive substrate manufacturing industries, which is hereafter called as ‘substrate’. EN-Plating process is used to deposit a layer of Nickel-Phosphorus layer. The coating is deposited by an auto-catalytic reaction substrate without necessarily passing an electric current through the aqueous solution. It is used extensively in several major industries, such as printed circuit boards and manufactured hard disk drives, as a way of providing an atomically smooth coating to the aluminum disks and electroplated plastics which is made possible by the development of electro less technology. The EN-Plating process has wide industrial applications owing to their excellent mechanical, physical, electrical, as well as corrosion and wear resistance properties. Other outstanding characteristics of EN-Plating include the ability to be applied on a variety of substrate materials and the ability to plate uniformly on intricate part geometries.
illustrates the detailed diagram for the EN-Plating process flow. It begins with the racking station, where the substrate is received from incoming through conveyer, and placed into a cassette box consisting of 25pcs of the substrate. At the racking station, 4 cassette equivalents to 100pcs of the substrate are transferred to 1 spindle and placed into 1 rack. 1 rack consists of 14pcs of spindle equivalent to 1400pcs of the substrate. Hence, 1 batch of the plated substrate has 1400pcs of the substrate. The racking station is fully automated except that it still requires an operator to pull the spindle from the racking station and place it in the provided rack. Once 1 batch of the substrate is completed, the rack is pulled to the Loading station to start the pre-plate process. The substrate is immersed in the pre-plate solutions which are formulated to remove oxides and soils from the surface of the substrate and to condition the surface prior to the plating operation. Pre-plate consists of 5 chemical tanks namely Alkaline clean, Acid Etch, Nitric Acid and Zincate 1 & 2. The pre-plate tanks prepare the aluminum substrate for nickel deposition and also improve the adhesion of the nickel onto the Aluminum. Then, the substrate continues to the next major process which is EN-Plating tank. In between each chemical tank, there is a spray and rinse tank to remove any chemical residues on the disks from the previous process tank and to prevent any chemicals from entering the next process tank. The overflows/dip rinse removes any chemicals from the fixtures and spindles. Once the EN-Plating process is completed, the rack is transferred to the Ammonia Hot dip rinse to neutralize the pH. Then, the rack is transferred to the Unloading station where an operator is needed to pull the rack to the Un-racking station. At the Un-racking station, all the spindles are transferred to the conveyer prior to transferring the substrate from the spindle to the cassette again. 1 spindle of the substrate is distributed to 4pcs of oven cassette which then proceed to the Post Plate Wash and oven. The oven cassette is used in this process due to its resistance to the high temperature during the oven process. Here, the plated substrate is immersed into the boat tank and spray rinsed to clean all the chemical residues from the previous EN-Plating process. The post plate Oven bakes the plated substrate and releases the stress of the substrate molecules. Once the process is completed, the cassette proceeds to the automated caddy transfer, where the oven cassette is changed to the process cassette and released to the next process. In summary, the EN-Plating process begins with the racking station and ends at the caddy transfer station ().
4.1.2. D2: Identifying the sustainability metrics
The sustainability performance of manufacturing firms is evaluated by applying the sustainability metrics (Brown et al., Citation2014; Faulkner & Badurdeen, Citation2014; Powell et al., Citation2017). Therefore, the determination of those metrics is necessary to access the sustainability performance of the under-studied process. As shown in , researchers have proposed various metrics. The choice of selecting the metrics depends on the firm’s manufacturing processes. In other words, the selected metrics must be relevant to the industry where the study is to be conducted and all metrics should fit in a map to visually depict the performance state. In this investigation, the selected metrics () are more relevant in evaluating the EN-Plating process; they are included in Sus-VSM as such.
Table 1. Summary of the recognized sustainable metrics.
4.1.3. D3: Defining the data collection method
In a VSM study, a rigorous and systematic data collection methodology needs to be defined in order to ferret out sources of waste and find ways to eliminate them. The same applies to the implementation of Sus-VSM (Faulkner & Badurdeen, Citation2014; Powell et al., Citation2017). For this project, the data collection method consisted in formulating and following a pre-established data collection plan that included the gathering of sustainable data regarding different characteristics of the value stream of the under-studied process. In particular, the data collected included characteristics, as elaborated in the next phase (see stage M1). To do this, the entire value stream of the studied EN-Plating process was followed and observed from end to start through a period of quarter monitoring using the measurement tools and facilities control devices. Data was accordingly collected and analyzed.
4.2. Measure phase
4.2.1. M1: Establishing the sustainability metrics
4.2.1.1. Economic metrics
Manufacturing cost and operational performance cost were identified, as shown in , to evaluate the economic sustainability performance. Manufacturing costs are incurred directly and indirectly during the manufacturing operations. Direct operation cost is directly contributed by the production or manufacturing of the product such as direct labor, raw materials, chemical volume, energy consumption, and waste management costs. Indirect cost involves the fixed and variable costs incurred throughout the manufacturing activity such as indirect labor cost, scrap, maintenance, jigs or fixtures, and cost of processing tools. This research considers both clusters and that suggested by Faulkner and Badurdeen (Citation2014) to measure operational performance characterized by operational efficiencies such as process lead time, productivity, and labor efficiency.
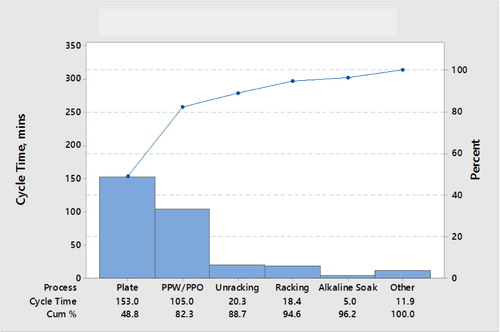
Cycle time – the EN-Plating process requires almost 8 hours to complete starting with the racking process up to the caddy transfer activity involving many work stations and movements. Through the Sus-VSM, each step in the process was noted and illustrated in the table box complete with the activity name and time consumption for each. From the time value recorded, the ratio for the value-added and non-value added activity tasks can be identified and measured known as the value added ratio (VAR). This ratio indicates the existence of non-value added activities throughout the whole process. The lower the value, the better the process would be. Ratio in lead time will be identified and observed if improvement is needed to reduce the lead time. indicates the value-added time and non-value added time as applicable metrics that need to be considered as both are required to obtain the value-added ratio. Tyagi, Choudhary, Cai, and Yang (Citation2015) and Kurdve, Shahbazi, Wendin, Bengtsson, and Wiktorsson (Citation2015) emphasized the role of the management team in performing lead time reduction activities such as site visits to the production floor. Such activity is known as the Gemba walk in the LM approach, an effective tool to gain a clear picture of the production line flow and to instantly identify any non-value added tasks. shows the Pareto chart of cycle time (mins) of the EN-Plating process which denotes that the PPW/PPO recorded the second longest cycle time compared to the other processes. illustrates the lead time studied in each process. By reducing lead time, the industry was able to reduce operational cost hence leading to economic sustainability and ensuring that the process and product produced are in optimum condition.
Figure 2. Pareto chart of cycle time (mins).
Source: The Authors.
Indirect materials costs – in this case study, the indirect materials involve the cost of chemical use in the pre-plate and plating process, grouped with several items including raw material consumption, laboratory consumable items and filter units. The values of the indirect materials are grouped and classified as material cost, focusing on the filter usage and high change frequency in the production. Each tank is installed with specific pore-sized filters to filter any foreign particles in the tank and chemical solution. The total cost of the indirect materials is about 5028.8USD as illustrated in . From data history, it is observed that about 5% of the IDMs are contributed by the filter replacement activity. Reduction of IDM cost will lead to sustainability in terms of economic productivity and efficiency whereby many improvement actions can be taken such as supplier quality, raw material evaluation and new vendor outsourcing.
4.2.1.2. Environmental metrics
In this study, the EN-plating process produces spent electro less nickel-plating solutions, stripping solutions, and rinse waters. The spent plating solutions contain substantial amounts of total soluble nickel ion (Ni + 2) and reducing and complexing agents including Metal Turnover (MTO). Rinsing activity contains metallic contaminants and other bath constituents found in the electro less bath solution. Additionally, the surface treatment industry is among the most polluted in manufacturing industries thus requiring further attention and action. Therefore, chemical consumption, processed water, and energy consumption are taken into consideration as the environmental metrics (). The following parts present the justification for selecting metrics and how each metric has been measured and analyzed through Sus-VSM.
Chemical consumption (volume) – the EN-Plating process () starts with the pretreatment process that focuses on the substrate surface treatment, whereby the solutions are formulated to remove oxides and soils from the surface of the substrate and to condition the surface prior to the plating operation. The pre-treatment process prepares the Aluminum substrate for nickel deposition and also improves the adhesion of nickel onto the Aluminum. Chemicals involved during this process consist of acidic and alkaline solutions that may create harm to the environment and humans as well. Once the pretreatment process is completed, the substrate proceeds to the EN-Plating process that uses the main chemical, i.e. Nickel solution. The nickel solutions itself actually contains a few more chemicals that need to be combined in order to make up the optimum nickel plating bath solution. The chemicals involved are Nickel, sodium hypophosphate, complexes, and stabilizers. The plating solution contains numerous chemical components that are involved in the chemical deposition of nickel from aqueous solution by strong reducing agents without the use of electric current. The plating solution contains three types of Nickel aqueous known as A, B, and D which represent the reducing agents namely sodium hypophosphite, complexing agents and stabilizer. All the components need to be maintained in proper balance for each volume mass in order to ensure excellent surface plating activity and to avoid any decomposition of the plating solution that may interrupt the nickel content in the plating bath. The EN-Plating process is also created by products that may pose environmental and social impacts such as Nickel sulphate, trophozoite, particulates, and metallic ions. Data collected through Bleed off volume monitoring by facilities team for a time of period. Average data is measured and inputted into the current-state Sus-VSM. The improvement in chemical consumption value not only gives a positive impact to the environmental, but also to the economy in general where the operational cost is also simultaneously reduced.
Process water consumption – processed water is used in spray rinses to remove any chemical residues on the substrate from the previous process tank and to prevent any chemicals from entering in the next process tank. The EN-Plating uses DI water, i.e. demineralized water where ions have been removed due to electrically charged atoms or molecules, either negative or positive, which may disrupt the reaction of chemicals during the reduction process. To collect all the measurable values for processed water, researchers have to identify the process or equipment within the scope area of which operations entail the consumption of water. Once done, the flow rate of each tank needs to be determined in order to evaluate the input and output volume apart from the usage frequency or rate for a period of time. Subsequently, the waste volume can be determined, and if necessary, the toxicity of the water can be checked. Improvement in process water consumption will also lead to economic sustainability whereby the utilities cost can be salvaged in the usage (Jiran et al., Citation2019). The final data is accordingly gathered and measured.
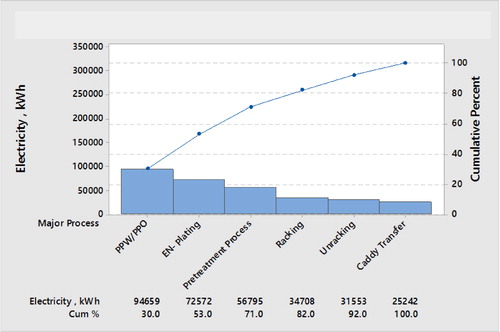
Energy consumption – energy consumption in manufacturing activities needs to be evaluate further due to its environmental impacts. Energy flows must be outlined in the VSM to illustrate the flow and relationship of the energy generated from the source to the output. Cosgrove, Rivas Duarte, Littlewood, and Wilgeroth (Citation2018) highlighted the energy flow through the VSM and successfully identified energy reduction opportunities. Energy consumption is selected as an environmental metric due to its direct relation to environmental sustainability, i.e. the usage of non-renewable resources and GHG throughout the process (Faulkner et al., Citation2012). Mikulić, Rašić Bakarić, and Slijepčević (Citation2016) tabulated the energy consumption and CO2 emission according to the energy sources, highlighting the value of 65.22 kgCO2/GJ in energy consumption. Through the Sus-VSM, researchers can identify the main contributor of energy consumption and areas for improvement by first identifying the machinery, equipment or process involved in the consumption of energy, and gathering all the energy values whether electricity or fuels. The aspects of energy usage, generation and consumption can be better understood by determining the total energy consumption for each operation. illustrates the pareto chart for energy consumption by the equipment and process involved in the case study. The major contributor will be further access on the potential of energy consumption reduction. Energy consumption by each machine has consequently been measured and inputted in the current-state Sus-VSM ().
Figure 3. Pareto chart of electricity distribution (kWh).
Source: The Authors.
4.2.1.3. Societal metrics
Due to the sustainability philosophy, which is a result of the growing awareness of the global links between mounting environmental problems, economic issues, and concerns about a healthy future for humanity, and long-term horizon (Gholami, Rezaei, Saman, Sharif, & Zakuan, Citation2016), the societal metrics have been employed by scholars, who carried out sustainability assessments with similar criteria on the importance of employees’ health and safety (Faulkner & Badurdeen, Citation2014; Veleva & Ellenbecker, Citation2001; Winroth, Almström, & Andersson, Citation2012; Shuaib et al., Citation2014). For this reason, employee noise exposure in the production area and the workload evaluated by physical load index are considered to be the key indicators in this project.
Noise level – noise is defined as unpleasant, unwanted, disturbing sounds generated from acoustic waves either in disturbance or pressure fluctuations throughout the medium/process. Occupational noise contributes 7-21% of hearing loss among workers. Nelson, Nelson, Concha-Barrientos, and Fingerhut (Citation2005), Dobie (Citation2008), and Lie et al. (Citation2016) indicated that the percentage of hearing loss among workers is slightly lower in industrialized countries than in developing countries and deemed as a critical global issue. The Department of Occupational Safety and Health Malaysia (DOSH., Citation2005) has set up industrial guidelines for controlling noise exposure to workers. In 2015, 4287 cases out of 4746 cases have been reported as occupational noise induced hearing loss (NIHL) by DOSH Malaysia. Through this case study, noise level (dB) has been mapped on each process () to illustrate the noise level distribution in the EN-plating process. Specific measurement points have been assigned for each process in order to gather accurate readings for noise level. According to OSHA (United States Occupational Safety and Health Administration) (Citation2008), the maximum noise level exposure is only 85dB for not over 8 hours. Noise level meter tools are used to easily and accurately measure industrial noise level.
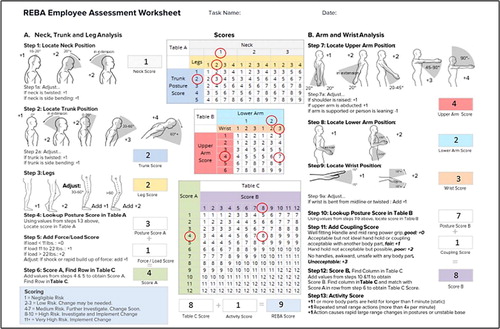
Ergonomics (physical work metric) – one of the metrics chosen for workload evaluation is physical ergonomics at the workplace carried out using various tools including Rapid Upper Limb Assessment (RULA) (Corlett, Citation2003) and Rapid Entire Body Assessment (REBA) (Hignett & McAtamney, Citation2000). The NIOSH Lifting Equation is also used for ergonomics assessment developed by the Washington State Department of Labor and Industries based on NIOSH research on the primary causes of back injuries (Waters, Putz-Anderson, & Garg, Citation1994). In this case study, ergonomic assessment is conducted on the Racking and Un-racking activity using the REBA method, which is more applicable for postural analysis involving movement activity. The rack and un-racking activity are carried out by the operator. Scores are given according to the body regions: wrists, forearms, elbows, shoulders, neck, trunk, back, legs and knees. Guidelines on scoring are illustrated in the REBA worksheet. Once the data for each region has been collected and scored, a single score is generated to represent the level of MSD (musculoskeletal disorders). MSD risk as defined by Hignett and McAtamney (Citation2000) has a scoring from negligible risk to very high risk, numbered from 1 to 11. MSD score risk level is illustrated in . The scores that are more than 11 will require mandatory improvement action. A complete REBA score has accordingly been illustrated in .
Figure 4. REBA MSD score risk level.
Source: The Authors.
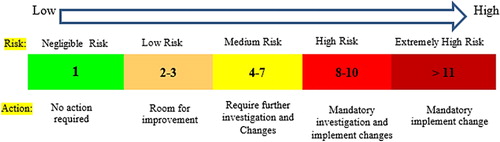
Figure 5. REBA score for the racking and un-racking activities.
Source: The Authors.
4.2.2. M2: Creating the current-state Sus-VSM
After the identification and measurement of the sustainability metrics, the following stage in the proposed approach to Sus-VSM is to create the current-state map. Throughout this project, all the data are gathered, classified and measured according to their environmental, economic, and social impacts. Faulkner and Badurdeen (Citation2014) developed the Sus-VSM for satellite disc production line by considering the impacts of cycle time, processed water consumption, raw material usage, energy consumption, physical ergonomics and safety aspects at the workplace. Many other beneficial sustainable metrics can be included to develop a more comprehensive Sus-VSM, thus producing accurate sustainability performance assessments for improvement activities. However, excessive information on the Sus-VSM may lead to wrong interpretations, redundancies and noise factors as emphasized by Brown et al. (Citation2014) and Faulkner and Badurdeen (Citation2014). Hence, comprehensive discussion, brainstorming and review session activity need among the team experts and users to finalize the suitable sustainable metrics. illustrates the current-state Sus-VSM created in this study, consisting all the information and data measured and inputted for the EN-Plating process.
4.3. Analyze phase
4.3.1. A1: Analysing the identified green wastes
Once the current-state Sus-VSM was developed, waste or any non-value added activities can be identified and measured where the process, material, and information flow from process to process, inclusive of important data and parameters can be seen over the current-state map. Processes or activities that require improvement and further analysis can thereafter be identified. In the Sus-VSM, the data box indicates the summary of all the data input for each process. For this case study, total cycle time, value added ratio, total chemical usage and consumption, processed water and energy consumption are tabulated for easy interpretation of the Sus-VSM. The noise level is also measured as average in the data box, together with the REBA value.
Sus-VSM is an advanced and comprehensive method to understand the sequence of activities and information flow as it considers all the elements required for sustainability (US EPA, 2007). To ensure its efficiency, researchers need to define the primary product or process clearly and be selective in choosing sustainable metrics for measurement, which is achievable using lean Six Sigma statistical tools such as the 5 Whys, statistical process control, control chart, Pareto chart, ANOVA and many more prior to the development of the Sus-VSM.
shows that the total time to complete the entire process of EN-Plating is about 7.4 hours with a breakdown of value-added time of 5.2 hours leading to 0.71 Value Added Ratio (VAR value) for the cycle time of 1.4, indicating the existence of considerable non-value added activities for 2.2 hours. plotted the Pareto chart for the nickel plating process cycle time to further identify the bottleneck of the whole process.
Meanwhile, about 330 Liters are Bleed off during the process every 105 plating runs per cycle. Bleed off activity is necessary to maintain the MTO (metal turn over) of the bath by removing a by-product called sodium orthophosphate. In terms of energy consumption, the EN-Plating process had utilized about 315,530 kWh of electricity. The utilization of electricity for each machine and process needs to be further analyzed so as to determine the necessary improvement activity for reducing the electricity consumption. The Sus-VSM illustrated a noise level reading of 75.92 dB for the EN-Plating process with a maximum value of 87.00 dB at the plating tank area. However, in this particular area, no employee had been assigned to perform any task except for engineering specialists who are required to perform the necessary troubleshooting upon request. Additionally, they are equipped with proper PPE and hearing aid.
From the ergonomics evaluation conducted through the REBA method, the REBA score for the racking and un-racking activity is 9, indicating a high risk of MSD thus requiring improvement activity.
4.3.2. A2: Identifying the performance improvement opportunities/areas
Interpretation of the current-state Sus-VSM map is crucial to determine the next step. The process/activity that requires further improvement action can thereafter be identified as the Sus-VSM reveals a lot of important data that translates into waste.
Another important data is the Value Added Ratio (VAR), which can be obtained by dividing the total value added, depending on which parameter is being considered, with the total non-value added. The lesser the VAR value, the better the product/process quality and the more sustainable the product/process is. The bottleneck process can be also identified, and a study can thereafter be conducted on waste reduction and improvement activity.
From the analyzed data and the current-state Sus-VSM created, the researchers can determine which area that require further attention thus improvement activity can be identified and planned out. Vinodh, Ben Ruben, and Asokan (Citation2016) and Chen, Li, and Shady (Citation2010) utilized lean six sigma tools such as 5S and Kaizen. Faulkner and Badurdeen (Citation2014) suggested the Sus-VSM as preliminary tools for improvement and proceeded with further analysis using the LSS method.
Throughout the study, areas that required improvement activities were identified i.e. cycle time and IDM cost under the economic metrics, chemical and energy consumption under the environmental metrics, and REBA score under the societal metrics. This proposed approach will simultaneously contribute to the solutions and improvement activities.
From , it is observed that PPW/PPO contributed the second longest cycle time compared to the other processes. The EN-plating recorded the longest time consumption, but this is justifiable as the process for nickel plating entails the plating parameter specifications including plating thickness, plating rate, and hardness. Thus, the cycle time for the plating process requires further research to determine the needed improvement activity.
PPW/PPO starts the process by the operator by manually loading the caddy consisting of 25 pieces of discs onto the PPW entrance conveyor. The moving conveyor will bring the caddy to the boat tank, where the caddy will be slowly immersed into the DI water for cleaning purpose. The caddy will then proceed to the spray rinse area to further clean and drop all the stains and particles that are sticking on the disc. The caddy will then continue to the oven area for drying purpose. The total time from the infeed PPW conveyor to the outfeed of the PPO takes up 105 minutes. Improvement activity shall be conducted at this area by initially cutting the processing time within the PPW/PPO and identifying the sub-area that consumes the longest time. Through this study, improvement activity can be planned and carried out to reduce the cycle time by introducing new methods for the cleaning activity or caddy arrangements, and potentially implement new technology to enhance the cleanliness of the disc by considering the effectiveness of the changes and the financial impact.
Filter change is often observed as the 5% contributor in terms of overall IDM cost and this translated to about 251.44USD for the filter change activity. The concentration has been given to the filter usage and high change frequency in the production. Further analysis on the root cause of the high change frequency should be carried out to identify whether the sources are actually coming from the wrong filter installation and usage, or the materials of the filter itself contribute to the low usage rate in production and high change frequency. If so, optimization of the filter material and outsourcing of the filter supplier will be the key to cost reduction for the IDM. Further cost breakdown and impact analysis should be brought up to make up more room for improvement.
Based on , chemical and energy consumption have been identified as the areas that require improvement activities i.e. to reduce energy consumption and to optimize the usage of chemicals and electricity. The chemical composition for nickel consists of nickel sulphate, phosphorus, stabilizer, complexer and water. In this case, the total volume of all the chemicals i.e. 8510.1 litres is used to plate the substrate, and out of that volume, about 4214 litres is the nickel composition. In the EN-Plating process, about 330 litres was bled off from the plating line in order to control the MTO level. The improvement activity can be consequently conducted in this area by working on the optimization of the nickel composition; therefore, in theory, it can be fully deposited on the alum substrate during the EN-Plating process leading to less chemical wastes.
illustrates the Pareto chart for energy consumption using the equipment involved in the case study which shows that the majority of electricity usage was contributed by the Post Plate Wash (PPW) and Post Plate Oven (PPO) which are involved in the heating and cooling of the plated substrate. PPO is set at a heating temperature of 230 °C running continuously day and night, thus potentially causing a drastic rise in energy consumption. There are opportunities to reduce the percentage of energy consumption in this area by further breaking down the electricity consumption in the sub-areas within PPW/PPO. From here, improvement activities can be planned to reduce the consumption of electricity and lead to cost optimization which is beneficial for industries in general. To this end, Jakovac (Citation2013) found that there is a bidirectional feedback in the short-run and that causality runs from energy consumption to economic growth in the long-run. However, in recent years, the above environmental issues have become determinants of a particular interest in sustainable economic growth (Obradović & Lojanica, Citation2017).
REBA score has been considered as one of the social metrics, which refers to the physical work metric (ergonomics). REBA employee assessment was conducted on the operator working at the racking and un-racking station, and a score of 9 was obtained which indicates a high risk of the activity, hence requiring further improvement (). The REBA score is divided into 2 divisions – score A and score B. Score A assesses the neck, trunk and leg while score B examines the arm and wrist.
Through the study, division B showed a higher score, thus the improvement activity should be planned as such. The operator was observed to pick up the spindle that consists of 100 pieces of discs with both hands and bending the body in order to raise the spindle, turning around and placing the spindle on the rack. This activity may lead to wrist and back pain if done repeatedly for a longer time. Therefore, further analysis in the workstation layout, operator movement and work procedure should be looked into to identify the problematic areas. The goals are to ensure that the operator is able to pick up and place the spindle easily without the need to bend any part of the body. It will reduce the potential of developing shoulder, back and arm wrist pain. A safer workplace will lead to a healthier and more conducive environment for the employees, thus impacting their attrition rate and organizational health positively. Yoon and Yoon (Citation2018) pointed out that clean capital such as human capital plays a key role in sustainable growth. It is indicated that in order to obtain a socially optimal and positive growth rate, the economy needs to redirect some of its accumulated capital towards improvement activities (Yoon & Yoon, Citation2018).
4.4. Improve phase
4.4.1. I1: Creating the future-state Sus-VSM
The current-state Sus-VSM provides the current condition for the product or process flow. It records the actual parameter setting, quantity, and volume, as well as time. From the mapping, waste and non-value added activities can be identified and measured. Future state mapping is objectively developed to illustrate the improved product or process flow after undergoing the improvement activity in the Analyze phase. Once the areas of improvement have been identified and conducted, the future-state Sus-VSM can be developed to visually represent the desired state of performance.
The continuity of the improvement activity should not be stop at this stage. Further analyse using future-state E-VSM should be conducted for continuous improvement (Kaizen activity) in order to determine either objective, scope and expected outcomes, as stated in Define phase, or require further improvements (Garza-Reyes et al., Citation2014).
4.5. Control phase
4.5.1. C1: Monitoring and institutionalizing the improvement actions taken
Establishing a complete future-state Sus-VSM map is essential for monitoring and controlling the improvement progress. The objective and goal setting constituted in the Define phase should always be referred to as this is the fundamental element that ensures the success of the lean practice deployment (Kumar & Phrommathed, Citation2006).
Statistical process control (SPC) tools may help in monitoring, controlling and sustaining the improvement activity. The control charts tools can be used to monitor critical environmental and economic parameters as selected for sustainability metrics as these tools include the control limit, minimum, maximum and average parameter monitored (Montgomery, Citation2001; Nagi & Altarazi, Citation2017). In the context of chemical volume usage monitoring and energy consumption by machine, the most appropriate control charts that to be used through Minitab software is X bar R chart, X bar S chart, Pareto diagram and Box plots charts for monitoring purposes. While graphical summary that contain histogram, boxplot and analysis of standard deviation, mean and many more parameters can be used for improvement evaluation after certain periods of time.
The formal documentation of all the improvement actions taken and best practices, as suggested by this stage of DMAIC (Montgomery, Citation2001; Pyzdek, Citation2014), will ensure that all employees perform the processes in a uniform manner (Garza-Reyes, Citation2015), which will contribute to the reduction of variability in the consumptions of the metrics considered and, thus, institutionalizing the sustainable developmental improvements in the organization. To this end, extensive empirical evidence, such as that provided by Prashar (Citation2017), Powell et al. (Citation2017), and Garza-Reyes et al. (Citation2018), suggests that a systematic approach with logically and well-defined sequenced transitional stages, such as those facilitated by the proposed DMAIC-based approach to Sus-VSM, will provide a more effective and efficient approach to institutionalize the operational improvements.
5. Conclusions
Innovation has been highlighted to be vital to achieving a sustainable manufacturing system; a system that involves not only the making of more sustainable products but also using more sustainable processes for the production of those products (Faulkner & Badurdeen, Citation2014). To this end, this paper took into careful consideration the application of sustainable VSM (Sus-VSM) developed by Faulkner and Badurdeen (Citation2014), which includes metrics to evaluate the economic, environmental, and societal sustainability performance of a manufacturing line. Investigation on this stream has been confined to a handful of studies only, this research is therefore among the very limited number of studies, which have considered this application for the sake of sustainable manufacturing.
More significantly, this study contributes to advancing the body of knowledge in the field of Lean Six Sigma (LSS) through proposing a novel DMAIC-based approach to systematize Sus-VSM. It addresses a notable shortfall in Sus-VSM by offering a continuous improvement process where, based on the establishment of a current-state Sus-VSM map and after achieving its future-state map, subsequent future-state Sus-VSM maps can be drawn to enable a continuous improvement cycle. This enables the deployment of Sus-VSM in a systematic, repeatable, and continuous cycle of improvement manner. The proposed approach was practically validated with an industrial case. Accordingly, the results of the case study revealed that a DMAIC-based approach can be effectively applied to systematize Sus-VSM towards sustainable manufacturing.
Besides the proposal of this approach, its testing, and expanding the body of knowledge in the LSS, the paper also contributes by providing a guiding reference for operations managers who may wish to undertake similar improvement projects and make the operations of their manufacturing more sustainable, and, hopefully, inspiring researchers and practitioners to broaden the study of the under-researched field, which is subject of growing interest in various industries, e.g. healthcare, services, logistics and transport, among others. However, these industrial sectors are under increasing pressure to be more sustainable and the systematic implementation of Sus-VSM can provide them with an opportunity to achieve this endeavour. It must be noted here that the chosen economic, environmental, and societal metrics are not specific to certain sectors as the development of the methodology is aimed to be generically applicable industry-wide. Certain sectors may require their own customized metrics. Further studies through additional case studies and application to other industry sectors could help create a portfolio of sustainability metrics on a sector-by-sector basis as needed. Further research to implement the Sus-VSM tool using the DMAIC-based approach to enable the development of future-state maps and additional case studies to validate the proposed methodology are also necessary. It should hereby be developed in a cumulative manner to complement and support the body of knowledge on this sustainable-oriented hybrid application.
Additional information
Funding
References
- Abu, F., Gholami, H., Saman, M. Z. M., Zakuan, N., & Streimikiene, D. (2019). The implementation of lean manufacturing in the furniture industry: A review and analysis on the motives, barriers, challenges, and the applications. Journal of Cleaner Production, 234, 660–680. doi:10.1016/j.jclepro.2019.06.279
- Abdul Wahab, A. N., Mukhtar, M., & Sulaiman, R. (2013). A conceptual model of lean manufacturing dimensions. Procedia Technology, 11, 1292–1298. doi:10.1016/j.protcy.2013.12.327
- Abdulmalek, F. A., & Rajgopal, J. (2007). Analyzing the benefits of lean manufacturing and value stream mapping via simulation: A process sector case study. International Journal of Production Economics, 107(1), 223–236. doi:10.1016/j.ijpe.2006.09.009
- Aja, O. C., Al-Kayiem, H. H., Zewge, M. G., & Joo, M. S. (2016). Overview of hazardous waste management status in Malaysia. Management of Hazardous Wastes, 69–87.
- Anderson, N. C., & Kovach, J. V. (2014). Reducing welding defects in turnaround projects: A lean six sigma case study. Quality Engineering, 26(2), 168–181. doi:10.1080/08982112.2013.801492
- Assarlind, M., Gremyr, I., & Bäckman, K. (2012). Multi-faceted views on a lean Six Sigma application. International Journal of Quality & Reliability Management, 29(1), 21–30. doi:10.1108/02656711211190855
- Azapagic, A., Stamford, L., Youds, L., & Barteczko-Hibbert, C. (2016). Towards sustainable production and consumption: A novel decision-support framework integrating economic, environmental and social sustainability (DESIRES). Computers & Chemical Engineering, 91, 93–103. doi:10.1016/j.compchemeng.2016.03.017
- Basu, R. (2004). Implementing quality: A practical guide to tools and techniques: Enabling the power of operational excellence. London: Thomson Learning.
- Bendell, T., & Bendell, T. (2006). A review and comparison of six sigma and the lean organisations. The TQM Magazine, 18(3), 255–262. doi:10.1108/09544780610659989
- Braunscheidel, M. J., Hamister, J. W., Suresh, N. C., & Star, H. (2011). An institutional theory perspective on Six Sigma adoption. International Journal of Operations & Production Management, 31(4), 423–451. doi:10.1108/01443571111119542
- Brown, A., Amundson, J., & Badurdeen, F. (2014). Sustainable value stream mapping (Sus-VSM) in different manufacturing system configurations: Application case studies. Journal of Cleaner Production, 85, 164–179. doi:10.1016/j.jclepro.2014.05.101
- Chen, J. C., Li, Y., & Shady, B. D. (2010). From value stream mapping toward a lean/sigma continuous improvement process: An industrial case study. International Journal of Production Research, 48(4), 1069–1086. doi:10.1080/00207540802484911
- Cherrafi, A., Elfezazi, S., Chiarini, A., Mokhlis, A., & Benhida, K. (2016). The integration of lean manufacturing, Six Sigma and sustainability: A literature review and future research directions for developing a specific model. Journal of Cleaner Production, 139, 828–846. doi:10.1016/j.jclepro.2016.08.101
- Chiarini, A., & Vagnoni, E. (2015). World-class manufacturing by fiat. Comparison with Toyota production system from a strategic management, management accounting, operations management and performance measurement dimension. International Journal of Production Research, 53(2), 590–606. doi:10.1080/00207543.2014.958596
- Chong, Y. T., Teo, K. M., & Tang, L. C. (2016). A lifecycle-based sustainability indicator framework for waste-to-energy systems and a proposed metric of sustainability. Renewable and Sustainable Energy Reviews, 56, 797–809. doi:10.1016/j.rser.2015.11.036
- Corlett, E. N. (2003). Rapid Upper Limb Assessment (RULA). Occupational Ergonomics: Principles of Work Design, 1(June), 9.
- Cosgrove, J., Rivas Duarte, M. J., Littlewood, J., & Wilgeroth, P. (2018). An energy mapping methodology to reduce energy consumption in manufacturing operations. Proceedings of the Institution of Mechanical Engineers, Part B: Journal of Engineering Manufacture, 232(10), 1731–1740. doi:10.1177/0954405416673101
- Coughlan, P., & Coghlan, D. (2002). Action research for operations management. International Journal of Operations & Production Management, 22(2), 220–240. doi:10.1108/01443570210417515
- Dadashzadeh, M., & Wharton, T. J. (2012). A value stream approach for greening the IT department. International Journal of Management & Information Systems (Ijmis), 16(2), 125–136. doi:10.19030/ijmis.v16i2.6912
- Deif, A. M. (2011). A system model for green manufacturing. Journal of Cleaner Production, 19(14), 1553–1559. doi:10.1016/j.jclepro.2011.05.022
- Dobie, R. A. (2008). The burdens of age-related and occupational noise-induced hearing loss in the United States. Ear and Hearing, 29(4), 565–577. doi:10.1097/AUD.0b013e31817349ec
- DOSH. (2005). Guidelines for control of occupational noise. Retrieved from http://www.dosh.gov.my/index.php/ms/list-of-documents/guidelines/industrial-hygiene-1/1416-01-guidelines-for-control-of-occupational-noise-2005/file
- Duflou, J. R., Sutherland, J. W., Dornfeld, D., Herrmann, C., Jeswiet, J., Kara, S., … Kellens, K. (2012). Towards energy and resource efficient manufacturing: A processes and systems approach. CIRP Annals, 61(2), 587–609. doi:10.1016/j.cirp.2012.05.002
- Eastlick, D. D., Sahakian, M. V., & Haapala, K. R. (2011). Sustainable manufacturing analysis for titanium components. In 23rd International Conference on Design Theory and Methodology; 16th Design for Manufacturing and the Life Cycle Conference (Vol. 9, pp. 711–719). doi:10.1115/DETC2011-48854
- Eastwood, M. D., & Haapala, K. R. (2015). A unit process model based methodology to assist product sustainability assessment during design for manufacturing. Journal of Cleaner Production, 108, 54–64.
- Egilmez, G., Kucukvar, M., & Tatari, O. (2013). Sustainability assessment of U.S. manufacturing sectors: An economic input output-based frontier approach. Journal of Cleaner Production, 53, 91–102. doi:10.1016/j.jclepro.2013.03.037
- Engelund, E. H., Breum, G., & Friis, A. (2009). Optimisation of large-scale food production using Lean Manufacturing principles. Journal of Foodservice 20(1), 4–14. doi:10.1111/j.1748-0159.2008.00109.x
- Faulkner, W., & Badurdeen, F. (2014). Sustainable Value Stream Mapping (Sus-VSM): Methodology to visualize and assess manufacturing sustainability performance. Journal of Cleaner Production, 85, 8–18. doi:10.1016/j.jclepro.2014.05.042
- Faulkner, W., Templeton, W., Gullett, D., & Badurdeen, F. (2012, February). Visualizing sustainability performance of manufacturing systems using sustainable value stream mapping (Sus-VSM). In Proceedings of the 2012 International Conference on Industrial Engineering and Operations Management (pp. 815–824). Istanbul, Turkey.
- Fearne, A., & Norton, A. (2009). Sustainable value stream mapping in the food industry. In K. Waldron (Ed.), Handbook of waste management and co-product recovery in food processing. (pp. 3–22) Cambridge: Woodhead Publishing.
- Gao, Q., Lizarazo-Adarme, J., Paul, B. K., & Haapala, K. R. (2016). An economic and environmental assessment model for microchannel device manufacturing: Part 2 - Application. Journal of Cleaner Production, 120, 146–156. doi:10.1016/j.jclepro.2015.04.141
- Garza-Reyes, J. A. (2015). Green lean and the need for Six Sigma. International Journal of Lean Six Sigma, 6(3), 226–248. doi:10.1108/IJLSS-04-2014-0010
- Garza-Reyes, A. J., Flint, A., Kumar, V., Antony, J., & Soriano-Meier, H. (2014). A DMAIRC approach to lead time reduction in an aerospace engine assembly process. Journal of Manufacturing Technology Management, 25(1), 27–48. doi:10.1108/JMTM-05-2012-0058
- Garza-Reyes, J. A., Torres Romero, J., Govindan, K., Cherrafi, A., & Ramanathan, U. (2018). A PDCA-based approach to Environmental Value Stream Mapping (E-VSM). Journal of Cleaner Production, 180, 335–348. doi:10.1016/j.jclepro.2018.01.121
- Garza-Reyes, J. A., Villarreal, B., Kumar, V., & Molina Ruiz, P. (2016). Lean and Green in the transport and logistics sector e a case study of simultaneous deployment. Production Planning & Control, 27(15), 1221–1232. doi:10.1080/09537287.2016.1197436
- Gholami, H., Jamil, N., Zakuan, N., Saman, M. Z. M., Sharif, S., Awang, S. R., & Sulaiman, Z. (2019). Social Value Stream Mapping (Socio-VSM): Methodology to societal sustainability visualization and assessment in the manufacturing system. IEEE Access, 7, 131638–131648. doi:10.1109/ACCESS.2019.2940957
- Gholami, H., Rezaei, G., Saman, M. Z. M., Sharif, S., & Zakuan, N. (2016). State-of-the-art Green HRM System: Sustainability in the sports center in Malaysia using a multi-methods approach and opportunities for future research. Journal of Cleaner Production, 124, 142–163. doi:10.1016/j.jclepro.2016.02.105
- Gitlow, H., Levine, D., & Popovich, E. (2006). Design for six sigma for green belts and champions. Upper Saddle River, NJ: Prentice-Hall.
- Goh, T. N. (2002). A strategic assessment of six sigma. Quality and Reliability Engineering International, 18(5), 403–410. doi:10.1002/qre.491
- Harry, M. J., Mann, P. S., De Hodgins, O. C., Hulbert, R. L., & Lacke, C. J. (2010). Practitioner’s guide to statistics and lean six sigma for process improvements. New York, NY: John Wiley & Sons.
- Hartini, S., Ciptomulyono, U., Anityasari, M., & Sriyanto, & Pudjotomo, D. (2018). Sustainable-value stream mapping to evaluate sustainability performance: Case study in an Indonesian furniture company. MATEC Web of Conferences, 154, 01055. doi:10.1051/matecconf/201815401055
- Henrique, D., Freitas Rentes, A., Godinho Filho, M., & Francisco Esposposto, K. (2016). A new value stream mapping approach for healthcare environments. Production Planning & Control, 27(1), 24–48. doi:10.1080/09537287.2015.1051159
- Herron, C., & Hicks, C. (2008). The transfer of selected lean manufacturing techniques from Japanese automotive manufacturing into general manufacturing (UK) through change agents. Robotics and Computer-Integrated Manufacturing, 24(4), 524–531. doi:10.1016/j.rcim.2007.07.014
- Hignett, S., & McAtamney, L. (2000). Rapid Entire Body Assessment (REBA). Applied Ergonomics, 31(2), 201–205. doi:10.1016/S0003-6870(99)00039-3
- Hilton, R. J., & Sohal, A. (2012). A conceptual model for the successful deployment of lean Six Sigma. International Journal of Quality & Reliability Management, 29(1), 54–70. doi:10.1108/02656711211190873
- Hines, P., Holweg, M., & Rich, N. (2004). Learning to evolve: A review of contemporary lean thinking. International Journal of Operations & Production Management, 24(10), 994–1011. doi:10.1108/01443570410558049
- Hollmann, S., Klimmer, F., Schmidt, K., & Kylian, H. (1999). Validation of a questionnaire for assessing physical work load. Scandinavian Journal of Work, Environment & Health, 25(2), 105–114. doi:10.5271/sjweh.412
- Huang, A., & Badurdeen, F. (2018). Metrics-based approach to evaluate sustainable manufacturing performance at the production line and plant levels. Journal of Cleaner Production, 192, 462–476. doi:10.1016/j.jclepro.2018.04.234
- Jawahir, I. S., Rouch, K. E., Dillon, Jr., O.W, Joshi, K. J., Venkatachalam, A., & Jaafar, I. H. (2006, September). Total life-cycle considerations in product design for manufacture: A framework for comprehensive evaluation, (keynote paper). In Proc. TMT 2006 (pp. 1–10), Lloret de Mar, Barcelona, Spain.
- Jayal, A. D., Badurdeen, F., Dillon, O. W., & Jawahir, I. S. (2010). Sustainable manufacturing: Modeling and optimization challenges at the product, process and system levels. CIRP Journal of Manufacturing Science and Technology, 2(3), 144–152. doi:10.1016/j.cirpj.2010.03.006
- Jakovac, P. (2013). Empirical analysis on economic growth and energy consumption relationship in Croatia. Economic Research-Ekonomska Istraživanja, 26(4), 21–42. doi:10.1080/1331677X.2013.11517628
- Jiran, N. S., Gholami, H., Mahmood, S., Saman, M. Z. M., Yusof, N. M., Draskovic, V., & Javovic, R. (2019). Application of activity-based costing in estimating the costs of manufacturing process. Transformations in Business & Economics, 18(2B (47B), 839–860.
- Kirkham, L., Garza-Reyes, J. A., Kumar, V., & Antony, J. (2014). Prioritisation of operations improvement projects in the European manufacturing industry. International Journal of Production Research, 52(18), 5323–5345. doi:10.1080/00207543.2014.903345
- Kumar, S., & Phrommathed, P. (2006). Improving a manufacturing process by mapping and simulation of critical operations. Journal of Manufacturing Technology Management, 17(1), 104–132. doi:10.1108/17410380610639533
- Kurdve, M., Hanarp, P., Chen, X., Qiu, X., Yan, Z., John, S., & Jonas, L. (2011, May 3–5). Use of environmental value stream mapping and environmental loss analysis in lean manufacturing work at Volvo. In Proceedings of the 4th Swedish Production Symposium (SPS11), Lund, Sweden.
- Kurdve, M., Shahbazi, S., Wendin, M., Bengtsson, C., & Wiktorsson, M. (2015). Waste flow mapping to improve sustainability of waste management: A case study approach. Journal of Cleaner Production, 98, 304–315. doi:10.1016/j.jclepro.2014.06.076
- Kuriger, G., & Chen, F. F. (2010, June 5–9). Lean and green: A current state view. In Proceedings of the 2010 Industrial Engineering Research Conference, Cancun, Mexico.
- Lee, J. H., Garza-Reyes, J. A., Kumar, V., Rocha-Lona, L., & Mishra, N. (2013). A comparative study of the implementation status of lean Six Sigma in South Korea and the UK. In A. Azevedo (Ed.), Advances in sustainable and competitive manufacturing systems, lecture notes in mechanical engineering (Vol. 1, pp. 1489–1502). Berlin, Heidelberg: Springer.
- Lie, A., Skogstad, M., Johannessen, H. A., Tynes, T., Mehlum, I. S., Nordby, K. C., … Tambs, K. (2016). Occupational noise exposure and hearing: A systematic review. International Archives of Occupational and Environmental Health, 89(3), 351–372. doi:10.1007/s00420-015-1083-5
- Lu, T., Gupta, A., Jayal, A. D., Badurdeen, F., Feng, S. C., Dillon, O. W., & Jawahir, I. S. (2011). A framework of product and process metrics for sustainable manufacturing. In Advances in sustainable manufacturing (pp. 333–338). Berlin, Heidelberg: Springer.
- Lu, T., Rotella, G., Feng, S. C., Badurdeen, F., Dillon, O. W., Rouch, K., & Jawahir, I. S. (2012). Metrics-based sustainability assessment of a drilling process. In Sustainable manufacturing (pp. 59–64). Berlin, Heidelberg: Springer.
- Mader, D. P. (2008). Lean six sigma’s evolution. Quality Progress, 41(1), 40–48.
- Mahmood, S., Saman, M. Z. M., & Yusof, N. M. (2015). Proposed framework for assessing the sustainability of membrane life cycle. Procedia Cirp, 26, 35–39. doi:10.1016/j.procir.2014.07.171
- Mason-Jones, R., Naylor, B., & Towill, D. (2000). Lean, agile, or leagile? Matching your supply chain to the marketplace. International Journal of Production Research, 38(17), 4061–4070. doi:10.1080/00207540050204920
- Mikulić, D., Rašić Bakarić, I., & Slijepčević, S. (2016). The socioeconomic impact of energy saving renovation measures in urban buildings. Economic research-Ekonomska Istraživanja, 29(1), 1109–1126. doi:10.1080/1331677X.2016.1211952
- Miguélez, M. S., Errasti, A., & Alberto, J. A. (2014). Lean-six sigma approach put into practice in an empirical study. In Annals of industrial engineering 2012 (pp. 255–262). London: Springer.
- Montgomery, D. C. (2001). Introduction to statistical quality control (4th ed.). New York, NY: John Willey and Sons.
- Nagi, A., & Altarazi, S. (2017). Integration of value stream map and strategic layout planning into DMAIC approach to improve carpeting process. Journal of Industrial Engineering and Management, 10(1), 74–97. doi:10.3926/jiem.2040
- Nelson, D. I., Nelson, R. Y., Concha-Barrientos, M., & Fingerhut, M. (2005). The Global Burden of Occupational Noise-Induced Hearing Loss. American Journal of Industrial Medicine, 48(6), 446–458. doi:10.1002/ajim.20223
- Obradović, S., & Lojanica, N. (2017). Energy use, CO2 emissions and economic growth–causality on a sample of SEE countries. Economic research-Ekonomska Istraživanja, 30(1), 511–526. doi:10.1080/1331677X.2017.1305785
- OSHA (2008). Occupational noise exposure. United States Department of Labor.
- Paju, M., Heilala, J., Hentual, M., Heikkila, A., Johansson, B., Leong, S., & Lyons, S. (2010). Framework and indicators for a sustainable manufacturing mapping methodology. In Proceedings of the 2010 Winter Simulation Conference (pp. 3411–3422). IEEE.
- Pande, P. S., & Holpp, L., (2002). What is six sigma. Columbus, OH: McGraw-Hill. doi:10.1108/02656711011014276
- Pepper, M. P. J., & Spedding, T. A. (2010). The evolution of lean Six Sigma. International Journal of Quality & Reliability Management, 27(2), 138–155. doi:10.1108/02656711011014276
- Phuong, N. A., & Guidat, T. (2018). Sustainable value stream mapping and technologies of Industry 4.0 in manufacturing process reconfiguration: A case study in an apparel company. In Proceedings of the 2018 IEEE International Conference on Service Operations and Logistics, and Informatics (pp. 85–90). Soli.
- Powell, D., Lundeby, S., Chabada, L., & Dreyer, H. (2017). Lean Six Sigma and environmental sustainability: The case of a Norwegian dairy producer. International Journal of Lean Six Sigma, 8(1), 53–64. doi:10.1108/IJLSS-06-2015-0024
- Prasara-A, J., & Gheewala, S. H. (2016). Sustainability of sugarcane cultivation: Case study of selected sites in north-eastern Thailand. Journal of Cleaner Production, 134, 613–622. doi:10.1016/j.jclepro.2015.09.029
- Prashar, A. (2017). Adopting PDCA (Plan-Do-Check-Act) cycle for energy optimization in energy-intensive SMEs. Journal of Cleaner Production, 145, 277–293. doi:10.1016/j.jclepro.2017.01.068
- Pyzdek, T. (2014). The six sigma handbook: A complete guide for green belts, black belts, and managers at all levels (4th ed.). New York, NY: McGraw-Hill.
- Ray, S., & Das, P. (2010). Six sigma project selection methodology. International Journal of Lean Six Sigma, 1(4), 293–309. doi:10.1108/20401461011096078
- Salah, S., Rahim, A., & Carretero, J. A. (2010). The integration of Six Sigma and lean management. International Journal of Lean Six Sigma, 1(3), 249–274. doi:10.1108/20401461011075035
- Satolo, E. G., Andrietta, J. M., Miguel, P. A. C., & Calarge, F. A. (2009). Analysis on the usage of techniques and tools from the Six-Sigma program on a survey-type assessment. Production, 19(2), 400–416.
- Shah, R., Chandrasekaran, A., & Linderman, K. (2008). In pursuit of implementation patterns: The context of Lean and Six Sigma. International Journal of Production Research, 46(23), 6679–6699. doi:10.1080/00207540802230504
- Shuaib, M., Seevers, D., Zhang, X., Badurdeen, F., Rouch, K. E., & Jawahir, I. S. (2014). Product sustainability index (ProdSI) a metrics‐based framework to evaluate the total life cycle sustainability of manufactured products. Journal of Industrial Ecology, 18(4), 491–507. doi:10.1111/jiec.12179
- Simons, D., & Mason, R. (2002). Environmental and transport supply chain evaluation with sustainable value stream mapping. In: 7th Logistics Research Network Conference, Birmingham, UK.
- Sin, A. B., Zailani, S., Iranmanesh, M., & Ramayah, T. (2015). Structural equation modelling on knowledge creation in Six Sigma DMAIC project and its impact on organizational performance. International Journal of Production Economics, 168, 105–117. doi:10.1016/j.ijpe.2015.06.007
- Song, Q., Wang, Z., & Li, J. (2013). Sustainability evaluation of e-waste treatment based on energy analysis and the LCA method: A case study of a trial project in Macau. Ecological Indicators, 30, 138–147. doi:10.1016/j.ecolind.2013.02.016
- Thomas, A., Barton, R., & Chuke-Okafor, C. (2008). Applying lean six sigma in a small engineering company - A model for change. Journal of Manufacturing Technology Management, 20(1), 113–129. doi:10.1108/17410380910925433
- Torres Jr, A. S., & Gati, A. M. (2009). Environmental value stream mapping (EVSM) as sustainability management tool. In PICMET'09-2009 Portland International Conference on Management of Engineering & Technology (pp. 1689-1698). IEEE.
- Tyagi, S., Choudhary, A., Cai, X., & Yang, K. (2015). Value stream mapping to reduce the lead-time of a product development process. International Journal of Production Economics, 160, 202–212. doi:10.1016/j.ijpe.2014.11.002
- Urtiaga, A., & Irabien, A. (2013). Environmental sustainability assessment of an innovative Cr (III) passivation process, (III). ACS Sustainable Chemistry & Engineering, 1(5), 481–487.
- US DOC. (2010). The International Trade Administration and the U.S. Department of Commerce’sDefinition for Sustainable Manufacturing. Retrieved from http://www.trade.gov/competitiveness/sustainablemanufacturing/how_doc_defines_SM.as
- US EPA. (2007). The lean and environment toolkit. Prevention, 96. Retrieved from http://www.epa.gov/lean
- Veleva, V., & Ellenbecker, M. (2001). Indicators of sustainable production: Framework and methodology. Journal of Cleaner Production, 9(6), 519–549. doi:10.1016/S0959-6526(01)00010-5
- Vinodh, S., Ben Ruben, R., & Asokan, P. (2016). Life cycle assessment integrated value stream mapping framework to ensure sustainable manufacturing: A case study. Clean Technologies and Environmental Policy, 18(1), 279–295. doi:10.1007/s10098-015-1016-8
- Vinodh, S., Kumar, S. V., & Vimal, K. E. K. (2014). Implementing lean sigma in an Indian rotary switches manufacturing organisation. Production Planning & Control, 25(4), 288–302. doi:10.1080/09537287.2012.684726
- Waters, T., Putz-Anderson, V., & Garg, A. (1994). Quick guide for the NIOSH lifting equation. DHHS (NIOSH) Publication.
- Wheeler, D. J. (2010). The six sigma practitioner’s guide to data analysis. Knoxville, TN: SPC Press.
- Wills, B. (2009). Green intentions: Creating a green value stream to compete and win. New York, NY: Taylor & Francis.
- Winroth, M., Almström, P., & Andersson, C. (2012). Sustainable indicators at factory level–A framework for practical assessment. In IIE Annual Conference. Proceedings (Vol. 21, pp. 1–14).
- Womack, J. P., & Jones, D. T. (1996). Beyond Toyota: How to Root Out Waste and Pursue Perfection. Harvard Business Review, 74(5), 140–158.
- Yang, Q. Z., Qi, G. J., Low, H. C., & Song, B. (2011). Sustainable recovery of nickel from spent hydrogenation catalyst: Economics, emissions and wastes assessment. Journal of Cleaner Production, 19(4), 365–375. doi:10.1016/j.jclepro.2010.11.007
- Yoon, S. W., & Yoon, C. H. (2018). On the impossibility of sustainable growth in a manufacturing based economy. Economic research-Ekonomska Istraživanja, 31(1), 1526–1538.