
 ?Mathematical formulae have been encoded as MathML and are displayed in this HTML version using MathJax in order to improve their display. Uncheck the box to turn MathJax off. This feature requires Javascript. Click on a formula to zoom.
Abstract
This paper explores the impact of education-job mismatch on the net income of workers in the context of Bosnia-Herzegovina. We used an OLS linear regression method on data from the Measure BiH Youth Survey. A log-transformation of the dependent variable created the left-side semilog functional form, which is typically used in models of the earnings of individuals. Our findings strongly support the statement that education-job mismatch has a significant effect on net income. Workers can expect net income differences between 13% and 15% if their level of education does not match that required for their job. However, our results show that the impact of education-job mismatch depends on the level of schooling and age of respondents. Results regarding education-job mismatch vary across studies, but our study is the first to examine the effect of education-job mismatch on net income in the context of Bosnia-Herzegovina. Second, the effect of education-job mismatch might depend on the choice of estimation method for incidences of overeducation and undereducation. Third, we emphasise the importance of understanding interactions, and fourth, we introduce new variables to understand how they influence earnings. These include religiousness, and the importance of belonging to a family, or a particular city.
1. Introduction
The concept of education-job mismatch describes a situation in which an employed individual’s level of education is different from the level of education appropriate for the job. As Cohn and Khan (Citation1995) note, education-job mismatch is also known as overschooling, overeducation or surplus education. A person can be overeducated (the individual’s level of education is higher than that appropriate for the job), undereducated (the individual’s level of education is lower than that appropriate for the job), or adequately educated. Different approaches emerged to provide adequate ways of measuring education-job mismatch. Van der Velden and van Smoorenburg (Citation1997) identified the three most commonly used methods (expert judgment, worker’s self-assessment of appropriate and current level of education, and comparison of current level of education with the average years of schooling for an occupation), and other researchers have adjusted those methods to increase the robustness of their estimates. Acosta-Ballesteros, Osorno-del Rosal, and Rodriguez-Rodriguez (Citation2018) summarise key theoretical perspectives that provide possible explanations for the occurrences of education-job mismatches. Among young workers, overeducation often exists as a result of imperfect information in the labour market (matching theory), but it could also be a younger worker’s choice to gain skills for better jobs in the future (mobility theory). Alternatively, employers might consider overeducation as a negative indication of a worker’s ability, and not allow them to progress to matched jobs (signalling theory). The current literature provides different incidents of over- and undereducation based on the method employed to measure the education-job mismatch. In that context, this article contributes to the existing literature by comparing the results of different methods with self-reported instances of mismatch. We want to answer the question: Does self-assessment regarding education-job mismatch differ from estimation based on the average years of schooling for each occupation in the context of a developing country?
This paper explores the impact of education-job mismatch on the net income of workers in Bosnia-Herzegovina. Education-job mismatch is an important topic among researchers, since it has various consequences for the labour market. As summarised by Allen and Van der Velden (Citation2001), overeducation can affect labour turnover, occupational choice, job satisfaction, and wages. The effect on wages is of particular interest for this research. The literature shows that the strength of the education-job mismatch effect on wages varies across studies. A possible explanation is that different methods produce different incidences of over- and undereducation. However, results are consistent when it comes to the effect of education-job mismatch: overeducated individuals earn less, and undereducated individuals earn more than adequately educated workers. In most papers, explanations for this are derived from assignment theory, matching theory, human capital theory or signalling theory, all of which are discussed later in the theoretical background. Acosta-Ballesteros et al. (Citation2018) note that ‘a still open question in the overeducation literature is to assess the potential effect of young workers accepting jobs with the requirements below their educational attainment at the initial stages of their working career’. As results vary across studies, this paper contributes to understanding the effects of education-job mismatch and an individual’s social and demographic characteristics on the wages of a sample predominantly consisting of young workers.
Quinn and Rubb (Citation2006) concluded that it would be useful to conduct how education-job mismatch impacts wages in other less developed countries, since the effect of education on earnings, wages, and economic growth in developing countries had been ignored. Understanding if mismatches between a worker’s education and job requirements influence an individual’s earnings may provide valuable information to policymakers, allowing them to design policies that could diminish the existence of such a mismatch. While the literature suggests that education-job mismatch has a severe effect on wages, developing countries (such as Bosnia-Herzegovina) have specific environments that might influence the effect of education-job mismatch on wages. In Bosnia-Herzegovina specifically, these include: a high youth unemployment rate (according to World BankFootnote1 data, 46.70% of the total labour force aged 15–24 was unemployed in 2018, while the global average was 12.8%); ethnically divided societies; one of the most complicated systems of government in the world; an ongoing process of recovery from the consequences of the 1992–1995 war; a strong desire among youth to leave the country (Ministry of Security, Citation2018); the endangerment of the quality of education by an increasing number of private universities with inadequate research and teaching capacities; and the relatively recent switch from socialism to capitalism.
The World Bank’s (2016) report ranked Bosnia-Herzegovina 16th, with a high number of emigrants as a percentage of the population (44.5%). Official government data (Ministry of Security, Citation2018) confirmed that an increasing number of persons cancelled their residence in Bosnia-Herzegovina and were subsequently employed abroad. Bosnia-Herzegovina belongs to an upper middle-income group (World Bank classification) and has an emerging market and developing economy (International Monetary Fund classification). Therefore, the existence of education-job mismatch and its effect on wages should be tested and confirmed. To observe all the cultural specifics of individuals that might influence wages, we included three additional variables: the importance of belonging to a family; the importance of belonging to a city/municipality; and the individual’s religiousness. Existing literature does not pay special attention to the effect of the estimation of different interaction terms. Our contribution is to add three interaction terms to our model to expand the understanding of relationships between net income, mismatch, age of respondents, and years of schooling. While our focus is primarily on understanding the effects of education-job mismatch, over- and undereducation also affect other labour outcomes, such as job satisfaction, on-the-job searches and additional training needs (Allen & Van der Velden Citation2001; Wolbers, Citation2003).
This paper is divided into six sections. The introduction, with a brief background and contextual information, is provided in this section. The second section presents a theoretical background on the expected influence of education-job mismatches on wages. In the third section, we define the models and describe the data. The fourth and fifth sections interpret the results and provide explanations in the form of discussion. In the sixth section, we draw conclusions and recommendations for future research.
2. Literature review
In this section, we will provide a brief overview of existing literature related to the effect of education-job mismatch on wages. The relationship between education-job mismatch and wages has been a topic of interest for researchers. However, the approach used to measure education-job mismatch and the expected effects on wages varies across studies. Below, the reported effects and different variables used to test whether job-mismatch affects wages are discussed.
2.1. Measures of education-job mismatch
Van der Velden and van Smoorenburg (Citation1997) and Kiker, Santos, and De Oliveira (Citation1997) identified three methods of measuring education-job mismatch: (1) comparison of a worker’s level of education with the years of schooling estimated for a specific occupation in the dataset (the mean or the mode method); (2) a worker’s self-assessment of the current and appropriate levels of education required for the job (the self-assessment method); and (3) the level of education required for the job is determined by job analysts based on job descriptions, and the required level of knowledge and skills required for the job. As Quinn and Rubb (Citation2006) note, the first method can be measured in at least two ways. One approach (Cohn, Johnson, & Ng, Citation2000; Cohn & Khan, Citation1995; Kiker, Santos, & De Oliveira, Citation1997; Ng, Citation2001; Rubb, Citation2003; Verdugo & Verdugo, Citation1989) is to calculate the mean years of schooling for each occupation in the dataset, and to compare each observation with this mean value. In cases where an individual’s level of education exceeds the required level of education (the occupation’s mean) by one standard deviation, the individual is overeducated. Other studies (Cohn et al., Citation2000; Kiker et al., Citation1997; Ng, Citation2001) used the most frequent level of education within an occupation category; an individual is overeducated if their current years of schooling are above the most frequent (mode) level of education. In contrast to this approach, Allen and Van der Velden (Citation2001) used the second approach in measuring education-job mismatch: under- and overeducation represent the difference between the number of years of an individual’s self-rated appropriate level of education for the job, and the number of years this individual spent attaining their current level of education. To measure mismatch, respondents have to specify their current and appropriate levels of education. Finally, the third method uses expert judgement to determine the level of education appropriate for a specific job. However, as Van der Velden and van Smoorenburg (Citation1997) results demonstrate, this approach systematically overestimates education-job mismatch. Their results strongly support that the level of education is systematically overestimated when the job-analyst method is used: i.e. 65% of school leavers are overeducated in comparison to 23% when the self-reporting approach is used.
2.2. The effect of education-job mismatch on earnings
Verdugo and Verdugo (Citation1989) results confirm that the earnings of overeducated and undereducated workers vary: overeducated workers earn from 14 to 32% less in five out of nine broad occupational categories, whereas undereducated workers earn from 10 to 16% more than adequately educated workers in three out of nine broad occupational categories. On average, overeducated and undereducated workers earn about 13% less and 10% more than the adequately educated, respectively. This estimation is based on a sample of 14,596 full-time employed workers aged 25 to 64 who worked 1,365 hours in 1979 in the United States. All observations are of white male workers. The existence of education-job mismatch is estimated based on average years of schooling for each occupation. Three explanations are provided for the results obtained from the data: (1) the measures used to indicate education-job mismatch may reflect high- or low-paying types of occupations; (2) overeducated workers may not be as productive as expected since the level of education does not necessarily capture individual productivity; whereas (3) undereducated workers may be excellent performers. Cohn and Khan (Citation1995) paper replicated this study and concluded that ‘on average, persons whose schooling exceeds (is less than) the required schooling for their occupation or job, respectively, receive lower (higher) wages than workers with similar levels of schooling in occupations or jobs having the required schooling’. The data used in this study comes from the same source as that used by Verdugo and Verdugo (Citation1989), but the latter included a newer 1985 dataset in their research. In addition to Verdugo and Verdugo (Citation1989) approach, a transformation of the self-reported level of education (given in years) was used to estimate over- and undereducation. The important contribution of their paper is that they provide arguments that the wage effects of surplus schooling can be different depending on the definition of over- and underschooling, and how the wage equation is specified. Similar to the previous study, Rubb (Citation2003) has used a mean level of education among workers in each occupational category to estimate under- and overeducation. The dataset included over 700,000 respondents taken from the 1990 US census. The results confirmed that ‘overeducated individuals have lower hourly wage rates than similarly educated individuals who find a job that requires their level of educational attainment’ (Rubb, Citation2003, p.70). This paper contributed to the literature by focusing only on those individuals who were most likely to be overeducated. Cohn and Ng (Citation2000) used data from the 1986 Hong Kong By-census and the 1991 Hong Kong Census and employed the same measures of over- and undereducation as previous studies discussed in this section. Their findings confirm that overeducated workers ‘have wages that are substantially lower than the wages they would have earned in a job for which they are adequately schooled’ (Cohn & Ng, 2000, p. 166). From a random sample from Portugal, which included 50,000 individuals from 1991, Kiker et al. (Citation1997) concluded that overeducation results in earning less, and undereducation in earning more, than workers with an educational attainment that matched that required by their job.
Quinn and Rubb (Citation2006) used multi-period cross-sectional data collected between 1987 and 1999, including 4,945 men. Their approach of measuring the required level of education used for over- and undereducation estimations differs from commonly employed methods in the literature. The required level of education (ED_REQ) is estimated based on regression (beta) coefficients for each occupation and compared with an individual’s level of education. By using regression, they were able to estimate the mean years of schooling for a specific occupation, simultaneously controlling for the age of respondents and the year in which the observation was collected. Individuals are considered to be overeducated if their current years of schooling are one standard error above the beta coefficient for an associated occupation. As different methods were applied in their research, the incidence of overeducation in the context of Mexico is estimated to be 17.2% (the mean value method), 39.9% (the mode method) and 13.5% (OLS definition). Estimates of undereducation also vary: 19.4% (the mean definition), 30.0% (the mode) and 13.8% (OLS). Both overeducation and undereducation have a higher incidence in the context of Mexico than they do in the context of Portugal (Kiker et al., Citation1997) and Hong Kong (Ng, Citation2001). Their results suggest that additional years of schooling as well as being married, the peso-dollar exchange rate, and US work experience have positive effects on wages. Over- and undereducation significantly influence wages in the context of Mexico, with similar effects as previously discussed in developed countries.
While most of the papers report positive and negative effects regarding overeducation and undereducation, Zamfir, Matei, and Lungu’s (2013) results show that education-job mismatch has a negative effect on the wages of higher education graduates in most countries. They measured education-job mismatch in graduates by using the self-assessment method, with respondents divided into two groups: matched or mismatched. Their estimation is based on data from a survey carried out in 2005 among higher education graduates in eleven developed countries. Their data also confirmed that even in developed countries, the incidence of mismatching varies greatly.
Some papers distinguish between overeducation and overskilling (i.e. skills underutilisation and skill deficit). Allen and Van der Velden’s (Citation2001) study confirmed that educational mismatch strongly affects wages. However, skills mismatches are not found to be a statistically significant predictor of wages. This study was based on Dutch data, including 2,460 individuals in the academic year 1990–1991. Undereducation, an individual’s level of education, tenure in their current job, and previous experience have a positive effect on wages, while overeducation and having a temporary job have a negative effect. Each year of overeducation decreases wages between 7% and 8%, while each year of undereducation increases wages by about 3.5%. According to assignment theory, these results are expected, since overeducation implies the current job of an individual to be at a lower level, and undereducation implies the current job of an individual to be at a higher level. The underlying explanation that undereducation has a positive effect on wages can also be found in human capital theory, indicating that over- and undereducation mask unmeasured differences in abilities, which are a real predictor of productivity and wages. In other words, the market sorts graduates with the same level of education according to their abilities: the least competent job seekers could obtain jobs that are below their level, making them overeducated and placing them in a job in which they earn less. A recent study (Caroleo & Pastore, Citation2018) has shown the wage penalty associated with educational mismatch ranges from −21% to −25% for overeducation, and between −16% and −21% for overskilling. However, the wage gap associated with both types of educational mismatch was reduced by half when observable characteristics of individuals were added to the model: gender, civil status, number of children, type of high school diploma, final grade, field of study, time spent obtaining a degree, study abroad, post-graduate studies, professional experience, and whether or not the respondent was a stayer or a mover. The sample used to derive these findings consists of 28,976 pre-reform graduates from Italy interviewed at the time of graduation. Their conclusions are especially strong as 75% of the graduates answered the questionnaire five years after graduation, allowing them to observe changes over a five-year period. Using data from the Survey of Adult Skills, which consists of 2,406 Spanish workers, Mateos-Romero and Salinas-Jiménez (Citation2018) showed that an increase in the differences between the skill level and its use in the workplace results in a wage penalty ranging from 5.8% to 7.8%. This effect is reduced between 3.2% and 4.6% when overeducation and undereducation variables are introduced into the model. Each year of overeducation decreases wages by 3.3%, while each year of undereducation increases wages by 2.2%. A respondent’s years of schooling, level of skill, experience, gender, and nationality, as well as the size and nature of the firm (public or private) and a worker’s role within it, as well as regional dummies, represent the control variables used in their research. Most of the control variables have statistically significant effects on wages, and immigrant workers have lower wages than Spanish ones.
Recent papers include a horizontal mismatch in their wage equations. Horizontal mismatch describes mismatch when individuals have the right level of education, but a different major than that required by the job. Using a dataset from 2014 collected in Poland, Wincenciak’s (Citation2018) results show that horizontal mismatch leads to a negative wage premium, while under- and overeducation have statistically significant positive and negative effects on wages respectively.
3. Methodology and data
The data used in this study comes from the Measure BiH Youth Survey. In 2017, USAID/BiH funded the collection of data on youth for research and policymaking, with the aim of improving the living conditions of young people. A total of 4,500 citizens of Bosnia-Herzegovina aged between 15 and 44 years were randomly selected. The data collection process was based on a face-to-face computer-assisted personal interview survey. MEASURE BiH ensured that the information collected from the sample of individuals was conducted in a systematic way. This section provides details on the methodology used, including the description of variables and model specifications.
3.1. Data
Our dependent variable describes the net income of respondents in the previous month, earned from both formal and informal work. The total number of missing observations for the variable of interest is 2,705 (60.11%). Among the remaining 1,795 observations, 6.96% respondents reported no income earned in the previous month, while 36.55% did not want to indicate their earnings. This left us with information on monthly earnings for 1,014 individuals. This data was mainly reported by full-time employed workers (32% of the total sample or 77.43% of individuals who indicated education-job mismatch), self-employed workers (1.56% and 3.73% respectively), unemployed workers actively looking for work, who do occasional jobs (4.31% and 15.40% respectively), part-time workers (1.04% and 2.85% respectively) and interns/trainees and volunteers (0.78% and 0.40% respectively).
shows the number and percentage of respondents who were not doing the work for which they were educated, categorised by age group. The proportion of individuals in each age category is almost the same (between 20 and 27%), with one exception: those under 20 years of age (7%). The mean age of respondents who indicated a job-education mismatch was 29.98 (st. dev. 7.19), while that of those who did not report a mismatch was 31.43 (st. dev. 7.16). According to the Law on the Youth of the Federation of BiH and the RS Law on Youth Organization, young people are individuals aged 15 to 30 years (Federation of Bosnia-Herzegovina); and 16 to 30 (Republic of Srpska). Based on these criteria, 54% of the sample represents the youth population. In the survey, respondents had to indicate the year in which they turned 15, and their employment status immediately following that age. No respondents reported to be full-time or part-time employed immediately after turning 15. The average age at which those respondents were employed for the first time was 20.97 (st.dev. 4.20, N = 947) for full-time employment, 19.89 (st.dev. 3.36, N = 57) for part-time employment, and 21.90 (st.dev. 5.60, N = 32) for self-employment.
Table 1. A summary of statistics for the question: ‘Are you employed in your profession or not? That is, are you doing work for which you were educated (or are in education)?’.
We compared the earnings, hours worked, and days worked for the two groups: Group 01 ‘Education-job mismatched group’ (respondents who indicated a mismatch between their level of education and that required for their job) and Group 02 ‘Education-job matched group’ (respondents who did not indicate a mismatch between their level of education and that required for their job). Both groups worked approximately the same number of days per week. Respondents from the education-job mismatched group work on average 38.30 (st. dev. 15.30), which is slightly less than the 39.74 hours per week (st. dev. 12.28) worked by those in the second group. Working longer hours can influence total earnings, so the total number of hours was used as a control variable in our models. The average net income in the previous month for the first group was BAM 615.20 (st. dev. 360.53), and the net monthly income for the second group was BAM 841.94 (st.dev. 724.33). On average, individuals that indicated that they had not been doing work for which they were educated earned less. The average hourly net income was BAM 5.90 (st. dev. 6.43) for the first group, and BAM 7.33 (st. dev. 8.77) for the second group. On average, individuals with their level of education not matched to that required for their job earned less per hour.
describes respondents’ occupations in both groups. For the following three categories we can observe a larger number of respondents who reported an education job-mismatch: service or sales worker (30.97% of total respondents indicated an education-job mismatch), elementary occupation (21.37%) and craft and related trades workers (15.20%). As those occupations do not necessarily require university degrees (especially elementary occupations), and knowing that 95.8% of those who indicated mismatches have at least secondary or higher education, we can safely assume that those individuals are most likely overeducated or adequately educated. As these three occupations represent 67.54% of the total number of individuals who reported a mismatch, this also indicates that most of the education-job mismatches in our sample are related to overeducation rather than to undereducation. Alternatively, it is possible that respondents are adequately educated, but their field of education is not that required by their job.
Table 2. Respondents’ occupations.
Most cases of education-job mismatches were reported by individuals with secondary education, followed by individuals with undergraduate university education. However, as shown in , education-job mismatch is reported among all categories to some extent, while no PhD respondents indicated the existence of such a mismatch.
Table 3. Summary statistics of respondents’ level of education.
More male than female respondents reported an education-job mismatch (59.67% versus 40.33%), but male respondents prevailed when it came to not reporting the mismatch (66.44% versus 43.56%). The percentage of unmarried, single and divorced workers who reported education-job mismatch was higher than that of workers who were married or in a domestic partnership (54.56% versus 45.44%). provides a summary of statistics for respondents’ gender and marital status.
Table 4. Summary statistics of respondents’ gender and marital status.
3.2. Measures of education-job mismatch
We employed several additional approaches to measure education-job mismatch. First, we converted levels of education to years of schooling by applying the following transformation to each level of education: (1) No education, 0 years; (2) Elementary school, 8 years; (3) Secondary school, 3-year program, 11 years; (4) Secondary school, 4-year program, 12 years; (5) Junior college (2-year university program), 14 years; (6) University education (bachelor) 15 years; (6) University education (master degree), 17 years and (7) University education (PhD), 20 years. Second, we calculated whether someone was overeducated or undereducated by comparing their current level of education with the mean value, and the most frequent value of schooling for each broader occupational category. If an individual’s actual years of schooling exceeded the mean value of schooling by one standard deviation (approach 1) or most frequent value of schooling (approach 2), an individual was designated as overeducated. Similarly, undereducated individuals are those whose years of schooling are below the mean (by one standard deviation) or below the mode value of the schooling variable for the broader occupational category. For appropriately educated individuals, years of schooling are within one standard deviation of the mean (approach 1) or the most frequent years of schooling (approach 2). A similar approach was used in several studies (Cohn et al., Citation2000; Cohn & Khan, Citation1995; Kiker et al., Citation1997; Ng, Citation2001; Rubb, Citation2003; Verdugo & Verdugo, Citation1989). One caveat of our estimation comes from using one-digit occupation codes, since three digits codes were not available. Since not all jobs within broader occupations categories are the same, these estimations provide estimates for the broad categories.
The third approach is based on the estimation of overeducation and undereducation variables by comparing a respondent’s current level of education with an expected education level for their current occupation. For example, we assumed that categories such as managers (legislator; senior official; manager), professionals (scientist; engineer; business and administration professionals; legal, social, cultural and related professional; journalist, physician or teacher) and technicians or associate professionals (e.g. technician, nurse, legal associate professionals) would require university degrees. Individuals in these occupations with levels of education below that of a university degree (no education, elementary school or 3-and 4-year secondary school program) were classified as undereducated, where they would otherwise be considered adequately educated. Similarly, workers in elementary occupations (cleaner; agricultural, forestry or fishery worker; worker in mining, construction, manufacturing, transport; street sales or services worker) were classified as overeducated if their level of education was secondary or higher. Appendix 1 (Supplementary material) provides a table that explains the underlying logic used for the estimation of overeducation and undereducation mismatches.
The fourth approach used to indicate the relationship between the current level of education and that required by the worker’s current job was workers self-reporting on whether they thought they were doing the kind of work for which they were educated. As Allen and Van der Velden (Citation2001) note, employee self-rating is far more valid than the expert-rating of job titles. The superiority of self-rating was particularly demonstrated in Van der Velden and van Smoorenburg (Citation1997). However, our approach to measuring mismatch has some disadvantages. We could not determine whether respondents were working above or below their level of education, because the question in the Measure BiH Youth Survey was designed only to indicate the existence of an education-job mismatch. We can still detect some effects on net income, but the ability to interpret whether or not overeducation or undereducation can lead to a net income change is limited.
3.3. Model specification
In our model, the dependent variable is the logarithm of net income. The net income is measured by questions from the Measure BiH Youth Survey (Q48): ‘How much in BAM did you earn in net income in the last month from formal or informal work?’ Net income includes monthly earnings from both formal and informal work. In the model, we specify the relationship between net income, the existence of an education-job mismatch, occupation, years of schooling, number of working hours per week and a set of personal characteristics, such as gender, age, marital status and place of residence.
The approach we used to indicate the match between the current level of education and that required by a worker’s current job was a worker’s self-assessment on whether they thought they were doing the kind of work for which they were educated (yes/no). Such a defined variable might also include horizontal mismatch, i.e. the individual level of education is neither above nor below that appropriate for the job, but the field of education might not be appropriate. This is a limitation of the survey: not asking whether an individual is over- or undereducated, or working in a different field.
The earnings equation is specified as follows:
Occupations, a categorical variable with 11 categories, is an essential predictor of net income. Managers are defined as the reference category; therefore, we expect that a series of occupational dummies will have a lower net income in reference to the occupation of a manager. The number of hours respondents work per week may seriously influence earnings, so this variable is included in the model. We expect that working longer will result in a higher net income. There is a moderate correlation between working hours and working status; therefore, we decided to include only working hours as an explanatory variable. We added several demographic characteristics for respondents: sex (a dummy variable indicating if the respondent is male or not), age (continuous), marital status (a set of dummies indicating marital status), schooling (education variable transformed in number of years) and place of residence (dummy variable indicating if the respondent is living in a rural area).
We included two variables measured on a scale from 1 (not at all important) to 5 (very important): the importance of belonging to a family (Q81A) and importance of belonging to a city/municipality (Q81F). Bosnia-Herzegovina is considered a collectivistic society, which is why we wanted to test whether these worker’s characteristics influence their decisions regarding job selection or job outcomes. For example, if respondents consider that being a member of a family and a resident of their city are important aspects of their lives, their focus might be to increase their contribution to their family and society, thus investing more time in building relationships than in acquiring the skills required to improve their productivity and receive monetary rewards. We assume that such attitudes regarding the importance of belonging to these two groups can have a powerful effect on net income.
We also included a variable that measures how religious individuals consider themselves to be from 1 (not at all) to 4 (very). Regarding religiousness, Chiswick (Citation1983) found evidence that religion affects wages based on the analysis of 61,070 US individuals, with a focus on the second-generation American Jews. Several possible explanations are provided in Chiswick’s (Citation1983) study, including: (a) the existence of cultural characteristics that enable Jews to increase their productivity; (b) exposure to additional education from a family or community. Guiso, Sapienza, and Zingales (Citation2003) confirmed that there is a strong association between religious beliefs and economic attitudes, but the effects can differ ‘across religious denominations’. The following description explains a possible mechanism for how religiousness affects different outcomes (Guiso et al., Citation2003, p. 228):
Religious denominations also differ in their attitude toward private ownership. Observant Catholics support private ownership twice as much as Protestants, while Muslims and Hindus are strongly against competition. Finally, with the exception of Buddhists, religious people of all denominations are more inclined to believe that poor people are lazy and lack will power. The effect is stronger for Protestants than Catholics. Overall, we find that Christian religions are more positively associated with attitudes conducive to economic growth, while religious Muslims are the most anti-market. Within Christian denominations, the ranking is unclear: Protestants are more trusting and favor incentives more, Catholics are more thrifty and favor private property and competition more.
As shown, religion might explain some attitudes regarding perception of private ownership. Therefore, we assumed that religiousness might reflect some specific elements that determine individual productivity, leading to higher wages. However, the effect of the relationship between religion and religiousness on wages might not be direct. Lehrer’s (Citation2010) findings show that religious affiliation has a significant impact on years of schooling completed, and consequently, on earnings. We assume that the effect can be twofold: religion might influence the choice of education and level of education attained, but it might also reflect those characteristics of an individual that influence productivity, and consequently, earnings.
3.4. Methods
Ordinary least-squares linear regression was performed in STATA version 15.1. The monthly net income (natural logarithm) is the dependent variable. To reduce positive skew, we performed a log transformation of the dependent variable. Another reason for performing the log transformation of the left side of our model’s equation was to provide a useful interpretation. As Studenmund (Citation2016) notes, the most common application of left-side semilog is in a model of the earnings of individuals where such functions are ‘…perfect for any model in which the dependent variable adjusts in percentage terms to a unit change in an independent variable’ (Studenmund, Citation2016, p. 199). The procedure is divided into three steps, and our explanatory variables were introduced into the model step-by-step, allowing us to observe changes in R2 and changes in coefficients. In our models, there is no perfect linear relationship between independent variables as all VIF values are below ten, whereas tolerance values (1/VIF) are above 0.1, indicating no issue with multicollinearity. Additional statistical tests (Linktest and Ramsey RESET test) show no model specification error and no omitted variables. These tests were performed to check if irrelevant variables were included in the model. We also checked if models were well fitted by analysing the existence of patterns to the residuals plotted against the fitted values. Visual examination shows that assumptions of linearity and homoscedasticity were met.
4. Results
Descriptive statistics of each variable introduced in the wage regressions are provided in . While the total sample size is 4,500, monthly net income was reported for only 1,014 individuals. When this variable is cross-tabulated with a reported education-job mismatch, a total of 988 observations are available for analysis.
Table 5. Descriptive statistics of the explanatory variables and outcome variable.
The incidence of overeducation and undereducation in the context of Bosnia-Herzegovina depends on the estimation method. The same percentage of overeducation was estimated based on the mean and the mode method (9.69%). However, the mode method estimated slightly more undereducated individuals than the mean method (7.01% in comparison to 4.84%). Our method, based on the comparison of expected levels of education for particular job categories, shows the highest percentage of overeducation and undereducation. Overall, all these methods provide results that are notably lower than those from the self-assessment method (see ). There is no statistically significant or strong relationship between self-reported mismatches and these three methods. The only strong relationship is between the mode and the mean method (r = 0.92, p < 0.001), while between the method based on the expected level of education for a particular occupation and the mean and mode methods, the Pearson correlation coefficient is r = 0.18 and r = 0.20 respectively.
Table 6. The incidence of overeducation and undereducation in the context of Bosnia-Herzegovina.
The regression results are presented in . The presence of an education-job mismatch has a statistically significant effect on net income. Based on the results from our regression model, monthly net income is between 13% and 15% lower for those individuals who indicated an education-job mismatch. However, we should note that the self-reported mismatch from the survey does not indicate whether this effect comes from undereducation or overeducation; nor we can be sure whether some reported mismatches were caused by horizontal mismatch (not working in the field of education). Therefore, these results should be interpreted with caution.
Table 7. Estimation results.
Regarding additional variables, we found that occupations have a significant influence on net income. The reference category is that of manager. As expected, the regression coefficients for all other categories are negative; managers have the highest net income. The differences in net income between the reference group and other occupational categories are in the range between 4% and 41%. However, three occupations in Step 2 and Step 3 do not have a significant effect on net income: technician or associate professional, clerical support worker, and armed forces occupation. In Step 1, one additional occupation has no statistically significant effect: Professional. However, its level of significance changed as we introduced additional variables into the model.
Net income increases with the level of education: for a one-year increase in schooling, we expect to see about a 5% increase in monthly net income. Net income also increases with the age of respondents: for a one-year increase in age, we expect to see between a 1% and 2% increase in monthly net income. The number of working hours per week has a significant positive effect on net income, indicating that for each additional hour a worker’s net income increases by 1%. On average males have a higher net income (between 20% and 25% higher than female workers). Being married or in a domestic partnership had a statistically significant and positive effect on net income in the first step of our regression: ceteris paribus, married individuals have 9% higher earnings than those who are unmarried. However, the effect was not significant once we added the importance of belonging to a family or city and religiousness variable. There is no statistically significant effect of the type of residence on an individual’s monthly net income.
The importance of strengthening bonds with family, and the importance of belonging to a city/municipality had a significant effect on net income. For the variable that measures the importance of belonging to a family, we can say that for a one-unit increase in this variable, we expect to see about a 6% decrease in earnings. On the other hand, for a one-unit increase in the importance of belonging to a city/municipality, we expect to see an increase in earnings of between 6% (Step 2) and 7% (Step 3). Our results could not confirm that religiousness affects monthly net income.
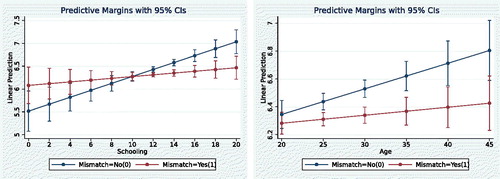
In the last step, we introduced interaction effects between (a) Mismatch and (c) Age, (d) Schooling and (e) Gender. The main effect of the mismatch on monthly net income is still significant. However, the monthly net income is 154% higher for those individuals who indicated an education-job mismatch. This is quite different from the main effect when interaction terms were not included. Without interaction terms, the education-job mismatch resulted in lower earnings for those workers that reported it. However, the interaction terms Mismatch x Age and Mismatch x Schooling were found to have significant effects on monthly net income, at 0.1 and 0.05 respectively. These results confirm that the impact of education-job mismatch depends on the level of schooling and age of respondents (see ).
Figure 1. Interaction plots: (A) Mismatch x Schooling; (B) Mismatch x Age.
5. Discussion
In this study, we examined the differences in the estimation of incidents of education-job mismatch by different methods in the context of a developing country. However, more importantly, this paper analyses the effects of education-job mismatch and an individual’s social and demographic characteristics on net income in a sample predominantly consisting of young respondents. Understanding the prevalence and effects of education-job mismatch is of enormous importance, since acquiring the right level of education for a job means improving the human capital of a country, as it is a central driver of sustainable growth.
Of those respondents who provided their monthly earnings, a relatively high percentage (58.80%) reported the existence of a mismatch. Compared to the 24 countries presented in Kupets and National University of Kyiv–Mohyla Academy, Ukraine (2015), the rate of self-reported mismatch in the context of Bosnia-Herzegovina is significantly higher. The three additional methods of estimation of the incidence of overeducation and undereducation are inconsistent compared to the self-reported approach. Inconsistent results were also reported in Quinn and Rubb (Citation2006), suggesting that the incidences of overeducation and undereducation depend on the method used. Our first two methods produced a low percentage of overeducation and undereducation in comparison to the results presented in Kupets and National University of Kyiv–Mohyla Academy, Ukraine (2015). Regarding overeducation, the third method allows the comparison of Bosnia-Herzegovina with Austria, the US, Czech Republic, Denmark, Norway, North Macedonia, Sweden, Belgium, Slovakia, Finland and Poland. Regarding undereducation, it can be compared with Japan, Armenia, Spain, Czech Republic, North Macedonia and Poland.
As our results show, monthly net income is lower for those individuals who indicated an education-job mismatch. In the literature, a similar effect can be found for overeducated individuals (Allen & Van der Velden, Citation2001; Cohn & Khan, Citation1995; Cohn & Ng; 2000; Kiker et al., Citation1997; Rubb, Citation2003; Verdugo & Verdugo, Citation1989). Since overeducation is mainly associated with lower earnings, a similar sign of the coefficient might mean that overeducation is more represented than undereducation. This is in line with the data presented in Kupets and National University of Kyiv–Mohyla Academy, Ukraine (2015), which shows that overeducation rates are similar in mature, reforming and transition economies, but transition economies exhibit lower rates of undereducation. Our additional three methods also confirm higher incidences of overeducation than undereducation. Similarly to Kupets’ (2016) study, education-job mismatch in the context of Bosnia-Herzegovina might be explained by supply and demand: too many unemployed people are forced to accept jobs that do not match their educational attainment (accepting jobs below their level), while demand factors might be related to a relatively undeveloped business environment (a lack of jobs). Our results are particularly valuable in explaining the effects of mismatch in the context of a developing country.
The introduction of two interaction terms (Mismatch x Schooling) and (Mismatch x Age) greatly expanded the understanding of the relationships between independent variables and net income, and drastically changed the interpretation of the coefficients. The interaction means that the effect of mismatch on net income is different for different values of age and different values of schooling. Human capital theory, as explained in Allen and Van der Velden’s (Citation2001) study, might be useful in understanding this effect, because education-job mismatch may mask unmeasured differences in abilities, which are a real predictor of earnings. Individuals with lower educational attainment might earn more even when mismatched, since a market sorts graduates with the same level of education according to their abilities. However, the difference in earnings between ‘mismatched’ and ‘matched’ individuals decreases as we increase the schooling variable. So, individuals with a reported education-job mismatch and lower educational attainment might attain a higher salary as a result of their abilities. However, after an individual attains a secondary or tertiary degree, formal education matters more in order to advance to better-paid jobs. Therefore, with each year of schooling, differences in net income increase between matched and mismatched jobs.
As noted by Kupets and National University of Kyiv–Mohyla Academy, Ukraine (2015), ‘…the wage penalty associated with overeducation increases with age and is unlikely to be driven by unobserved worker characteristics’. This is in line with our observation that individuals who indicated an education-job mismatch earn less than individuals with an education-job match at all ages. The differences in net income between ‘mismatched’ and ‘matched’ individuals become larger with the increase of age. As Kupets (Citation2016) notes in reference to career mobility theories, ‘wages tend to grow over time together with the work experience accumulated by individuals’. Individuals who manage to match their education level with the level of education required for their job might have conditions that are more conducive to moving towards higher-level positions, leading to an increase in their earnings. Mismatched individuals are not presented with this opportunity.
Schooling, age, occupation choice and gender are typical variables that can predict net income accurately, as covered in the literature review section. However, three additional variables require discussion. Possible explanations for the 6% decrease in net income with each one-unit increase in the variable that measures the importance of strengthening bonds with family might be that: (a) respondents consider being a member of a family an important aspect of their lives; and (b) a respondent’s focus might be on increasing their contribution to their family, and therefore, investing more time in building relationships with family members than in acquiring the skills required to improve their productivity. Additionally, the importance of family might indicate that an individual fosters traditional values, reducing their interest for 21st century jobs. A possible explanation for the increase in earnings with each one-unit increase in the variable that measures the importance of belonging to a city/municipality might be that strong bonds with cities increase the number of interactions between community members, leading to exchanges of information and improving work-related skills. Another possible explanation is that those individuals can count on the support of other people. Our results could not confirm that religiousness affects monthly net income. Contrary to the explanation of the results in Chiswick’s (Citation1983) study, our research cannot confirm that unique cultural characteristics increase net income. As shown in Guiso et al. (Citation2003), religion might explain some attitudes regarding an individual’s perception of private ownership. However, the three major religions of Bosnia-Herzegovina have coexisted in a relatively small place for centuries; therefore, their perceptions of private ownership might not be different. In the context of Bosnia-Herzegovina, religiousness does not reflect any specific elements that determine individual productivity.
6. Conclusion
The incidence of overeducation and undereducation in the context of Bosnia-Herzegovina depends on the estimation method. Overall, all four methods employed in the paper provide results on education mismatch that are notably lower than results from the self-assessment method. There is no statistically significant or strong relationship between self-reported mismatch (survey question) and these three methods.
Our findings provide strong support that self-reported education-job mismatch has a significant effect on net income among workers in Bosnia-Herzegovina. Workers can expect net income differences between 13% and 15% if their level of education is not matched by that required for their job. However, after the introduction of three interaction terms, our results show that the impact of education-job mismatch depends on the level of schooling and age of respondents. Other variables also play significant roles in predicting earnings. We found statistically significant effects on net income for the following variables: most occupational dummies, level of education, age of respondent, number of working hours per week, gender, the importance of strengthening bonds with family, and the importance of belonging to a city/municipality. Finally, our results could not confirm that religiousness affects monthly net income. Since the effect is not statistically significant, our model confirms that we can attribute nothing specific to religious people in order to observe a significant increase or decrease in earnings.
This study contributes to the existing literature by presenting the results of the effects of education-job mismatches in a developing country, characterised by a high level of youth unemployment and a complex and inefficient government structure (state level, two entities, ten cantons). First, the effect of education-job mismatch might depend on the choice of the estimation method of overeducation and undereducation incidences. Second, as results regarding education-job mismatch vary across studies, our study is the first to examine the effect of education-job mismatch on net income in the context of Bosnia-Herzegovina. As already mentioned in the introduction, Bosnia-Herzegovina has many unique labour market characteristics. The existence of education-job mismatch and the effect it has on net income should be tested and confirmed in this environment. Future studies should try to analyse the effects of over- and undereducation separately, and should consider measuring horizontal mismatch and skills mismatch. Including those variables in a single model might better explain the antecedents of net income. Third, we emphasise the importance of understanding interactions between education-job mismatch, schooling, and age of respondents. Future studies should focus on discovering other interactions that might modify the strength of the education-job mismatch effect on earnings, separating the interaction effects of over- and undereducation and other variables of interest. Fourth, we introduced three new variables to understand how they influence earnings: the importance of belonging to a family, the importance of belonging to a city, and religiousness. Finally, our findings can be generalised to the population as a whole, because the study used the rich data from the Measure BiH Youth Survey: a random stratified sample of 4,500 individuals.
Its inability to estimate the exact number of over- and undereducated individuals is the main limitation of this study – self-reported mismatch does not separate these two effects. Nevertheless, the results show that a large proportion of the country’s citizens is either overeducated or undereducated for their current job. Another limitation is that our self-reported mismatch might be caused by being employed in the wrong field. The survey was designed in a way that does not identify the existence of horizontal mismatch, or skills mismatch. Therefore, the results of education-job mismatch estimations in the first two methods should be interpreted with caution. However, the relatively low results might be caused by the use of one-digit occupation codes, as three digits codes were not available. An additional limitation of the study is the way our dependent variable is measured. Since respondents only provided their net income from formal or informal work for the previous month, the earnings shown might not reflect a respondent’s long-term prospects. Having said this, the average net income closely corresponded to the average salary at the time of data collection.
These results could provide valuable information to policymakers, especially when it comes to improving the education system and promoting entrepreneurship as a way of finding an appropriate match for an individual’s abilities. The high proportion of individuals who self-reported an education-job mismatch (58.80%) with evident earnings penalties, calls for an adjustment to educational policy, and an improvement in the quality of education. As concluded in the EC’s (2019, p.152) report, enrolment policies ‘…are inefficient in channelling students to fields of study’. Other issues include the lack of relevant strategic documents in the labour sector, low participation in pre-school education (18%), outdated teaching curricula not aligned with the country’s needs, and a lack of policies that would improve the validation of non-formal learning. To some extent, our research shows the magnitude of the problem and the consequences of these decisions. From the supply side, public and private schools and universities should establish a closer relationship with companies, to make sure students receive appropriate knowledge and skills. This should be one of the first steps taken to reduce the high rate of education-job mismatch (58.8%). Improved cooperation and partnership between companies and schools should reduce this mismatch significantly, leading to a reduction in labour market inefficiencies. Since interaction terms show that the effect of mismatch depends on age, the policy should more actively promote lifelong learning programs that target older individuals and take their learning habits into consideration. On the demand side, increasing entrepreneurial skills both in formal and non-formal education might help create start-ups that would adequately use the knowledge and skills of individuals. Finally, since overeducation is predominant, the government should improve its policies regarding labour taxes and contributions in order to temporarily increase the earnings of overeducated individuals, but also to reduce informal employment. This is also in line with the recommendation of EC (2019, p. 78), which states the ‘needs to reduce the tax wedge, especially for low-income workers, and disincentives to work in order to support formal employment’.
Supplemental Material
Download MS Word (16.8 KB)Disclosure statement
No potential conflict of interest was reported by the authors.
Additional information
Funding
Notes
1 Available at https://data.worldbank.org/indicator/SL.UEM.1524.ZS
References
- Acosta-Ballesteros, J., Osorno-del Rosal, M. P., & Rodriguez-Rodriguez, O. M. (2018). Overeducation of young workers in Spain: How much does the first job matter? Social Indicators Research, 138, 109–139. doi:10.1007/s11205-017-1643-z
- Allen, J., & Van der Velden, R. (2001). Educational mismatches versus skill mismatches: Effects on wages. Oxford Economic Papers, 53(3), 434–452. doi:10.1093/oep/53.3.434
- Caroleo, F. E., & Pastore, F. (2018). Overeducation at a glance. Determinants and wage effects of the educational mismatch based on AlmaLaurea data. Social Indicators Research, 137(3), 999–1032. doi:10.1007/s11205-017-1641-1
- Chiswick, B. R. (1983). The earnings and human capital of American Jews. The Journal of Human Resources, 18(3), 313–336. doi:10.2307/145204
- Cohn, E., Johnson, E., & Ng, Y. C. (2000). The incidence of overschooling and its effects on wages in the United States and Hong Kong. Research in Labor Economics, 19, 29–61.
- Cohn, E., & Khan, S. (1995). The wage effects of overschooling revisited. Labour Economics, 2(1), 67–76. doi:10.1016/0927-5371(95)80008-L
- Cohn, E., & Ng, Y. C. (2000). Incidence and wage effects of overschooling and underschooling in Hong Kong. Economics of Education Review, 19(2), 159–168. doi:10.1016/S0272-7757(99)00006-0
- European Commission. (2019). Analytical report: Commission Opinion on Bosnia and Herzegovina’s application for membership of the European Union. Brussels. Retrieved from https://ec.europa.eu/neighbourhood-enlargement/sites/near/files/20190529-bosnia-and-herzegovina-analytical-report.pdf
- Guiso, L., Sapienza, P., & Zingales, L. (2003). People’s opium? Religion and economic attitudes. Journal of Monetary Economics, 50(1), 225–282. doi:10.1016/S0304-3932(02)00202-7
- Kiker, B. F., Santos, M. C., & De Oliveira, M. M. (1997). Overeducation and undereducation: Evidence for Portugal. Economics of Education Review, 16(2), 111–125. doi:10.1016/S0272-7757(96)00040-4
- Kupets, O. (2016). Education-job mismatch in Ukraine: Too many people with tertiary education or too many jobs for low-skilled? Journal of Comparative Economics, 44(1), 125–147. doi:10.1016/j.jce.2015.10.005
- Kupets, O., & National University of Kyiv–Mohyla Academy, Ukraine. (2015). Skill mismatch and overeducation in transition economies. IZA World of Labor, 224, 1–10. doi:10.15185/izawol.224
- Lehrer, E. L. (2010). Religious affiliation and participation as determinants of women’s educational attainment and wages. In C. G. Ellison, & R. A. Hummer (Eds.), Religion, families, and health: Population-based research in the United States (pp. 186–205). New Brunswick: Rutgers University Press.
- Mateos-Romero, L., & Salinas-Jiménez, M. D. M. (2018). Skills use in the workplace and its effects on wages and on job satisfaction: An application to the Spanish case. Personnel Review, 47(2), 494–516. doi:10.1108/PR-03-2017-0088
- Ministry of Security. (2018). Bosnia and Herzegovina migration profile for the year 2017. Retrieved from http://www.msb.gov.ba/PDF/MIGRACIONI%20PROFIL_2017_%20ENG_FINAL.pdf
- Ng, Y. C. (2001). Overeducation and undereducation and their effect on earnings: Evidence from Hong Kong, 1986–1996. Pacific Economic Review, 6(3), 401–418. doi:10.1111/1468-0106.00141
- Quinn, M. A., & Rubb, S. (2006). Mexico’s labor market: The importance of education-occupation matching on wages and productivity in developing countries. Economics of Education Review, 25(2), 147–156. doi:10.1016/j.econedurev.2005.01.003
- Rubb, S. (2003). Post-college schooling, overeducation, and hourly wages in the United States. Education Economics, 11(1), 53–72. doi:10.1080/09645290210127453
- Studenmund, A. H. (2016). Using econometrics: A practical guide (7th ed.). Boston, MA: Pearson.
- Van der Velden, R. K. W., & van Smoorenburg, M. S. M. (1997). The measurement of overeducation an undereducation: Self-report vs. job-analyst method (ROA Research Memorandum 002). Maastricht: Research Centre for Education and the Labour Market, Faculty of Economics and Business Administration, Maastricht University.
- Verdugo, R. R., & Verdugo, N. T. (1989). The impact of surplus schooling on wages. The Journal of Human Resources, 24(4), 629–643. doi:10.2307/145998
- Wincenciak, L. (2018). The impact of horizontal and vertical educational mismatches on wages. Ekonomista, 2018(1), 50–67.
- Wolbers, M. H. (2003). Job mismatches and their labour market effects among school leavers in Europe. European Sociological Review, 19(3), 249–266. doi:10.1093/esr/19.3.249
- World Bank. (2016). Migration and remittances Factbook 2016 (3rd ed.). Washington, DC: World Bank. Retrieved from https://openknowledge.worldbank.org/bitstream/handle/10986/23743/9781464803192.pdf
- Zamfir, A. M., Matei, M. M., & Lungu, E. O. (2013). Influence of education-job mismatch on wages among higher education graduates. Procedia-Social and Behavioral Sciences, 89, 293–297. doi:10.1016/j.sbspro.2013.08.849