
 ?Mathematical formulae have been encoded as MathML and are displayed in this HTML version using MathJax in order to improve their display. Uncheck the box to turn MathJax off. This feature requires Javascript. Click on a formula to zoom.
Abstract
This work explores the influence of demographic processes, especially birth rate’s movements, on the changes in the features and organisation of primary education in Istria between years 2001 and 2017. The analyses were implemented on the level of municipalities and cities, and greater spatial units of Istria – coastal area, the inland and the city of Pula. We analysed the changes in population and student contingent, fluctuations of birth rate, net migration and the changes in primary education (number of students and classes, number of teachers and schools). The results have pointed out to the existence of a positive connection between birth rate’s change and number of students in primary schools, but also that birth rate has a postponed effect on the size of the student contingent. Spatial disparities between the Istria’s inland and coast are determined also in the features of primary education that generally adapts to demographic processes more slowly.
1. Introduction
‘We are getting fewer and older’ is a sentence which encompasses demographic problems of contemporary Croatia. Decrease in population (depopulation) and its aging represent the basic demographic processes in Croatia (Wertheimer-Baletić, Citation2004). The number of residents declines naturally, i.e. because of greater number of deaths than births, but also as a consequence of population’s migratory trends that are characterised with greater number of people emigrating than immigrating (Nejašmić, Citation2008). Although demographic problems intensified specifically after Croatia’s independence in 1991 and the Homeland War which followed, negative processes started a couple decades earlier (Vojnović, Citation2012).
Spatial changes in the features of demographic resources consequently change the structure of society and societal relationships (Nejašmić & Mišetić, Citation2010). Spatial features of primary education and its organisation also change. Decrease of student population is a direct consequence of unfavourable demographic processes. Reduction of student number leads to series of other consequences in primary education (indirect consequences): number of classes change, the size of classes is different, the ratio between single-grade and combined classes vary, the number and status of schools, number of teachers change, their usability, number of administrative staff, quality of classes etc. Accordingly, a demand for change is put forward, i.e. through rationalisation of the existing schools network.
Spatial research of education and schooling are insufficiently represented in geographical papers. On the other hand, sometimes pedagogues and sociologists write about education from the spatial aspect. When geographical research is in question, spatial aspect of education is present in urban and rural geography, economic geography, geography of population and other traditional geographical disciplines (Kučerová et al., Citation2010). Papers on regional differences in the development of education and population’s literacy rate, teachers’ qualifications etc. (‘Lexikon der Geographie’, n.d.) were published as early as the 19th century. In time, geography of education detached as a separate discipline which studies the spatial dimension of education and correlations between education and society. The initial role in establishing geography of education at the end of 1960s and the beginning of 1970s belongs to British geographers Ryba and Hones (according to Brock, Citation2013). A significant contribution to the development of geography of education, amongst others, belongs to Bondi and Matthews (Citation1988) and Brock (Citation2016). Geipel (Citation1976) is considered the creator of geography of education in German-speaking countries. Amongst German geographers Meusburger (Citation1998) and Freytag et al. (Citation2015) have published some of the capital work.
Spevec and Vuk (Citation2012), Valožić et al. (Citation2013), Vuk and Vranković (2015) and Braičić and Netoušek (Citation2018) published papers on spatial organisation of education in Croatia. Besides geographers, some pedagogues in Croatia have also mentioned ‘geographical’ aspect of education. Pastuović (Citation2012) writes about correlations between education and economy, politics, culture and ecological development.
Research topics in geography of education refer to: locations of schools and their gravity areas, school infrastructure (e.g. organisational forms of primary schools, the size of schools and the level of their equipment), participants in education (pupils, students), regional differences in the level of education of the population (e.g. literacy rate), educational behaviour of individuals, relations between education and migrations (migrations with the purpose of education, migrations of highly-educated people – brain drain), influence of education institutions in space (e.g. economic influences on establishing universities or social importance of village schools) (Freytag et al., Citation2015; Meusburger, Citation1998). Geography of education also researches the demographic potential in the system of education and upbringing as a factor that influences the functional and spatial organisation of education (Vuk & Vranković, Citation2016).
The goal of this work is to explore the influence of demographic processes, especially birth rates’s fluctuation, on the spatial changes in organisation and features of regular primary education in Istria (Croatia). The first part of the paper examines the influence of contemporary demographic development (first and foremost the natural change of population and migrations) on the size of the student contingent in population, while the other part emphasises the consequences of the change in student contingent (change in the number of students, teachers, class units, schools and schools’ status). The aim of this paper is to give scientific contribution to a better knowledge of correlation between demographic problems and spatial changes in primary school education on the example of Istria.
Istria is the biggest peninsula on the east coast of the Adriatic Sea, mostly a part of the Republic of Croatia (smaller parts of the peninsula belong to Slovenia and Italy). The land border of the peninsula stretches from Milje peninsula near Trieste, across the northern edge of Ćićarija to Klana, Kastav and Preluka cove (Bertoša & Matijašić, Citation2005). The biggest part of the Croatian Istria belongs to Istrian County (its smaller part is a part of Primorsko-Goranska County) so this paper considers Istria as the area of today’s Istrian County.
Istria is characterised by somewhat more favourable demographic movements than most Croatian counties. During the last inter-census period of 2001–2011, the population’s number grew only in the city of Zagreb, Zagreb County, and Zadar and Istria County. All other counties experienced depopulation. Population’s number in Istria was enlarged with about two thousand (0.8%) people, despite the fact that number of deaths exceeded the number of births (Klempić Bogadi & Lajić, Citation2015). This means that the increase of population in Istria is a consequence of positive net migration – more immigrants than emigrants (Klempić Bogadi & Lajić, Citation2015).
2. Methodological remarks
The research encompassed the period from 2001 to 2017, the birth rate being monitored since 1990. We used secondary data sources published by the Croatian Bureau of Statistics (CBS). Foremost, we used the population census data from years 2001 and 2011 and vital statistics. It has to be pointed out that the censuses in 2001 and 2011 were conducted under different methodologies, which makes the published data not completely comparable. Therefore, during the analysis of census changes in the number of population, the data for ‘total population’ was used, even though the definition of total population in the two censuses is different (more information on comparability of census data can be found on the web page CBS). To establish the state and changes in primary education, we used the annual publication of the Croatian national statistics bureau Basic Schools and Kindergartens and Other Legal Entities Implementing Preschool Education Programmes. To calculate crude birth rate the common formula has been used (Murray, Citation1997):
where:
B – number of live births per year,
P – total population (estimate).
To calculate the net migration rate for the inter-census period 2001–2011, the following term was used (Mistri, Citation2015):
where:
NMR – net migration rate,
NM – net migrants,
P2001 – total population of 2001 census.
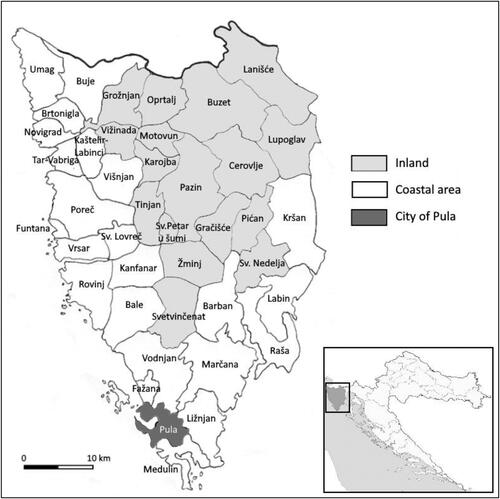
The analyses were done on the level of municipalities and cities and on the level of three bigger spatial units singled out for the purposes of this work: Istria’s inland, coastal area and the City of Pula (). The coastal area includes cities and municipalities whose territory stretches along the coastline, i.e. cities and municipalities whose centre is no more than 10 km of road distance away from the nearest coastal settlement. This model of extracting municipalities and cities in the coastal area was suggested by Opačić (Citation2009). The city of Pula is singled out as a special whole due to its demographic size. Two new municipalities were formed in Istria in 2006: Tar-Vabriga, formed after extracting from the city of Poreč and Funtana, formed after extracting from Vrsar municipality. In order to get a line of data that can be compared according to the area for the period between 2001 and 2007, the data for the ‘new’ Tar-Vabriga municipality were expressed together with the data for the city of Poreč, while the data for Funtana municipality were expressed together with the ones for Vrsar municipality.
Figure 1. Administrative-territorial division and spatial units of Istria. Source: Prepared by the author, according to Opačić (Citation2009).
3. Influence of demographic development and fertility on the size of student contingent
Despite methodological differences in the last two censuses we believe that they do not influence the augury of demographic changes. Therefore, it can be claimed that Istria is one of the few counties which did not register total depopulation in the period between 2001 and 2011 (Živić, Citation2015). However, the growth that happened is minimal and it is due to favourable demographic movements in the coastal area (). Population of the coastal area has risen by 3.5% while the inland population lessened by 2.5%. The number of residents in the city of Pula has also dropped by 1.9%. Despite the slight growth in the population of Istria, most other demographic and structural-demographic indicators show more distinct regressive characteristics of population (Živić, Citation2015). The number of children between ages 7–14 (student, i.e. primary school contingent) has dropped drastically – more than 20%. In 2001, 18.5 thousand children between ages 7–14 lived in Istria. In year 2011, this number was only 14 thousand (CBS, Citation2001, Citation2013). The drop in the number of children is most noticeable in Istria’s inland that has lost more than one fifth of its student population in the last ten years. It could be inferred that the rise in total population was aided by the growth of mature or old population.
Table 1. Population and primary school contingent in greater spatial units of Istria in years 2001 and 2011.
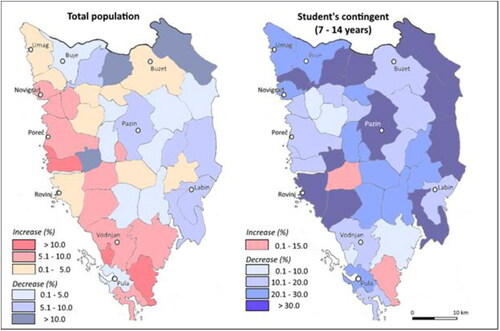
The given cartogram () shows the continual area of cities and municipalities on the western coastal line and the south of Istria, in which the growth of total population was noted between years 2001 and 2011. More significant rise in population was observed in the cities Novigrad, Vodnjan and Poreč (with Tar-Vabriga), and municipalities Ližnjan, Fažana, Vrsar (with Funtana), Kaštelir-Labinci, Marčana, Medulin, Bale, Kanfanar and Sveti Petar u Šumi. On the other hand, student contingent is lowered in all local units except in municipalities Kanfanar and Ližnjan. It should be pointed out that the greatest increase of not only total population (34.6%), but also of student population (12.4%), was noted in Pula’s suburban municipality Ližnjan. The drop in student population affected both local districts in the peninsula’s inland and those in the coastal area. Number of children (7–14 years of age) has decreased more than 30% in the cities of Pazin and municipalities Oprtalj, Lanišće, Kršan, Lupoglav, Raša, Grožnjan, Brtonigla and Sveti Lovreč.
Figure 2. Changes in the population and student contingent between 2001 and 2011 in cities and municipalities of Istria. Source: Prepared by the author, according to CBS (Citation2001, Citation2013).
The decrease of student population is a result of more factors. First, the size of student population depends not only on fertility, i.e. birth-rate, but also on the migratory trends of the population. Although Istria is perceived today as immigration space (Klempić Bogadi & Lajić, Citation2015), since student contingent is lessening, it is obvious that settlement of greater number of young population or families with children has not occurred.
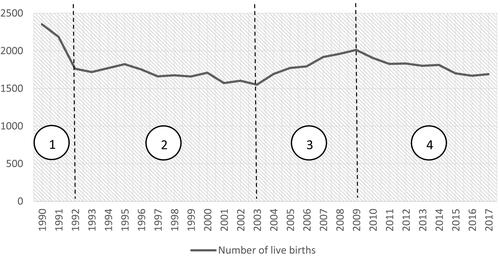
This work studies the birth rate’s movements since year 1990, since children become a part of the student (primary school) contingent with seven years of age and are a part of that contingent for eight years to follow. The birth rate’s fluctuations in Istria from 1990 to 2017 can be divided into several phases (). Since the beginning of the nineties of the last century, demographic growth in Croatia has been under the influence of destabilising factors such as war aggression and occupation of parts of the Croatian territory (Nejašmić & Mišetić, Citation2010). In such circumstances, already at the beginning of the 90s of the last century, a sudden decrease of the number of live births was noticed. It represents the continuation of birth rate’s drop from the 80s of the last century, when population of Istria entered the post-transitional stage of demographic transition (Zupanc, Citation2004a). In the pre-war year of 1990, 2353 children were born in Istria, only for this number to drop to 1762 live births in year 1992. Between years 1992 and 2003, the drop in birth rate is still present, but slowed down, i.e. the birth rate’s movements oscillate. The number of live births was the lowest in year 2003, when only 1551 children were born in Istria. After that, a more progressive era of fertility’s growth followed and climaxed in 2009. More than two thousand children were born in Istria that year, for the first time since 1991. However, since year 2009, the features of natural population change have become less favourable, i.e. birth rate has started to drop once more (CBS, 2002–2018).
Figure 3. Changes in the number of live births in Istria from 1990 to 2017. Source: Prepared by the author, according to Pokos and Živić (2006) and CBS (2002–2018).
In order to determine the reasons for birth rate’s growth between years 2003 and 2009, a couple of decades trip to the past is necessary, i.e. a trip to a time after the Second World War. In Croatia, the time after the Second World War up to 1954 was marked by so-called compensational fertility. It is a well-known fact that upon the end of war conflicts mostly (shorter) periods of birth rate’s growth happen, after which the number of live births starts to decline again (Nejašmić, Citation2008). After the compensational period in Istria, the birth rate decreases up to the beginning of 1970s, when it rises again for a short while. Numerous generations born in the compensational period after the Second World War entered their fertile age in those years. The era of birth rate’s growth lasted only up to the end of 1970s (Zupanc, Citation2004a). In the period of 2003–2009, a more numerous population born during the 1970s entered their fertile age (grandsons and granddaughters of a more numerous population born immediately after the Second World War), which contributed to the rise in the number of live births in time that is more recent.
The question of whether it is possible to explain the number of live births in one part with immigration character of Istria arises. Although the net migration is positive, it should be known that, at the same time, as early as in the 90s of the last century, the emigration from Istria of younger, work active population that left to more developed countries (i.e. Italy) was also noted (Pokos & Živić, 2006). Positive net migration of Istria is conditioned with settlers from other parts of Croatia who are mostly older than people who emigrated from Istria (Pokos & Živić, 2006). Considering the fact that emigration of population groups of a more vital age leads to decrease of births (Nejašmić, Citation2015), positive net migration could not contribute to fertility’s increase more significantly.
If we observe the changes in fertility in three larger spatial units singled out in Istria (), we come to the following conclusions. In 2011, fertility in all three spatial units was greater than in 2001. Although the fertility in 2017 in all spatial units was smaller than in 2011, it was nevertheless greater than in 2001 in the inland of Istria and along the coast. The exception is Pula in which the number of live born children in 2017 was 10.5% less than in 2001. On the other hand, in 2017, 25.6% more children were born in the inland than in year 2001. In the coastal area, that number was 11.6% higher. Although the inland noted somewhat higher birth rates than the coastal area, the absolute number of live births is small. In the midst of long-term depopulation, inland Istria is a relatively rarely inhabited space marked with fossilised landscape (Zupanc, Citation2004a). Almost three times more children were being born in the coastal area (without Pula) than in the inland.
Table 2. Birth rate’s in greater spatial units of Istria in years 2001, 2011 and 2017.
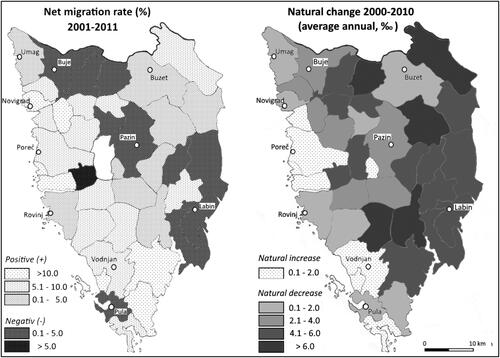
The analysis of migrations in the inter-census period between 2001 and 2011 is based on the use of vital-statistics method. The net migration was created by the comparison of data on total change in the population number and the natural change (). Even though the positive net migration of Istria is mostly contributed by the coastal area (about 5 thousand more immigrants than emigrants), the net migration is positive in the inland as well. However, unlike on the coastal area, large natural loss of population inland is not possible to be replaced by positive net migration. The contribution of net migration to total change in the population is shown by the net migration rate (Nayar, Citation2014). This indicator in the coastal area is a significant 5%, while it is only 1.2% in continental Istria.
Table 3. Net migration in greater spatial units of Istria between 2001 and 2011.
The attached cartograms () clearly show that Istria is dominated by municipalities and cities with positive net migration but negative natural change. However, a positive net migration mostly did not reflect on the growth of student contingent (P 7–14) which was, to remind you, documented in only two Istrian municipalities (Ližnjan, Kanfanar). Negative net migration was established in a dozen local units. Those are some municipalities in the north of Istria (like Buje, Grožnjan, Oprtalj), then parts of central Istria (Pazin, Karojba) as well as the eastern coastal area (Raša, Labin, Kršan). An extremely negative net migration appears in municipality Sveti Lovreč with the net migration rate of −23.1%. At the same time, the student contingent has dropped by 37.5%. Pula has to be added to the previously mentioned cities and municipalities, where, to be honest, the population decreases mostly due to negative natural change. However, a part of the population decrease has to be attributed to a slightly negative migration balance. Local units with pronouncedly decreased student population (over 30%) which coincides with negative net migration are Grožnjan, Oprtalj, Pazin, Sveti Lovreč, Kršan and Raša.
Figure 4. Net migration and natural change of population between 2001 and 2011 in cities and municipalities of Istria. Source: Prepared by the author, according to CBS (Citation2001, 2002–2018, 2013).
Unlike the city of Pula, its suburban area attracts immigrants, which resulted in significant migration assets for the suburban municipalities between 2001 and 2011. The net migration rate was 34.9% in Ližnjan, 13.7% in Marčana and 18% in Fažana municipality. Despite that, there was a slight decrease in student contingent in the listed municipalities (except in Ližnjan municipality). It has to be noted that certain peripheral parts of Istria which have been marked by intensive emigration and depopulation for decades, and are still developing in the conditions of periphery, have a positive net migration (like Lanišće municipality), which is more the result of a fact that there is no one to emigrate from those areas than the immigration of new population (Vojnović, Citation2015; Zupanc, Citation2004b).
Since it is not possible to apply vital-statistics method for the period between 2011 and 2017, because the next census is in 2021, general insite into migrations is enabled by the data provided by the CBS based on registration and notice of departure at the Ministry of Home Affairs. However, this data is fairly inaccurate since the number of immigrants is usually overrated while the number of emigrants is underrated (Živić, Citation2017). Therefore, such data will not be used for detailed analysis in this paper. Between 2011 and 2017, according to this data, 18,267 people moved to Istrian County from other counties and from abroad, while 14,465 people emigrated. Net migration is positive in the coastal area since 11,649 people immigrated (from other counties and from abroad) while 8651 people emigrated, as well as in the city of Pula with 5266 immigrants and 4382 emigrants. On the other hand, net migration is slightly negative inland (1352 immigrants and 1432 emigrants or moved) (CBS, Citation2019).
4. Influence of the student contingent’s change on spatial contents and models on primary education
Changes in the student contingent reflect on the features and organisation of primary education. Firstly, the change in the student contingent also means a change in the number of students in primary schools. The fluctuation of student numbers in the period from the school year 2000/2001 up to school year 2016/2017 in Istria can be divided into three stages (). The first stage, i.e. period from the school year 2000/2001 to 2006/2007, is marked with significant decrease of the student number in primary schools. Between school years 2006/2007 and 2011/2012, the number of students continues to drop, but the decline is impeded. Only 14,243 students were registered in Istria at the end of the school year 2011/2012, the number being the smallest in the observed area. In this school year, the number of students dropped by almost 4400 students, when compared to the beginning of the observed period. A mild but steady growth of student number is noted in the last stage (from school year 2012/2013 on). At the end of the school year 2016/2017, there were 14,775 students (of primary school) in Istria, i.e. five hundred more than in the school year 2011/2012 (CBS, Citation2002–2005, 2006–2018). Of course, the number of students is still significantly lower than at the beginning of the observed period.
Figure 5. Change in the number of students in Istria from school year 1992/1993 to school year 2016/2017. Source: Prepared by the author, according to CBS (Citation2002–2005, 2006–2018).
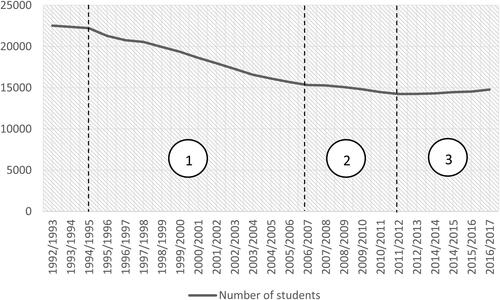
The changes in the number of students are directly linked to fertility’s fluctuations. Since fertility has a postponed effect on the size of the student contingent, a more significant drop in student number at the beginning of the 21 century is a reflection of sudden fertility’s drop from the beginning of 1990s, and from the end of 1980s. The period of impeded decline of student number (from the school year 2006/2007 to the school year 2011/2012) is conditioned with the softened drop in fertility after 1992. The fertility’s rise between years 2003 and 2009 has contributed to the rise of student number that has lasted since the school year 2012/2013 up to today. However, having in mind that the number of live born children in Istria after 2009 has been dropping, it is to be expected that in the near future the trend is about to change again, i.e. number of students in primary schools will drop expectedly.
The change in the number of students is reflected on the number and size of classes (). In the school year 2016/2017, there were 17 classes less than in school year 2000/2001 in Istria. The number of classes has dropped by only 7.6% while the number of students has dropped significantly more – over 20% (CBS, Citation2002–2005, 2006–2018). Apart from smaller number of classes, the average number of students per a class has declined from 20.3 to 17.4 students. Greater number of students is usually a characteristic of large environments. Average number of students in Pula is 21.4, in the coastal area 16.7 students and in the inland as little as 14.5 students. The size of class units is also the result of political decisions, which does not always make it in accordance with spatial, demographic, economic and other laws.
Table 4. Students, teachers and classes in spatial units of Istria at the end of school years 2000/2001, 2010/2011 and 2016/2017.
In the school year 2016/2017, the noted average number of students per class was more than 20 only in the city of Pula and Višnjan municipality. On the other hand, in the school year 2000/2001, apart from the city of Pula, the average number of students per class bigger than 20 was also noted in a series of local units along the coast (Rovinj, Labin, Poreč, Umag) and in Istria’s inland (Tinjan, Pazin, Karojba) (calculated by the author according to CBS, Citation2002–2005, 2006–2018).
The displayed cartograms () show an increase of the number of local units in which extremely small classes prevail. That is, at the end of the school year 2016/2017, in municipalities Brtonigla and Bale from the coastal area and municipalities Lanišće, Pićan, Oprtalj, Motovun, Svetvinčenat, Gračišće and Cerovlje in the inland, the average number of students per class was less than 10. Such extremely small number of students in a class was not determined in any of the cities in Istria. At the beginning of the observed period, i.e. in the school year 2000/2001, an average class had less than 10 students only in municipalities Lanišće, Brtonigla and Oprtalj.
Figure 6. Average number of students per class in cities and municipalities of Istria at the end of schools years 2000/2001 and 2016/2017. Source: Prepared by the author, according to CBS (Citation2002–2005, 2006–2018).
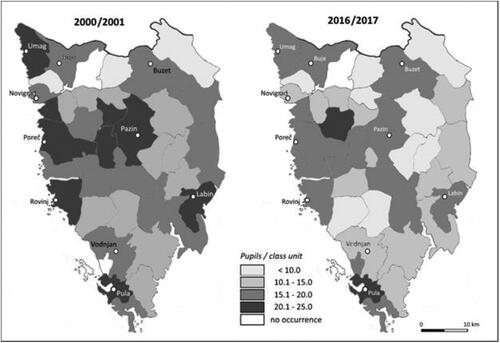
Demographic and social conditions in the municipality Lanišće, which stretches on the karst mountain areas of Ćićarija, are especially unfavourable. It is an area of long-lasting depopulation in which certain villages have been completely abandoned long ago (Vresk, Citation1987). Population is scarce, mostly rural, of older age and poorly educated (Vojnović, Citation2012). Population’s density is as little as 2.3 people per square kilometre (2011), and is the smallest in Istria. This area has the distinctive demographic, infrastructural and economic characteristics of periphery (Vojnović, Citation2015). In this municipality, only one local primary school worked and only four students attended in the school year 2016/2017. Before, there were school objects in settlements Brest, Račja Vas, Trstenik, Vodice and Slum (Municipality of Lanišće, Citation2000).
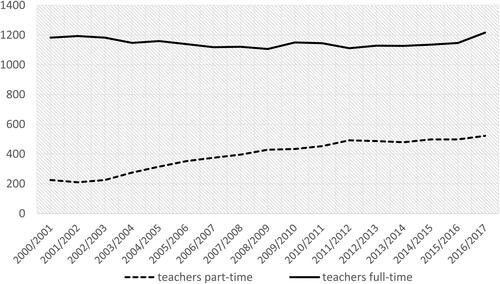
The change in the number of teachers in primary education system is not proportional to the change in the number of students and classes. Despite the decline of student number, according to data from the CBS, the total number of teachers has even risen in the observed area. In reality, due to the drop in the number of classes, a significant rise in the number of teachers working part time occurred. Thus, it is more relevant to observe the changes in the number of teachers on full time. Their number has not changed more significantly in the stated period (). The gap between fluctuations in the number of students and the number of teachers is a consequence of diverse factors’ influence. Firstly, the number of students in classes has dropped in general, but the classes can have less students than the standard prescribes with the approval of the department ministry. Furthermore, teachers working overtime has been limited, which consequently increases the number of teachers who work part time (Braičić & Netoušek, Citation2018). Since school year 2002/2003, obligatory learning of one foreign language has been introduced in the first form of primary school (Radišić, Citation2004), which in turn increases the need for foreign languages teachers.
Figure 7. Change in the number of teachers in Istria from school year 2000/2001 to school year 2016/2017. Source: Prepared by the author, according to CBS (Citation2002–2005, 2006–2018).
Between school years 2000/2001 and 2016/2017, the number of primary schools (school units) in Istria changed slightly (). In spite of unfavourable demographic conditions that, in greater part of this period, have a consequence of lowering the number of students and classes, a more significant rationalisation of primary schools network is thus far missing. Spatial arrangement of primary schools is adapting to demographic trends more slowly. Mostly, it is about closing a couple of four-year, i.e. local primary schools. During this period, branch schools stopped functioning in settlements Karigodor (municipality of Brtonigla), Koromačno (municipality of Raša), Livade (municipality of Oprtalj), then the school in Rovinj suburban settlement Mondeleko, etc. (‘Na području Labinštine’, 2013; Zupanc, n.Citationd.). Natural population decrease was recorded in all mentioned local units between 2001 and 2011, while Raša and Oprtalj municipalities also had negative migration balance. The consequence was the reduction in student population of over 30% in the same period. In 2015, the only private primary school in Istria based in Pula also stopped working. We also find the examples of new schools opening in the demographically more propulsive parts of Istria (i.e. Poreč) (Kocijančić, Citation2010). The present lack of four-year schools should be noticed in parts of more scarcely populated inland of Istria, as opposed to the coastal area. The inland has the ratio of 17 eight-year schools and only 10 four-year schools, while there are 29 eight-year and even 36 four-year schools in the coastal area (calculated by the author according to CBS, Citation2002–2005, 2006–2018).
Table 5. Number of primary schools in greater spatial units of Istria at the end of school years 2000/2001, 2010/2011 and 2016/2017.
Although several branch schools are still in danger of closing, the rise in the number of students in primary schools observed in the last few years will slow down this process for a short time. Nevertheless, since the number of students is expected to drop again, the question of some schools closing will become our reality once again. The decision makers should bear in mind that the loss of schools, especially in rural areas, has a number of negative geographical (and other) implications, e.g. the problem of organising transportation of students from home to school, speeding up the process of emigration, absence of immigration of young families with children and the threat of social devastation of villages since school also has the function of ‘social crystallization’ (Freytag et al., Citation2015). Some advocates of the survival of small schools see the solution in their transformation into multifunctional centres, e.i. schools should assume other functions besides education (Vranković, Citation2017).
In 2019, Ministry of Science and Education created some guidelines for the creation of a new network of schools. The document emphasises the need for optimizstion of school network which includes coordination with geographical, demographical, economic and educational indicators. Amongst other things, it is necessary to re-examine the validity of independent work of schools with the number of students lower than optimal (less than 300) in order to conduct the rationalisation of school network (Ministry of Science and Education, Citation2019).
5. Conclusion
Istria is characterised by somewhat more favourable demographic movements than Croatia as a whole. Net migration is positive although the number of deaths exceeds the number of births since a long time ago. County’s immigration character, present from the 1970s up to today, has not reflected itself on the number of live births more significantly. Birth rate dropped during the second half of the last century, apart from shorter periods when it rose. Significant decline of the number of students in the first decade of the 21st century is mostly a consequence of birth rate’s drop in the end of the 80s, and especially the beginning of the 90s of the last century. After birth rate being increased in Istria in the period from 2003 to 2009, the number of students started to increase as well, but only after 2012. The oscillation in the number of students gained an ascending trend a couple of years after, but then birth rate started to drop again. It is deducible that migrations had a smaller impact on the change of the number of students than natural changes. Depopulation is caused more and more by natural decrease (Zupanc, Citation2001). For example, despite the fact that most cities and municipalities in Istria had a positive net migration between 2001 and 2011, the number of students in primary schools decreased almost everywhere, even in those local units which had an extremely positive migration balance (cities and municipalities Novigrad, Fažana, Kaštelir-Labinci, Ližnjan, Marčana and Vrsar). During the same period the student contingent in Istria increased only in municipalities Ližnjan and Kanfanar. On the other hand, a few local units were identified where an extreme decrease of student contingent and negative net migration were recorded at the same time (Grožnjan, Oprtalj, Pazin, Sveti Lovreč, Kršan and Raša).
Spatial disparities between the inland and the coast of Istria are also visible in the features of primary education. Istria’s inland is scarcely populated, the decrease of student number during recent time was present more, classes are smaller on average, there is a significant a lack of branch (4-year) schools in inland, etc.
Primary education is adapting to demographic changes in its slow pace, although changes in the number of students inevitably reflect on the number and size of classes, number and usability of teachers, schools etc. The drop in the student number in the first decade of the 21 century has been faster than the changes in organisation of primary education (i.e. decrease of the number of classes, number of teachers etc.).
Changes in spatial organisation of primary education will depend on the present and future demographic development that will influence the establishment of new primary schools network. Since the birth rate’s values in Istria after 2009 have been descending, it is to be expected the number of students to drop again in the near future, which will actualise the question of closing some schools or changing their status. Since the consequences of discontinuation of schools in that area can be multiple, including a complete social devastation of an area, a great responsibility lies on the decision makers.
Disclosure statement
No potential conflict of interest was reported by the author.
References
- Bertoša, M., & Matijašić, R. (Eds.). (2005). Istarska enciklopedija [Istrian Encyclopedia]. The Miroslav Krleža Institut of Lexicography.
- Bondi, L., & Matthews, M. H. (Eds.). (1988). Education and Society: Studies in the Politics, Sociology and Geography of Education. Routledge.
- Braičić, Z., & Netoušek, D. (2018). Prostorna organizacija osnovnog školstva Sisačko-moslavačke županije u kontekstu suvremenih demografskih kretanja [Spatial Organization of Primary Education in Sisak and Moslavina County in the Context of Contemporary Demographic Changes]. In I. Prskalo, Z. Braičić, & M. Badrić (Eds.), 17th mate demarin days: Education – The future of civilization (book of proceedings). (pp. 191–201). Faculty of Teacher Education Zagreb.
- Brock, C. (2013). The geography of education and comparative education. Comparative Education, 49(3), 275–289. doi:https://doi.org/10.1080/03050068.2013.803818
- Brock, C. (2016). Geography of education: Scale, space and location in the study of education. Bloomsbury Academic.
- Croatian Bureau of Statistics (CBS). (2001). Popis stanovništva, kućanstava i stanova 2001: kontingenti stanovništva [Census of populations, households and dwellings 2001: Population contingents]. Croatian Bureau of Statistics. Retrieved November 21, 2018, from https://www.dzs.hr/
- Croatian Bureau of Statistics (CBS). (2002–2005). Osnovne škole i dječji vrtići: kraj školske godine … i početak školske godine … [Basic Schools and Kindergartens: End of … and Beginning of … School Year]. Croatian Bureau of Statistics.
- Croatian Bureau of Statistics (CBS). (2002–2018). Prirodno kretanje. stanovništva u … [Natural change in population …]. Croatian Bureau of Statistics.
- Croatian Bureau of Statistics (CBS). (2006–2018). Osnovne škole i dječji vrtići i druge pravne osobe koje ostvaruju programe predškolskog odgoja, kraj šk./pedag. g. … i početak šk./pedag. g. … [Basic Scools and Kindergartens and Other Legal Entities Implementing Preschool Education Programmes, End of … and Beginning of … School/Pedagogic Year]. Croatian Bureau of Statistics.
- Croatian Bureau of Statistics (CBS). (2013). Popis stanovništva, kućanstava i stanova 2011: stanovništvo prema spolu i starosti, Statistička izvješća 1468 [Census of population, households and dwellings 2011: population by sex and age, Statistical reports 1468]. Croatian Bureau of Statistics.
- Croatian Bureau of Statistics (CBS). (2018). PC-Axis Databases: Population estimate by sex, by towns/minicipalities, 31 December. Croatian Bureau of Statistics. Retrieved December 22, 2018, from https://www.dzs.hr/
- Croatian Bureau of Statistics (CBS). (2019). PC-Axis Databases: Immigrant and emigrant population by towns/minicipalities. Croatian Bureau of Statistics. Retrieved December 15, 2019, from https://www.dzs.hr/
- Freytag, T., Jahnke, H., & Kramer, C. (2015). Bildungsgeographie [Geography of education]. WBG.
- Geipel, R. (1976). Zur Entstehungsgeschichte des Forschungsansatzes “Geographie des Bildungsverhaltens” [History of the origin of the research approach “Geography of Educational Behavior”]. Mitteilungen der Österreichischen Geographischen Gesellschaft, 118, 3–8.
- Klempić Bogadi, S., & Lajić, I. (2015). Suvremena migracijska obilježja statističkih jedinica Republike Hrvatske [Current Migration Characteristics of Statistical Units of the Republic of Croatia]. Migracijske i etničke teme / Migration and Ethnic Themes, 30(3), 437–477. doi:https://doi.org/10.11567/met.30.3.7
- Kocijančić, T. (2010, August 28). Otvorenje nove osnovne škole i sportske dvorane Finida [Opening of the new elementary school and sports hall of Finida]. Retrieved from https://www.glasistre.hr/istra/finida-otvorenje-nove-osnovne-skole-i-sportske-dvorane-568869
- Kučerová, S., Kučera, Z., & Chromý, P. (2010). An elementary school in networks: Contribution to geography of education. Europa XXI, 21, 47–61. doi:https://doi.org/10.7163/Eu21.2010.21.4
- Lexikon der Geographie. (n.d.). Bildungsgeographie. Retrieved February 12, 2019, from https://www.spektrum.de/lexikon/geographie/bildungsgeographie/972
- Meusburger, P. (1998). Bildungsgeographie. Wissen und Ausbildung in der räumlichen Dimension [Geography of education: Knowledge and education in the spatial dimension]. Spektrum Akademischer Verlag.
- Ministry of Science and Education. (2019). Smjernice za izradu mreže školskih ustanova i programa odgoja i obrazovanja [The guidelines for the creation of network of schools and education programmes]. Retrieved July 17, 2019, from https://mzo.gov.hr/UserDocsImages//dokumenti/PristupInformacijama/eSavjetovanja-2019/
- Mistri, A. (2015). Estimation of Internal Migration in India, 2011 Census based on Life Table Survival Ratio (LTSR) Method. MPRA. Retrieved November 12, 2019, from https://mpra.ub.uni-muenchen.de/61577/1/MPRA_paper_61577.pdf
- Municipality of Lanišće. (2000). Prostorni plan uređenja općine Lanišće [The Physical Plan of a Municipality of Lanišće]. Retrieved February 15, 2019, from http://opcinalanisce.com/assets/files/Prostorni_plan/PPUO_Lanisce.pdf
- Murray, B. G. (1997). On calculating birth and death rates. Oikos, 78(2), 384–387. doi:https://doi.org/10.2307/3546306
- Na području Labinštine. (2013, July 13). Na području Labinštine najveći pad upisa učenika u prvi razred osnovne škole u Istri [In the area of Labin, the largest drop in students enrolled in the first grade of elementary school in Istria]. Retrieved from https://www.labin.com/vijesti/na-podrucju-labinstine-najveci-pad-upisa-ucenika-u-prvi-razred-osnovne-skole-u-istri--koromacno-ostalo-bez-djece-21674
- Nayar, B. R. (2014). Globalization and India’s economic integration. Georgetown University Press.
- Nejašmić, I. (2008). Stanovništvo Hrvatske: demogeografske studije i analize [Population of Croatia - demogeographical studies and analyses]. Croatian Geographic Society.
- Nejašmić, I. (2015). Iseljavanje iz Hrvatske od 1900. do 2001.: demografske posljedice stoljetnog procesa [Emigration from Croatia from 1900 to 2001: Demographic Consequences of the Centuries-Old Process]. Migracijske i etničke teme / Migration and Ethnic Themes, 30(3), 405–435. doi:https://doi.org/10.11567/met.30.3.6
- Nejašmić, I., & Mišetić, R. (2010). Sintetički pokazatelj demografskih resursa: doprinos tipologiji hrvatskog prostora [A Synthetic Indicator of Demographic Resources: Contribution to the Typology of Croatian State Territory]. Croatian Geographical Bulletin, 72(1), 49–62.
- Opačić, V. T. (2009). Recent characteristics of the second home phenomenon in the Croatian Littoral. Hrvatski geografski glasnik/Croatian Geographical Bulletin, 71(1), 33–66. doi:https://doi.org/10.21861/HGG.2009.71.01.03
- Pastuović, N. (2012). Obrazovanje i razvoj: kako obrazovanje razvija ljude i mijenja društvo, a kako društvo djeluje na obrazovanje [Education and development: how education develops people and changes society, and how society affects education]. Institut for Social Research in Zagreb and Faculty of Teacher Education.
- Pokos, N., & Živić, N. (2006). Suvremena demografska slika Istre [The Recent Demographic Picture of Istra]. In M. Manin, Lj. Dobrovšak, G. Črpić, & R. Blagoni (Eds.), Identitet Istre – ishodišta i perspektive (pp. 393–417). Institut of Social Sciences Ivo Pilar.
- Radišić, M. (2004). Kako pristupiti razvijanju vještine pisanja u prvom razredu osnovne škole na nastavi engleskog jezika kao stranog jezika? Život i škola, 12(2), 33–40.
- Spevec, D., & Vuk, R. (2012). Demografski resursi i potencijali te organizacija primarnog obrazovanja u Krapinsko-zagorskoj županiji [Demographic Resources and Potentials of the Krapina-Zagorje County and the Organization of Primary Education]. Hrvatski geografski glasnik/Croatian Geographical Bulletin, 74(1), 187–212. doi:https://doi.org/10.21861/HGG.2012.74.01.10
- Valožić, L., Radeljak, P., & Grbac Žiković, R. (2013). Prostorna analiza upisnih područja osnovnih škola u Gradu Zagrebu [Spatial Analysis of Primary Schools’ Catchment Areas in the City of Zagreb]. Hrvatski geografski glasnik/Croatian Geographical Bulletin, 74(02), 27–51. doi:https://doi.org/10.21861/HGG.2012.74.02.02
- Vojnović, N. (2012). Demografski resursi općina i gradova Istarske županije [The Demographic Resources of the Municipalities and Towns of Istria County]. Annales: Anali za istrske in mediteranske študije, Series Historia et Sociologia, 22(1), 187–198.
- Vojnović, N. (2015). Općina Lanišće: razvoj turizma u uvjetima periferije [Municipality of Lanišće: development of tourism in the periphery]. In D. Križman Pavlović, M. Manente, A. Perkov & C. Povolo (Eds.), Proceedings of the International Scientific Conference Istrian Economy Yesterday and Tomorrow (pp. 399–407). State Archives in Pazin.
- Vresk, M. (1987). Polarizacijski efekti urbanizacije Istre [Polarization Effects of the Urbanization of Istria]. Transactions, 22, 43–53.
- Vuk, R., & Vranković, B. (2016). Utjecaj demografskih procesa na organizaciju primarnog obrazovanja u Splitsko-dalmatinskoj županiji [The Influence of Demographic Processes in the Organization of Primary Education in Split-Dalmatia County]. Školski vjesnik, 65(Sp.Ed), 287–300.
- Vranković, B. (2017). Geografski aspekti razvoja mreže osnovnih škola u Hrvatskoj [Geographic aspect of elementary school network development in Croatia] (Unpublished doctoral dissertation). Faculty of Science.
- Wertheimer-Baletić, A. (2004). Depopulacija i starenje stanovništva – temeljni demografski procesi u Hrvatskoj [Depopulation and Ageing – Crucial Demographic Processes in Croatia]. Društvena istraživanja, 13(4–5), 631–651.
- Zupanc, I. (2001). Demografska kretanja sjeverne hrvatske Istre od 1857. do 1991. godine [Demographic Movements in Northern Croatian Istria Between 1857 and 1991]. Annales, 11(2), 321–342.
- Zupanc, I. (2004a). Demogeografski razvoj Istre od 1945. do 2001 [Population Development of Istria in the Period 1945–2001]. Hrvatski geografski glasnik/Croatian Geographical Bulletin, 66(1), 67–102. doi:https://doi.org/10.21861/HGG.2004.66.01.04
- Zupanc, I. (2004b). Demografski razvoj općine Lanišće 1857. 2001. [Popula tion Development of Lanišće Municipality in the Period. 1857-2001]. In B. Jakovljević (Ed.), Zbornik općine Lanišće 2004 [Proceedings of Lanišće Municipality 2004] (pp. 229–262). “Josip Turčinović”.
- Zupanc, I. (n.d.). Studija slučaja – Općina Oprtalj (Projekt CRORURIS). Retrieved November 8, 2018, from https://www.pmf.unizg.hr/_download/repository/Studija_Oprtalj.pdf
- Živić, D. (2015). Reprodukcija radnog kontingenta kao odrednica suvremenog gospodarskog razvoja Istarske županije [The Population in Working Age as Aspects of Modern Economic Development iof Istria County]. In D. Križman Pavlović, M. Manente, A. Perkov & C. Povolo (Eds.), Proceedings of the International Scientific Conference Istrian Economy Yesterday and Tomorrow (pp. 463–471). State Archives in Pazin.
- Živić, D. (2017). Demografsko izumiranje hrvatskoga istoka [Demographic Extinction of Eastern Croatia]. Pilar, 12(2), 9–26.