
Abstract
Fund performance has been a hot topic in the financial research area, fair and correct evaluation of fund performance is of great significance for fund investors and companies. However, most of the relevant publications do not have any retrospective analysis of this topic in terms of knowledge domain to show its development trends and research concerns. To address this issue, two effective bibliometric tools namely Citespace II (The 5.3.R4 Edition) and SciMat are used to analyze the knowledge domain of this field in this paper. We have analyzed 979 articles related to fund performance from Web of Science between 1966 and 2019 (July), the analysis content includes the current status, collaboration network, co-citation network, and emerging trends of fund performance research, then we have derived the following desired conclusions: (1) In the last twenty years, there was a significant increase in the publication and citation numbers of fund performance research; especially, the relative research has become interdisciplinary and internationalized. (2) “Mutual Fund Performance”, “Fund Return”, “Investment Performance”, and “Portfolio Selection” are the hottest topics in the fund performance research. (3) “Small Fund” and “Investor Reaction” are the two emerging trends in the fund performance research. To sum up, there are two main contributions in this paper: First, we provide a full bibliometric analysis about the fund performance research. Second, we make the further development of fund performance research easier and more clearly to show the directions to learn and study for beginners.
1. Introduction
As an important investment mechanism of modern finance, investment fund plays a significant role in the future development of the financial market. However, in the fund related research, the hot question is fund performance (Qi & Sun, Citation2016). Not only does fund performance directly affect the stock market development and small investors’ benefits, but also it relates to the entire financial market stability. Therefore, the research on fund performance is significant. In the 1960s, scholars began to study the issue of fund performance (Sharpe, Citation1966). In the last twenty years, the literature in this field has increased significantly (Kenchington, Citation2019). Nowadays, the efficiency analysis of securities investment funds is a vital issue in modern financial theory. There are many investigations in this field, from traditional simple return analysis without risk factors to empirical studies with risk factors, as well as the analysis with operational research methods. In order to evaluate the efficiency of the fund more accurately and provide useful information for investors, fund companies, and regulators, the evaluation methods are being improved step by step.
Then, some studies have made remarkable progress. Researches in this field can be divided into several areas. On the one hand, some researchers used data set to study the mutual fund performance of a country or some countries (Ferreira et al., Citation2013; Gallagher et al., Citation2017; Mateus et al., Citation2019; Zhou et al., Citation2019b). On the other hand, some researchers studied the factors affecting fund performance (Marshall & Tang, Citation2011; Shi, Citation2017; Kenchington et al., Citation2019). Besides, some researchers used data envelopment analysis (DEA) to evaluate fund performance (Tsolas & Charles, Citation2015; Galagedera et al., Citation2018; Galagedera, Citation2019). Moreover, some researchers investigated new trends in the literature on factor models and mutual fund performance (Mateus et al., Citation2019). Despite the large number of publications related to fund performance, little is known about the overall structure of its knowledge landscape and future trends. Therefore, it is necessary to conduct bibliometric analysis in the fund performance research area. There are many kinds of software for bibliometric analysis, such as SciMat (Cobo, Citation2012), VOSviewer and CiteSpace (Chen, Citation2006). Each tool has its own unique advantages. CiteSpace can perform citation burst and timezone analysis, which makes it more consistent with the research in this article. Therefore, this article mainly uses the tool CiteSpace. In order to better understand the theme change of fund performance research, this article also uses the tool SciMat for auxiliary analysis.
CiteSpace is a citation analysis software which can be used to display scientific measurement and data visualization (Chen, Citation2006). For the general researchers, it can visually capture hot topics, important scholars, and research institutions in related research fields. It also shows the sudden increase of new research topics in a specific time span. CiteSpace has been used in many areas, it has been widely used to study the hot-spots and frontiers of agricultural science and technology innovation (Chen et al., Citation2016), show the knowledge mapping of hospitality research (Li et al., Citation2017), present a systematic review of remote laboratory work in science education (Tho et al., Citation2017), analyze the knowledge domain and emerging trends in Organic Photovoltaic Technology (Xiao et al., Citation2017), show the knowledge mapping of social commerce research (Cui et al., Citation2018), scientifically measure the literature on climate change and tourism (Fang et al., Citation2018), present a visual analysis of research on information security risk (Li & Li, Citation2018), display the research progress on ecological models in the field of water eutrophication (Hu et al., Citation2019), make a quantitative analysis of the relevant literature of Green Building and Technological and Economic Development of Economy (Shi & Liu, Citation2019; Yu et al., Citation2019), explore the development trend and frontier of stormwater management (Wu et al., Citation2019), run visualization analysis of the development trajectory of knowledge sharing in virtual communities (Zhang, Citation2019). It has also been used to analyze the literature in the field of ecological research: To show the research progress of the ecological model of water eutrophication(Hu et al., Citation2019), to summarize the research on ecosystem health (Yang et al., Citation2019); and in the field of Medicine: To explore the emerging trends of regenerative medicine (Chen et al., Citation2012), conduct quantitative analysis on the literature of acupuncture for low back pain in recent 20 years (Liang et al., Citation2017), explore the knowledge domain and trends in Alzheimer’s disease, grey models, and support vector machines (Liu et al., Citation2019; Zhou et al., Citation2019a; Yu et al., Citation2020). Although CiteSpace is very popular, it is rarely used to analyze the knowledge domain of fund performance research. Therefore, this paper uses CiteSpace to do bibliometric analysis in the fund performance research area.
In order to provide a systematic and objective overview of fund performance research, this paper uses CiteSpace software to measure and analyze 979 papers on fund performance research from WoS during 1966 and 2019 (July), so as to achieve the following goals: (1) to show the development of relevant literature in the fund performance research area; (2) to understand the collaborative relationship between countries, institutions, and authors in the fund performance research field; (3) to realize the citation status of papers, authors, and journals; (4) to explore the knowledge structure and emerging trends in the research fields. The research of this paper complements the lack of previous researches in the overall knowledge structure, which can make scholars in this field more clearly understand the knowledge landscape and development trends of this topic, and gives them inspirations for innovative research in this field.
The rest of this paper is organized as follows. Section 2 describes the analysis tools and basic data. Section 3 is the introduction of current status such as the publication and citation of papers. Then the analyses of collaborative networks such as countries, institutions, and authors, scientific research networks such as papers, authors, and journals, and the detection of emerging trends are provided in Sections 4, 5, and 6, respectively. The last part is to summarize the main research results of this paper and put forward the shortcomings of this article and the future improvement direction
2. Analysis tools and basic data
Bibliometric analysis is the quantitative analysis of the bibliographic features of a body of literature, this paper will use the papers related to fund performance research as a data source and CiteSpace as the analysis tool, which is CiteSpace II, version 5.3.R4, to carry on the bibliometric analysis to the fund performance research area, and obtain the research situation, research focus and research direction in this field.
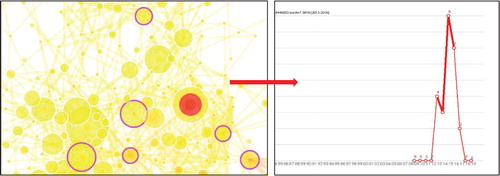
CiteSpace can display the structure, laws, and distribution of scientific knowledge through visual means, showing the trends of a discipline or knowledge domain in a certain period, forming the evolution of several research frontier areas. It mainly analyses the relationship between nodes and keyword clustering. Nodes and links build CiteSpace visualization graphs. The analysis of nodes can be divided into four types, the first type is collaboration analysis which is essential to understand academic exchanges and knowledge dissemination, the types of nodes include author, institution, and country; the second type is co-occurrence analysis, the types of nodes include term, keyword, and category, through keyword co-occurrence analysis, it can effectively track hot topics that change with time and get emerging trends in a research field; the third type is co-citation analysis which refers to the frequency that earlier two items literature are cited together by the later literature, the types of nodes include cited reference, cited author, and cited journal; moreover, the last type includes three nodes: Article, grant, and claim. On the one hand, the size of nodes in the network reflects the amount of publication, frequency, or the number of references. On the other hand, the color of a link represents the year of the first relationship established between two nodes. And the darker the color of a link, the longer the first relationship between two nodes is established (Chen, Citation2006). depicts the mentioned node types and the link colors. Moreover, node with purple outer rings has betweenness centrality (BC) greater than 0.1, which means that the node is of great importance (Chen, Citation2006). Betweenness centrality is an indicator to measure the importance of nodes in the network. CiteSpace uses this indicator to find and measure the importance of document and uses purple circle to mark such documents (or authors, journals, institutions, etc.) (Freeman, Citation1978). The following will be indicated by its abbreviation BC. Furthermore, nodes with red rings indicate that the reference rate has or is still rapidly increasing (Chen, Citation2006). As shown in , the graph on the left shows purple and red rings, and the graph on the right shows a red ring representing a sudden increase in citations. These theories will be applied to the later analysis.
Figure 1. Citation tree rings.
(Note: Citation tree rings represent the citation history of an article. The color of a citation ring denotes the time of corresponding citations. The thickness of a ring is proportional to the number of citations in a given time slice. The small number next to the center of a node is the citations throughout the entire time interval.)
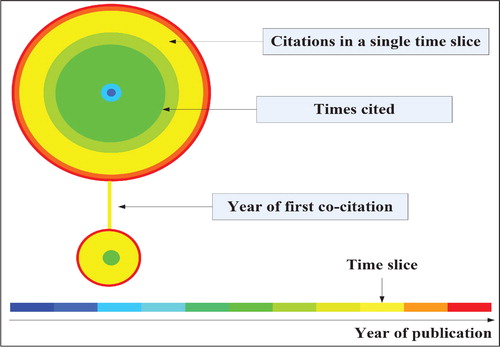
Figure 2. Betweenness centrality and burst detection.
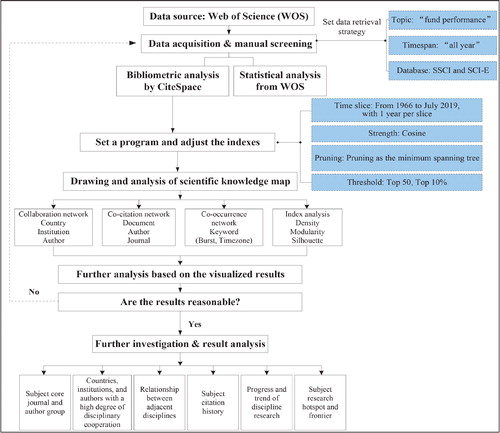
shows the data acquisition and analysis process of this paper. This paper selects Web of Science (WoS) as the bibliographic database, which includes the Science Citation Index Expanded (SCI-EXPANDED) and the Social Sciences Citation Index (SSCI) (Van Leeuwen, Citation2006). It should be noted that we actually do not focus on the specific types of documents when searching for the literature related to fund performance research due to the reason that we want to see the proportions of different types of documents published in this research area. The detailed analysis of the document type will be presented in Section 3. Because we choose WoS as the database, we do not need to transform it when we use CiteSpace for analysis, and it is a reputable and comprehensive database. Then we set a data retrieval strategy:
Figure 3. Data collection and analysis process.
Topic=“fund performance”;
Timespan=“all year”;
Databases=“Science Citation Index Expanded (SCI-E) & Social Sciences Citation Index (SSCI)”;
Lemmatization=“on”.
A total of 1160 papers related to fund performance were published from 1966 to July 2019. It should be underlined that search parameters may not select all the related publications as limited keywords might lead to duplicated and uncorrelated ones. In order to eliminate “noise” in the database, the data-set was reduced to 979 records limited to articles and reviews after manually filtering out some record types (e.g. editorial material, proceedings papers), duplicate and unrelated records. After that, the 979 papers are considered as the data source of bibliometric analysis in this paper.
This paper first obtains some basic information about these articles from WoS to get the current status of fund performance research, then uses CiteSpace to do quantitative analysis of these articles, and make further analysis based on the visualized results, to obtain the knowledge structure and emerging trends of fund performance research. shows the analysis process in more detail.
3. Current status of fund performance research
Through retrieving from Web of Science (WoS), some basic information about the related literature in the field of fund performance research can be obtained. It includes the statistical analysis of the amount of publications and citations, as well as the document types of the relevant literature in the fund performance research area. Besides, this section lists and analyses the top 10 subject categories, journals, countries/regions, and institutions with the most literature on fund performance research.
The number of publications and citations of the literature on fund performance research during 1966–1994 is particularly small and dispersive, their line is almost horizontal. Therefore, they were omitted when drawing, and the publication and citation of fund performance research only contains data from 1994 to July 2019. The progression of papers published and cited related to fund performance during the period 1994–2019 (July) is shown in . According to the retrieved literature set, it can be found that the first publication about fund performance was published in 1966 (Sharpe, Citation1966). During the past decades, the publication numbers on fund performance research from 2 in 1966 to 85 in 2018. In addition, a clear upward trend over time can be observed, indicating the increased role of scientific research in fund performance.
Figure 4. The number of publications and citations on fund performance research (1994–2019).
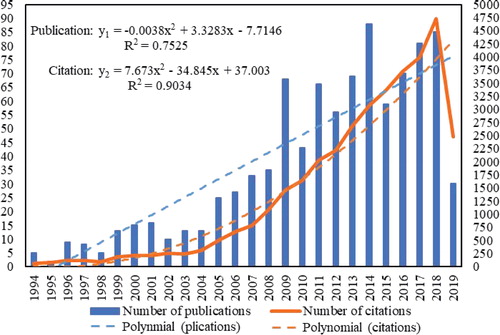
presents the number of publications and citations each year, and their relationship to the year of publication which are represented by two polynomial regression equations. The regression equations are: y1 = −0.0038 × 2 + 3.3283x − 7.7146 and y2 = 7.673 × 2 − 34.845x + 37.003, where x represents the number of years, y1 represents the publication number and y2 represents the number of citations. This fully explains that research on fund performance research is becoming increasingly concerned. Also, there is a clear upward trend in the number of citations, which means that the research of fund performance is getting more and more attention.
Especially, after the 21st century, the number of publications and citations has increased rapidly. The numbers of publications and citations for each year are displayed in in detail.
There are many kinds of articles on fund performance research, a total of nine different document types constituted all the papers in the fund performance research area. counts 1016 papers, more than the data source of this paper which includes 979 papers. This is because sometimes, an article can be classified into two different document types simultaneously. The detailed document types are illustrated in .
Figure 5. Document types on fund performance research (1966–2019).
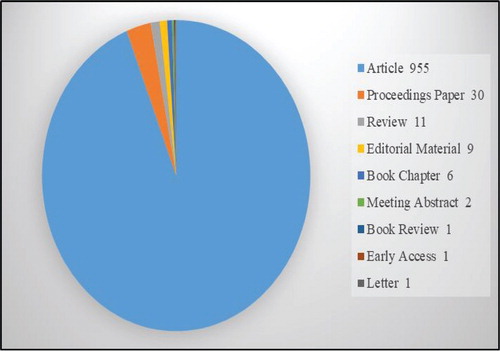
The top 10 subject categories are showed in , including “Business Finance” (689 publications; accounting for 70.38% of the total publications); “Economics” (518, 52.91%); “Business” (100, 10.22%); “Management” (89, 9.09%); “Operations Research Management Science” (60, 6.13%); “Social Sciences Mathematical Methods” (21, 2.15%); “Ethics” (19, 1.94%); “International Relations” (18, 1.84%); “Mathematics Interdisciplinary Applications” (18, 1.84%); “Urban Studies” (15, 1.53%).
Table 1. The top 10 subject categories on fund performance research.
We can see that the research topic fund performance can be related to many subjects, especially finance, economics, business, and management. It can be multidisciplinary due to the reason that there have been various scientific research outputs investigate fund performance from different perspectives.
There are hundreds of journals published the research results on fund performance, shows the 10 journals which published the highest number of articles on fund performance research (as of July 2019). As can be seen from , the top three journals are Journal of Finance (67 publications; accounting for 6.84% of the total publications); Journal of Banking Finance (64, 6.54%); and Journal of Financial Economics (60, 6.13%). Moreover, most journals are financial, and most of them are influential journals.
Table 2. The top 10 most productive journals on fund performance research.
In addition, by observing the h-index of each journal in , we can find that the journal with a high number of publications does not necessarily have a high h-index, such as Journal of Banking Finance (64, 21). Generally, the h-index is applied to show the performance of the journal or a single researcher (Bornmann & Daniel, Citation2005). Therefore, Comparative h-index of leading fund performance journals, we can find that contribute the most to fund performance is still Journal of Finance (43), followed by Journal of Financial Economics (32), Journal of Financial Economics (30), Journal of Financial and Quantitative Analysis (22), Journal of Banking Finance (21), Financial Analysts Journal (13), Journal of Empirical Finance (9), Journal of Portfolio Management (9), International Review of Financial Analysis (6), Management Science (6). The top 10 most productive journals on fund performance research are displayed in in detail.
The research on fund performance achieved different degrees of concern from different countries/regions. shows the top 10 most productive countries/regions in the fund performance research area. As shown in , the USA published the most publications in this area, followed by England, Australia, China, Spain, Canada, Germany, Taiwan, France, and the Netherlands. Among the ten countries/regions, China was the only one from developing countries. Details are shown in .
Table 3. The top 10 most productive countries/regions on fund performance research.
Obviously, the USA is the most active country in the research field of fund performance. It should be noted that the fund performance here is mainly about mutual funds. As introduced by Baumol et al. (Citation1990), mutual funds originated in the UK and were introduced to the United States in the 1920s. Because mutual fund industry plays a significant role in the USA’s financial market, its growth started in this country with the trend spreading around the world in recent years (Khorana et al., Citation2005). According to Ferreira et al. (Citation2013), the USA, the UK and Germany have the largest funds, which also generally accord with the result given in . With the development of mutual fund industry, fund performance has been broadly investigated. Besides considering several country characteristics, many significant articles analyze fund performance on the aspects of social responsibility or ethical issues (Bauer et al., Citation2005; Barnett & Salomon, Citation2006; Renneboog et al., Citation2008; Lee et al., Citation2010), approaches to evaluate and optimize fund management (Basso & Funari, Citation2001; Oh et al., Citation2005; Joro & Na, Citation2006) and hedge funds (Fung & Hsieh, Citation2000; Aragon, Citation2007; Avramov et al., Citation2011; Giroud & Mueller, Citation2011). In recent decades, some interesting investigations related to fund performance have been carried out taking the above countries/regions as the research contexts such as socially responsible and green funds in Europe (Leite & Cortez, Citation2015; Silva & Cortez, Citation2016; Ibikunle & Steffen, Citation2017) and US equity mutual funds (Galagedera et al., Citation2018). It should be noted that China is also active in this research area, the issues such as political participation (Feng et al., Citation2015) and sustainability information disclosure (Zhou et al., Citation2018) are taken into considerations.
shows that the National Bureau of Economic Research from the USA contributed the most publications in the fund performance research area (31 publications). Occupying the second position is New York University from the USA with 24 publications and they are followed by the University of Chicago (USA), City University London (England), Harvard University (USA), University of Pennsylvania (USA), the University of Texas at Austin (USA), Duke University (USA), Monash University (Australia), Universitat Jaume I (Spain). Among the above 10 mentioned institutions, seven were from American, while England, Australia, and Spain each have one. Though China, Canada, Germany, France, and the Netherlands were the productive countries, which can be drawn from , there are no research productive institutions from the above countries in the top 10 most productive institutions.
Table 4. The top 10 most productive institutions on fund performance research.
We select the top 10 most productive authors (from different fund performance journals) to analyze the author’s h-index (). As can be seen from , the highest h-index of Titman, S. is 9. In other words, in all Titman’s publications, there were 9 publications were cited more than 9 times. This is followed by Grinblatt, M. (7) and Wermers, R. (7).
Table 5. The top 10 most productive authors on fund performance research.
Simultaneously, we also found an interesting phenomenon. The author with a higher number of publications does not necessarily have a large H-index, such as Gallagher, D.R. Although he participated in 15 articles related to fund performance, his h-index was only 6. Therefore, when assessing the contribution of an author to a certain field, one cannot simply compare the number of publications, but also analyze the author’s h-index.
4. The collaboration network of fund performance research
This section analyses the cooperation among countries, institutions, and authors on fund performance research, which can help us understand the academic exchanges among countries in this field, and also show the extent and importance of fund performance research in various countries. Besides, through collaborative network analysis, a dynamic structure can be proposed for contributing research communities, which can provide useful guidance for new researchers and those seeking multiple cooperation and reviewers in the multidisciplinary research area. What’s more, it also can show the more influential countries, institutions, and authors, which can be compared with the previous table.
4.1. Country collaboration network
The network of collaborating countries consisted of 24 nodes and 46 links from 1966 to 2019 (July) and is shown in . Each node represents a country, and the size of the node reflects the amount of text sent by the country.
Figure 6. A visualization of the country collaboration network on fund performance research.
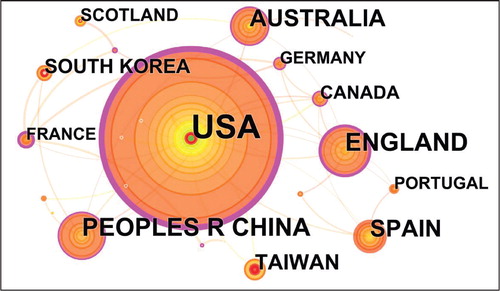
In terms of the line’s lightness of color, we can know that research and cooperation in these countries have started in recent years, the detailed collaboration years can be seen from . Besides, the thinness of ties between countries meant that the level of cooperation was low, which shows that the research on fund performance is not very mature among countries.
Table 6. The top 10 countries/regions based on frequency in collaboration network.
The 10 countries/regions with the highest contribution in the collaboration network are shown in . The USA is the largest contributor which makes the greatest contribution of the collaboration network, including 169 papers, followed by England (46), China (43), Australia (37), Spain (36), Taiwan (23), South Korea (19), Canada (15), Scotland (13), France (12). One prominent node is China, which is the only one from developing countries. Observing and , it can be found that the countries/regions in the two tables are similar and the countries/regions with more published articles have more articles to participate in collaboration, such as Australia (Publication number: 77, Frequency: 37), England (Publication number:109, Frequency: 46) and USA (Publication number:484, Frequency:169). In general, the number of outputs is associated with the number of research institutions, availability of research funding. Therefore, most of the countries/regions in the table are those with more developed economies. Moreover, these countries/regions play a crucial role in establishing links with other countries/regions according to their high BC, including the USA (0.64), France (0.35), England (0.26), Canada (0.16), Australia (0.17), China (0.11), they are all highlighted in purple circles.
4.2. Institution collaboration network
From 1966 to 2019 (July), the institution collaboration network consisted of 51 nodes and 26 collaborative links, as shown in . Each node represents an institution, and the size of the node reflects the amount of text sent by the institution. The maturity of the research community is relatively low, mainly in the relatively loose structure and fewer close relationships. It shows that there is less cooperation among different institutions in the fund performance research area. In addition, in terms of the line’s lightness of color and some nodes without any links around, we can know that research and cooperation in these institutions have only started in recent years.
Figure 7. A visualization of the institution collaboration network on fund performance research.
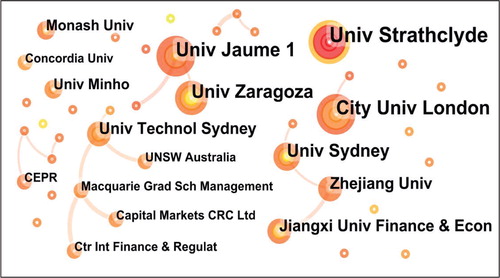
lists the top 10 institutions that account for the bulk of collaboration network. University of Strathclyde ranks first with 9 publications. It can be seen that Australia is the biggest contributor to fund performance research in institutions collaboration network, with 3 institutions (The University of Sydney, University of Technology Sydney, Monash University, ranking 5, 6, and 9, respectively). England, Spain, and China each have two, one was from Portugal. As can be seen from and , although the US’s institutions have the largest number of publications on fund performance research, there is rarely institutional collaboration with other institutions. Looking at and , it is found that there are no related institutions from China in , and there are two related institutions from China in . This illustrates that although there are not many articles about Chinese institutions in the field of fund performance, Chinese institutions are willing to actively cooperate with other institutions when writing-related articles.
Table 7. The top 10 institutions based on frequency in collaboration network.
4.3. Author collaboration network
Author collaboration network can check the intensity of collaboration and the degree of intimacy between different authors. As shown in , the author collaboration network consisted of 32 authors and 23 collaboration links. Each node represents an author, and the size of the node reflects the author’s number of posts. The loose structure and the line’s lightness of color in the figure shows that the author’s connection is not very close, and their partnership has only been established in recent years.
Figure 8. A visualization of the author collaboration network on fund performance research.
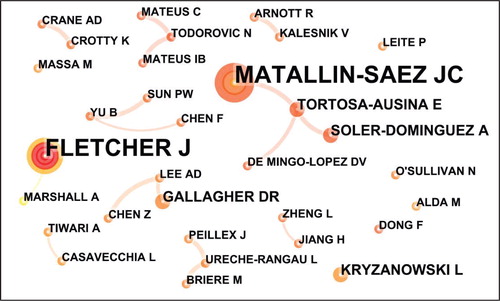
lists the top 10 authors based on frequency, Matallin-Saez came first with a frequency of 8, and the collaboration first emerged in 2015, followed by Fletcher with the same frequency while the collaboration first appeared in 2008. The collaboration frequency of other authors is less than 3, and the first collaboration appears later. It shows that scholars engaged in the fund performance research are scattered and their academic contacts are weak.
Table 8. The top 10 authors based on frequency on fund performance research.
5. The co-citation network of fund performance research
Co-citation network analysis, including document co-citation network, author co-citation network, and journal co-citation network. It can obtain the most frequently cited papers, authors, and journals in the fund performance research area. The purpose of this part is to explore the underlying clusters with high article co-citation capabilities, as well as the most cited works, authors, and journals to find the most influential points in the knowledge structure according to the co-citation received, and to obtain the frontier hotspot in the field of fund performance research.
5.1. Document co-citation network
Through the analysis of citation frequency of the papers by other literature simultaneously, document co-citation analysis can determine the key papers or core papers that have had a great influence on the relevant research areas (Synnestvedt, Citation2005). The key papers and main research fields in the fund performance research domain can be found by using the document co-citation analysis method. shows the document co-citation network which consisted of 384 references cited and 1087 co-citation links between 1966 and 2019 (July). The size of the node represents the number of citations of the literature.
Figure 9. A visualization of the document co-citation network on fund performance research.
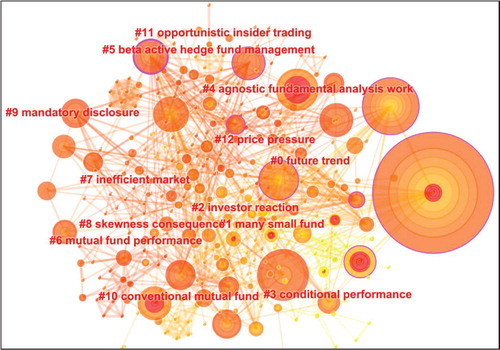
In this section, the LLR (log-likelihood ratio) method was used to label the cutlers. LLR is an algorithm that calculates and determines the type of each label, it uses professional words to represent the core concept of each cluster (Chen, Citation2016). Cluster is one of the three visualization methods of CiteSpace, and it is the default choice. It focuses on reflecting the structural characteristics of clusters, highlighting key nodes and important connections. Clusters are characterized by the most frequently used title words in member articles. Clustering can more accurately analyze the research direction and hot classification in the field. The indicators to measure the clustering effect include modularity and silhouette: the larger the modularity of a network, the better the network will be clustered. The silhouette mainly measures the homogeneity within a cluster after clustering. The mean silhouette width shows an assessment of clustering validity and might be utilized to select appropriate cluster numbers (Rousseeuw, Citation1987). Higher silhouette values reflect the corresponding clusters are more homogeneous. Normally, if the value is bigger than 0.5, it indicates that the result is reasonable, and the values that are above 0.7 suggest more reliable results. From CiteSpace, it can be known that the modularity Q (0.7186) is relatively high, which means that the network is reasonably divided into loosely coupled clusters (Chen, Citation2016). And the mean silhouette score of 0.4168 suggests that the homogeneity of these clusters on average is a little low (Chen, Citation2016).
The whole network was divided into 13 clusters, as summarized in . The clusters are numbered in the descending order of the cluster size, the cluster #0 is apparently smaller than #1, but had a larger cluster size. Size indicates the number of references that a cluster contains. Such as the largest cluster (#0) has 39 member references, followed by cluster (#1) has 33 members references.
Table 9. Summary of the 13 clusters on fund performance research.
The silhouette column presents a cluster’s homogeneity. Therefore, higher silhouette values represent that the members in the corresponding clusters are more consistent. According to the investigations given by Yu and Xu (Citation2017) and Fang (Citation2018), if a cluster’s size is small, a high homogeneity does not mean much. For instance, #12 has 7 members and a silhouette value of 0.939, it is possible that these 7 articles are the citation references of the same underlying author. That is to say, the citing behavior or preferences of a single paper could be reflected by #12. Therefore, it tends to be less representative. The other clusters have a reliable quality. The last column in is the average year of publication of a cluster, which indicates that whether it is formed by generally recent papers or old papers. This is a simple and useful indicator. Cluster #4, cluster #6, and cluster #7 were newly formed clusters, which mean that “Agnostic fundamental analysis work”, “Mutual fund performance”, and “Inefficient market” are the hot issues recently in the fund performance research area.
lists the top 10 most cited papers with co-citation frequency, there are four and two papers are from cluster #2, #1, separately, while cluster #3, #4, #6, #8 each have one. As pointed out by Chen et al. (Citation2012), the most cited articles can be considered as landmarks because of their ground-breaking contributions. There are six of the listed papers come from #2 and #1, suggesting these papers have made significant contributions to fund performance research area in different time periods. Both the first two papers are in #1 with more citation counts, the corresponding emerging research trend is “many small fund”. Therefore, these two papers significantly impact further investigations especially in the year of 2007. As for the four papers of #2, although the citation counts they obtained are less than which of the first two papers, they are still influential in this field. “investor reaction” is the emerging trend in the mean year of 2009, there are different significant research outputs released to discuss investor reactions from different perspectives.
Table 10. The top 10 most cited papers with co-citation frequency on fund performance research.
In order to provide a more complete view of the field of fund performance, this paper also provides a brief analysis of highly cited articles in the field. In fact, highly cited articles can help researchers who want to start working in a discipline, for example, let them know the most important topics and the authors who lead them (Martínez, Citation2014). According to and , two highly cited articles were published in the Review of Financial Studies in 2009, and two others were published in the Journal of Financial Economics in 2011. Among them, the article “How active is your fund manager? A new measure that predicts performance” written by Cremers and Petajisto was the most cited with 309. The citations of other articles are 301, 260, and 230, respectively. and present specific information on four highly cited literature in the area of fund performance.
Table 11. Highly cited publications on fund performance.
Table 12. The specific analysis of highly cited papers.
5.2. Author co-citation network
The results of this section present the authors who are often cited. The author co-citation network which contributes to the literature of fund performance consisted of 244 authors and 1254 co-citation links and is shown in . The size of the node represents the times of author co-citation. The compact structure shows that the network has a large number of participants as well as a wide of co-citation.
Figure 10. A visualization of the author co-citation network on fund performance research.
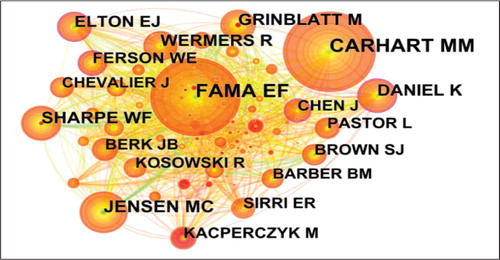
lists the top 10 most cited authors with co-citation frequency, their co-citation frequency all greater than 89. The top-cited author is Garhart with 290 citation frequency, and Daniel is a key node in the network due to high BC (0.16). Comparing with the authors listed in , a totally different is observed between the top 10 most cited authors and the top 10 most productive authors. Jensen and Sharpe have been studying fund performance for a long time, they began to study fund performance in 1967 and 1966, respectively, and they have made a great contribution in this area. For example, Jensen proposed the alpha value of the fund (Jensen index) (Jensen, Citation1968); Sharpe came up with a risk adjustment return indicator (Sharpe index) (Sharpe, Citation1966). Fama is a highly cited author because his model is widely used to analyze fund performance, he came up with the Three-factor model and Efficiency Market Hypothesis (Fama, Citation1996; Fama, Citation1998). They have great influence in the fund performance research area, and their research outputs are still being used to study fund performance.
Table 13. The top 10 most cited authors with co-citation frequency on fund performance research.
5.3. Journal co-citation network
The journal co-citation network consisted of 173 journals and 771 co-citation links, as shown in . The compact structure shows that the network has a large number of participants and a wide range of common references.
Figure 11. A visualization of the journal co-citation network on fund performance research.
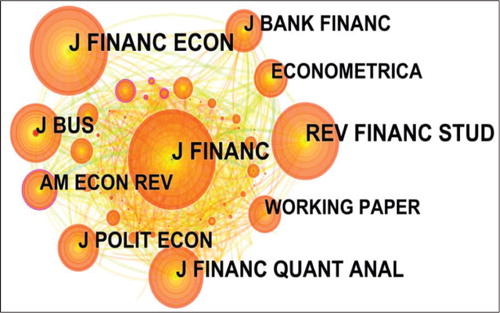
lists the top 9 most cited journals with co-citation frequency, their co-citation frequencies are all more than 182 (the co-citation frequency of Econometrica). The top-cited journal is Journal of Finance with 431 co-citations, the second and the third are Journal of Financial Economics with 378 co-citations and Review of Financial Studies with 333 co-citations. As observed, journals with greater influence have higher citation frequencies. American Economic Review plays a crucial role in establishing links with other journals according to high BC (0.15). Compared with and , the last five journals (Financial Analysts Journal, Journal of Empirical Finance, Journal of Portfolio Management, International Review of Financial Analysis, and Management Science) in are not listed in . Most of the journals in and have high impact factors, it can be known that productive journals do not necessarily have a higher impact and higher citation frequency, but journals with higher impact factors may be cited frequently.
Table 14. The top 9 most cited journals with co-citation frequency on fund performance research.
6. Emerging trends of fund performance research
To explore the emerging trends of fund performance research, including two parts: References and keywords analysis with citation bursts. In this part, the development trends of fund performance research are monitored, and the future research directions are prospected by keyword co-occurrence analysis.
6.1. References with citation bursts
Citation burst which refers to articles that have received sharp increases in citations is an indication of the most active area of research, and an article with citation burst means it has attracted particular attention from the academic circles in a certain period (Chen, Citation2006). Moreover, if a cluster contains a certain number of articles with strong citation bursts, then the cluster as a whole captures an active area of research or an emerging trend (Chen, Citation2006). displays the top 8 references with the strongest citation bursts. It should be noted that the meaning of the last column in is noted at the bottom of the table, which can show the period of the citation burst. It can be known that the citations of the references on fund performance research rise dramatically in recent years. In addition, there are 3 references in Cluster #1, 3 references in Cluster #2, and there are 2 references in Cluster #3. This shows that “many small fund” and “investor reaction” are the emerging trends in the fund performance research area. “Many small fund” and “investor action” are the cluster names of cluster 1 and cluster 2 respectively, which can be seen in . A cluster is composed of a group of literatures with common title words. The name of the cluster represents the research direction and research trends in a certain research field. Through , we can see the top 8 references with the strongest citation bursts on fund performance, most of which are also from cluster 1 and cluster 2. It can be seen that “many small fund” and “investor action” are the hot research directions and new research trends in the field of fund performance research. In the future, the research in this field will tend to these two themes. This conclusion is the same as in .
Table 15. The top 8 references with the strongest citation bursts on fund performance research.
6.2. Keyword analysis
Through the burst detection of keywords, the fast-growing topics in the fund performance research area can be found out. lists the top 5 keywords with the strongest citation bursts, it can be found that the research topics have changed over time. Different keywords with bursts reflect the development of funds at different periods. In the 1990s, the modern fund industry exploded, “Market” is a hot research topic in the fund performance research area. After the 21st century, the global fund has grown rapidly, more and more people are paying attention to fund income, fund performance, investor performance, and investment strategy choices of the fund. “Mutual fund performance”, “Return”, “Investment performance”, and “Selection” are the hot research topics. This reflects the importance of fund performance research.
Table 16. The top 5 keywords with the strongest bursts on fund performance research.
shows the most cited articles corresponding to high-frequency keywords, which expand the research on fund performance. There are not only common methods to study fund performance DEA but also the sustainability of fund performance, the relationship between asset allocation decision and performance, the relationship between acquirer performance and city and fund performance. From , we know that these keywords are hot topics in the field of fund performance research, and we list the corresponding articles for reference of scholars studying fund performance in the future.
Table 17. High cited articles corresponding to high frequency keywords.
In order to further explore the research direction, gives a time zone view of keywords, which lists the keywords in correspondence to the time of their citation bursts. gives a better visualization of hot research topics over time than . Each node represents a keyword, and the size of the node reflects the frequency of keywords. As can be seen from the figure, in the 20st century, there were fewer hot keywords related to fund performance, and the connection of keywords was relatively loose; after the 21st century, there were more and more hot keywords with close links in the fund performance area. Among them, the most frequent node is the keyword “mutual fund performance”, which shows that the research on fund performance has received more and more attention in recent years, and this topic is an important research object of modern financial theory. further lists the keywords with the highest number of occurrences each year, we can see that the keywords of the first three years are: “sentiment”, “liquidity risk”, and “institutional investor”, which show the recent research direction.
Figure 12. Timezone view of keywords on fund performance research.
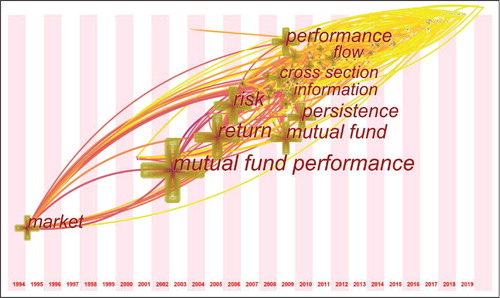
Table 18. The most frequently used keywords on fund performance research.
In addition, we use SciMat to provide an in-depth analysis of keywords, as shown in . It can help researchers better understand the evolution of topics in the field of fund performance and current research hotspots. In , the columns represent time periods, and the nodes represent clusters of topics within the time period. The size of the clusters corresponds to the selected measurement index. The solid lines between the two clusters represent common keywords, the dashed lines represent common secondary keywords, and the thickness of the lines represents the degree of relevance of clustering topic associations.
Figure 13. Fund performance theme evolution map.
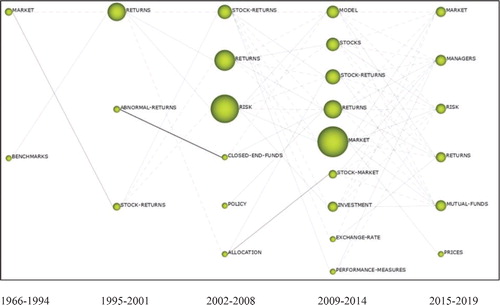
We divide 1966–2018 into five periods, which are 1966–1994, 1995–2001, 2002–2008, 2009–2014, and 2015–2019. According to , we can find that in the 28 years from 1966 to 1994, the largest cluster formed by the literature is the “MARKET”. In the second period, the largest cluster is “RETURNS”. Between 2002 and 2009, there were three larger clusters, namely “STOCK-RETURN”, “RETURN” and “RISK”. In the fourth stage, the “MARKET” has once again become a research hotspot in this field. In the last five years, more new clusters have emerged in this field, such as “MUTUAL-FUNDS” and “MANAGERS”. Comparing and , the prominent keywords in each period can basically match. Meanwhile, we find some very recent themes (for example managers, sentiment) that could not be identified with any thematic. They could be considered as the beginning of a new thematic area.
7. Conclusions
In this paper, based on the scientometric analysis and the WoS data, 979 relative papers have been derived and used to make a scientific review on the fund performance research. Some interesting findings have a as follows: (1) from 1966 to 2018, the publication and citation amounts of the literatures about the fund performance research have been increased significantly; (2) the fund performance research has become an interdisciplinary and internationalized issue; (3) USA is the most productive country because many prolific institutions such as the National Bureau of Economic Research, New York University, the University of Chicago and so on are from here; (4) The Journal of Finance published the most articles in this field; (5) “Small Fund” and “Investor Reaction” are the emerging trends, and “Mutual Fund Performance”, “Fund Return”, “Investment Performance”, and “Portfolio Selection” are the hot research topics in the fund performance research filed; and (6) the research on the fund performance has received more and more attention from researches and investors in recent years.
This study has provided an overview of the fund performance research, analyzed its future development trends, and provided its emerging trends and hot topics. In our opinion, the research results can help the scholars focused on the fund performance research to explore the critical research issues with fundamental significance, provide inspiration for proposing new research directions, and establish new perspectives. It is noted that there are also some limitations in this study. Firstly, the WoS data does not contain all the relative literature, so the data in this paper is not comprehensive. However, in our opinion, the WoS is a famous and accepted scientific database and includes the main finds and results in all the scientific fields. Therefore, the analysis and results in this paper are reliable. Moreover, there has been a lot of software that can be sued to do the bibliometric analysis. However, in this paper, we have only used the mainstream software, namely CiteSpace. Then, the derived conclusions are limited and more conclusions can be obtained by using other tools. Therefore, the further scientometric study based on the different tools will be our research directions in the future.
Disclosure statement
The author reports no conflicts of interest.
Additional information
Funding
References
- Agarwal, V., Mullally, K. A., Tang, Y. H., & Yang, B. H. (2015). Mandatory portfolio disclosure, stock liquidity, and mutual fund performance. The Journal of Finance, 70(6), 2733–2776. doi:10.1111/jofi.12245
- Angelidis, T., Giamouridis, D., & Tessaromatis, N. (2013). Revisiting mutual fund performance evaluation. Journal of Banking & Finance, 37(5), 1759–1776. doi:10.1016/j.jbankfin.2013.01.006
- Aragon, G. O. (2007). Share restrictions and asset pricing: Evidence from the hedge fund industry. Journal of Financial Economics, 83(1), 33–58. doi:10.1016/j.jfineco.2005.11.001
- Avramov, D., Kosowski, R., Naik, N. Y., & Teo, M. (2011). Hedge funds, managerial skill, and macroeconomic variables. Journal of Financial Economics, 99(3), 672–692. doi:10.1016/j.jfineco.2010.10.003
- Babalos, V., Doumpos, M., Philippas, N., & Zopounidis, C. (2015). Towards a holistic approach for mutual fund performance appraisal. Computational Economics, 46(1), 35–53. doi:10.1007/s10614-014-9450-y
- Banegas, A., Gillen, B., Timmermann, A., & Wermers, R. (2013). The cross section of conditional mutual fund performance in European stock markets. Journal of Financial Economics, 108(3), 699–726. doi:10.1016/j.jfineco.2013.01.008
- Barnett, M. L., & Salomon, R. M. (2006). Beyond dichotomy: The curvilinear relationship between social responsibility and financial performance. Strategic Management Journal, 27(11), 1101–1122. doi:10.1002/smj.557
- Basso, A., & Funari, S. (2001). A data envelopment analysis approach to measure the mutual fund performance. European Journal of Operational Research, 135(3), 477–492. doi:10.1016/S0377-2217(00)00311-8
- Bauer, R., Koedijk, K., & Otten, R. (2005). International evidence on ethical mutual fund performance and investment style. Journal of Banking & Finance, 29(7), 1751–1767. doi:10.1016/j.jbankfin.2004.06.035
- Baumol, W. J., Goldfeld, S. M., Gordon, L. A., & Koehn, M. F. (1990). History of the development of the mutual fund industry. In The economics of mutual fund markets: Competition versus regulation. Springer.
- Bhojraj, S., Jun Cho, Y., & Yehuda, N. (2012). Mutual fund family size and mutual fund performance: The role of regulatory changes. Journal of Accounting Research, 50(3), 647–684. doi:10.1111/j.1475-679X.2011.00436.x
- Blake, D., Caulfield, T., Ioannidis, C., & Tonks, I. (2017). New evidence on mutual fund performance: A comparison of alternative bootstrap methods. Journal of Financial and Quantitative Analysis, 52(3), 1279–1299. doi:10.1017/S0022109017000229
- Bornmann, L., & Daniel, H. D. (2005). Does the h-index for ranking of scientists really work?. Scientometrics, 65(3), 391–392. doi:10.1007/s11192-005-0281-4
- Brown, S. J., Sotes-Paladino, J., Wang, J. G., & Yao, Y. Q. (2017). Starting on the wrong foot: Seasonality in mutual fund performance. Journal of Banking & Finance, 82, 133–150. doi:10.1016/j.jbankfin.2017.05.013
- Busse, J. A., Tong, L., Tong, Q., & Zhang, Z. (2019). Trading regularity and fund performance. The Review of Financial Studies, 32(1), 374–422. doi:10.1093/rfs/hhy059
- Chen, C. M. (2006). CiteSpace II: Detecting and visualizing emerging trends and transient patterns in scientific literature. Journal of the American Society for Information Science and Technology, 57(3), 359–377.
- Chen, C. M. (2016). CiteSpace: A practical guide for mapping scientific literature. Nova Science Publishers.
- Chen, C. M., Hu, Z. G., Liu, S. B., & Tseng, H. (2012). Emerging trends in regenerative medicine: A scientometric analysis in CiteSpace. Expert Opinion on Biological Therapy, 12(5), 593–608. doi:10.1517/14712598.2012.674507
- Chen, Q. Q., Zhang, J. B., & Huo, Y. (2016). A study on research hot-spots and frontiers of agricultural science and technology innovation - visualization analysis based on the Citespace III. Agricultural Economics-Zemedelska Ekonomika, 62(9), 429–445.
- Ying, C., Xiaoqiang, Z., Chen, Y., & Shuang, S. (2018). Internal competition, active management strategy, and fund performance. Economic Computation and Economic Cybernetics Studies and Research, 52(1/2018), 143–161. doi:10.24818/18423264/52.1.18.09
- Chen, Y., Z. X. Q., Y. C. (2018). Internal competition, active management strategy, and fund performance. Economic Competition and Economic Cybernetics Studies and Research, 52(1), 143–161.
- Cobo, M. J., López-Herrera, A. G., Herrera-Viedma, E., & Herrera, F. (2012). SciMAT: A new science mapping analysis software tool. Journal of the American Society for Information Science and Technology, 63(8), 1609–1630. doi:10.1002/asi.22688
- Cui, Y., Mou, J., & Liu, Y. P. (2018). Knowledge mapping of social commerce research: A visual analysis using CiteSpace. Electronic Commerce Research, 18(4), 837–868. doi:10.1007/s10660-018-9288-9
- Del-Guercio, D., & Reuter, J. (2014). Mutual fund performance and the incentive to generate alpha. The Journal of Finance, 69(4), 1673–1704. doi:10.1111/jofi.12048
- Dumitrescu, A., & Gil-Bazo, J. (2018). Market frictions, investor sophistication, and persistence in mutual fund performance. Journal of Financial Markets, 40, 40–59. doi:10.1016/j.finmar.2018.01.001
- Duran-Santomil, P., Otero-Gonzalez, L., Correia-Domingues, R. H., & Carlos, J. (2019). Does sustainability score impact mutual fund performance? Sustainability, 11(10), 2972. doi:10.3390/su11102972
- Fama, E. F. (1996). Multifactor portfolio efficiency and multifactor asset pricing. The Journal of Financial and Quantitative Analysis, 31(4), 441–465. doi:10.2307/2331355
- Fama, E. F. (1998). Market efficiency, long-term returns, and behavioral finance. Journal of Financial Economics, 49(3), 283–306. doi:10.1016/S0304-405X(98)00026-9
- Fang, Y., Yin, J., & Wu, B. H. (2018). Climate change and tourism: A scientometric analysis using CiteSpace. Journal of Sustainable Tourism, 26(1), 108–126. doi:10.1080/09669582.2017.1329310
- Feng, X. N., Johansson, A. C., & Zhang, T. Y. (2015). Mixing business with politics: Political participation by entrepreneurs in china. Journal of Banking & Finance, 59, 220–235. doi:10.1016/j.jbankfin.2015.06.009
- Ferreira, M. A., Keswani, A., Miguel, A. F., & Ramos, S. B. (2013). The determinants of mutual fund performance: A cross-country study. Review of Finance, 17(2), 483–525. doi:10.1093/rof/rfs013
- Freeman, L. C. (1978). Centrality in social networks: Conceptual clarification. Social Networks, 1(3), 215–239.
- Fulkerson, J. A., & Riley, T. B. (2019). Portfolio concentration and mutual fund performance. Journal of Empirical Finance, 51, 1–16. doi:10.1016/j.jempfin.2019.01.006
- Fung, W., & Hsieh, D. A. (2000). Performance characteristics of hedge funds and commodity funds: Natural vs. spurious biases. The Journal of Financial and Quantitative Analysis, 35(3), 291–307. doi:10.2307/2676205
- Galagedera, D. U. A. (2019). Modelling social responsibility in mutual fund performance appraisal: A two-stage data envelopment analysis model with non-discretionary first stage output. European Journal of Operational Research, 273(1), 376–389. doi:10.1016/j.ejor.2018.08.011
- Galagedera, D. U. A., Roshdi, I., Fukuyama, H., & Zhu, J. (2018). A new network DEA model for mutual fund performance appraisal: An application to U.S. equity mutual funds. Omega, 77, 168–179. doi:10.1016/j.omega.2017.06.006
- Gallagher, D. R., Harman, G., Schmidt, C. H., & Warren, G. J. (2017). Global equity fund performance: An attribution approach. Financial Analysts Journal, 73(1), 56–71. doi:10.2469/faj.v73.n1.1
- Giroud, X., & Mueller, H. M. (2011). Corporate governance, product market competition, and equity prices. The Journal of Finance, 66(2), 563–600. doi:10.1111/j.1540-6261.2010.01642.x
- Graham, J. E., Lassala, C., & Ribeiro-Navarrete, B. (2019). A fuzzy-set analysis of conditions influencing mutual fund performance. International Review of Economics & Finance, 61, 324–336. doi:10.1016/j.iref.2018.01.017
- Hu, W., Li, C. H., Ye, C., Wang, J., Wei, W. W., & Deng, Y. (2019). Research progress on ecological models in the field of water eutrophication: CiteSpace analysis based on data from the ISI web of science database. Ecological Modelling, 410, 108779. No. doi:10.1016/j.ecolmodel.2019.108779
- Hunter, D., Kandel, E., Kandel, S., & Wermers, R. (2014). Mutual fund performance evaluation with active peer benchmarks. Journal of Financial Economics, 112(1), 1–29. doi:10.1016/j.jfineco.2013.12.006
- Ibikunle, G., & Steffen, T. (2017). European green mutual fund performance: A comparative analysis with their conventional and black peers. Journal of Business Ethics, 145(2), 337–355. doi:10.1007/s10551-015-2850-7
- Jensen, M. C. (1968). The performance of mutual funds in the period 1945-1964. The Journal of Finance, 23(2), 389–416. doi:10.1111/j.1540-6261.1968.tb00815.x
- Joro, T., & Na, P. (2006). Portfolio performance evaluation in a mean-variance-skewness framework. European Journal of Operational Research, 175(1), 446–461. doi:10.1016/j.ejor.2005.05.006
- Kenchington, D., Wan, C., & Yuksel, H. Z. (2019). Gross profitability and mutual fund performance. Journal of Banking & Finance, 104, 31–49. doi:10.1016/j.jbankfin.2019.05.001
- Khorana, A., Servaes, H., & Tufano, P. (2005). Explaining the size of the mutual fund industry around the world. Journal of Financial Economics, 78(1), 145–185. doi:10.1016/j.jfineco.2004.08.006
- Koch, A. (2017). Herd behavior and mutual fund performance. Management Science, 63(11), 3849–3873. doi:10.1287/mnsc.2016.2543
- Lee, D. D., Humphrey, J. E., Benson, K. L., & Ahn, J. Y. K. (2010). Socially responsible investment fund performance: The impact of screening intensity. Accounting & Finance, 50(2), 351–370. doi:10.1111/j.1467-629X.2009.00336.x
- Leite, P., & Armada, M. R. (2017). Bond fund performance during recessions and expansions: Empirical evidence from a small market. International Review of Finance, 17(1), 163–170. doi:10.1111/irfi.12098
- Leite, P., & Cortez, M. C. (2015). Performance of European socially responsible funds during market crises: Evidence from France. International Review of Financial Analysis, 40, 132–141. doi:10.1016/j.irfa.2015.05.012
- Li, H. T., Xu, Y. W., & Zhang, X. Y. (2016). Hedge fund performance evaluation under the stochastic discount factor framework. Journal of Financial and Quantitative Analysis, 51(1), 231–257.
- Li, X., & Li, H. (2018). A visual analysis of research on information security risk by using CiteSpace. IEEE Access., 6, 63243–63257. doi:10.1109/ACCESS.2018.2873696
- Li, X. J., Ma, E., & Qu, H. L. (2017). Knowledge mapping of hospitality research - A visual analysis using CiteSpace. International Journal of Hospitality Management, 60, 77–93. doi:10.1016/j.ijhm.2016.10.006
- Liang, Y. D., Li, Y., Zhao, J., Wang, X. Y., Zhu, H. Z., & Chen, X. H. (2017). Study of acupuncture for low back pain in recent 20 years: A bibliometric analysis via CiteSpace. Journal of Pain Research, Volume 10, 951–964. doi:10.2147/JPR.S132808
- Liu, S., Sun, Y. P., Gao, X. L., & Sui, Y. (2019). Knowledge domain and emerging trends in Alzheimer’s disease: A scientometric review based on CiteSpace analysis. Neural Regeneration Research, 14(9), 1643–1650. doi:10.4103/1673-5374.255995
- Livingston, M., & Zhou, L. (2015). Brokerage commissions and mutual fund performance. Journal of Financial Research, 38(3), 283–303. doi:10.1111/jfir.12060
- Marshall, A., & Tang, L. L. (2011). Assessing the impact of heteroskedasticity for evaluating hedge fund performance. International Review of Financial Analysis, 20(1), 12–19. doi:10.1016/j.irfa.2010.11.003
- Matallin-Saez, J. C., Soler-Dominguez, A., & Tortosa-Ausina, E. (2018). Active management and mutual fund performance. Revista de Economia Aplicada, 26(78), 43–79.
- Martínez, M. A., Herrera, M., López-Gijón, J., & Herrera-Viedma, E. (2014). H-Classics: characterizing the concept of citation classics through H-index. Scientometrics, 98(3), 1971–1983. doi:10.1007/s11192-013-1155-9
- Mateus, I. B., Mateus, C., & Todorovic, N. (2019). Review of new trends in the literature on factor models and mutual fund performance. International Review of Financial Analysis, 63, 344–354. doi:10.1016/j.irfa.2018.12.012
- Mateus, I. B., Mateus, C., & Todorovic, N. (2019). Use of active peer benchmarks in assessing UK mutual fund performance and performance persistence. The European Journal of Finance, 25(12), 1077–1098. doi:10.1080/1351847X.2019.1581639
- Oh, K. J., Kim, T. Y., & Min, S. (2005). Using genetic algorithm to support portfolio optimization for index fund management. Expert Systems with Applications, 28(2), 371–379. doi:10.1016/j.eswa.2004.10.014
- Qi, Y., & Sun, X. M. (2016). Funds’ performance evaluation based on the investment strategies. Management Review, 28(04), 156–166.
- Renneboog, L., Ter-Horst, J., & Zhang, C. D. (2008). Socially responsible investments: Institutional aspects, performance, and investor behaviour. Journal of Banking & Finance, 32(9), 1723–1742. doi:10.1016/j.jbankfin.2007.12.039
- Rousseeuw, P. J. (1987). Silhouettes: A graphical aid to the interpretation and validation of cluster analysis. Journal of Computational and Applied Mathematics, 20(1987), 53–65. doi:10.1016/0377-0427(87)90125-7
- Sharpe, W. F. (1966). Mutual fund performance. The Journal of Business, 39(S1), 119–138. doi:10.1086/294846
- Shi, Y. L., & Liu, X. P. (2019). Research on the literature of green building based on the Web of Science: A scientometric analysis in CiteSpace (2002–2018). Sustainability, 11(13), 3716. No. 3716. doi:10.3390/su11133716
- Shi, Z. (2017). The impact of portfolio disclosure on hedge fund performance. Journal of Financial Economics, 126(1), 36–53. doi:10.1016/j.jfineco.2017.06.001
- Silva, F., & Cortez, M. C. (2016). The performance of US and European green funds in different market conditions. Journal of Cleaner Production, 135, 558–566. doi:10.1016/j.jclepro.2016.06.112
- Synnestvedt, M. B., Chen, C. M., Holmes, J. H. (2005). CiteSpace II: Visualization and knowledge discovery in bibliographic databases. AMIA. Annual Symposium Proceedings, 2005, 724.
- Tho, S. W., Yeung, Y. Y., Wei, R., Chan, K. W., & So, W. W. (2017). A systematic review of remote laboratory work in science education with the support of visualizing its structure through the HistCite and CiteSpace software. International Journal of Science and Mathematics Education, 15(7), 1217–1236. doi:10.1007/s10763-016-9740-z
- Treynor, J. L. (1965). How to rate management of investment funds. Harvard Business Review, 43(1), 63–75.
- Tsolas, I. E., & Charles, V. (2015). Green exchange-traded fund performance appraisal using slacks-based DEA models. Operational Research, 15(1), 51–77.
- Van Eck, J. V., & Waltman, L. (2010). Software survey: VoSviewer, a computer program for bibliometric mapping. Scientometrics, 84(2), 523–538. doi:10.1007/s11192-009-0146-3
- Van Leeuwen, T. (2006). The application of bibliometric analyses in the evaluation of social science research. Who benefits from it, and why it is still feasible. Scientometrics, 66(1), 133–154. doi:10.1007/s11192-006-0010-7
- Verheyden, T., De Moor, L., & Vanpee, R. (2016). Mutual fund performance: A market efficiency perspective. Investment Analysts Journal, 45(1), 1–15. doi:10.1080/10293523.2015.1125058
- William, J. B., Stephen, M. G., Lilli, A. G., & Michael, F. K. (1990). History of the development of the mutual fund industry. Springer. doi:10.1007/978-94-009-2185-6_2
- Wu, J., Wu, X. Y., & Zhang, J. W. (2019). Development trend and frontier of stormwater management (1980–2019). A Bibliometric Overview Based on CiteSpace. Water, 11(9), 1908. No. doi:10.3390/w11091908
- Xiao, F. J., Li, C. Z., Sun, J. M., & Zhang, L. J. (2017). Knowledge domain and emerging trends in Organic Photovoltaic Technology: A scientometric review based on CiteSpace analysis. Frontiers in Chemistry, 5, 67. doi:10.3389/fchem.2017.00067
- Xu, W. (2019). The visualization and mining of knowledge map of health informatics based on. CiteSpace. Basic & Clinical Pharmacology & Toxicology, 124, 262–263.
- Yang, H., Shao, X. X., & Wu, M. (2019). A review on ecosystem health research: A visualization based on. Sustainability, 11(18), 4908. No. doi:10.3390/su11184908
- Yu, D. J., & Xu, C. (2017). Mapping research on carbon emissions trading: A co-citation analysis. Renewable and Sustainable Energy Reviews, 74, 1314–1322. doi:10.1016/j.rser.2016.11.144
- Yu, D. J., Xu, Z. S., & Šaparauskas, J. (2019). The evolution of Technological and Economic Development of Economy: A bibliometric analysis. Technological and Economic Development of Economy, 25(3), 369–385. doi:10.3846/tede.2019.10193
- Yu, D. J., Xu, Z. S., & Wang, X. Z. (2020). Bibliometric analysis of support vector machines research trend: a case study in China. International Journal of Machine Learning and Cybernetics, 11(3), 715–728. doi:10.1007/s13042-019-01028-y
- Zhang, K. Y., & Gencay, R. (2019). Mutual fund performance in developing and advanced world networks. The Singapore Economic Review, 64(02), 399–421. doi:10.1142/S0217590817500254
- Zhang, Z. (2019). Visualization analysis of the development trajectory of knowledge sharing in virtual communities based on CiteSpace. Multimedia Tools and Applications, 78(21), 29643–29657. doi:10.1007/s11042-018-6061-y
- Zhou, W., Kou, A. Q., Li, J. C., & Jiang, R. (2019). Network mapping of the grey model research: A visualized analysis using CiteSpace. The Journal of Grey System, 31(4), 122–142.
- Zhou, W., Lu, S., Chen, J., Chen, Q. J., & Meng, S. (2019). E2E double-process efficiency analysis from the perspectives of energy consumption and environmental treatment. Emerging Markets Finance and Trade. doi:10.1080/1540496X.2019.1697673
- Zhou, Z. B., Xiao, H. L., Jin, Q. Y., & Liu, W. B. (2018). DEA frontier improvement and portfolio rebalancing: An application of china mutual funds on considering sustainability information disclosure. European Journal of Operational Research, 269(1), 111–131. doi:10.1016/.ejor.2017.07.010