
 ?Mathematical formulae have been encoded as MathML and are displayed in this HTML version using MathJax in order to improve their display. Uncheck the box to turn MathJax off. This feature requires Javascript. Click on a formula to zoom.
Abstract
This article examines the convergence of the R&D expenditure in the EU28 for 2004–2015. We initially run a sigma convergence analysis and the results show convergence in the total expenditure, due to the behaviour of the business and higher education sectors, despite government sector divergence. However, noticeable differences between the EU15 and 13 EU countries are apparent. The business enterprise sector is the main driver of EU15 R&D convergence, whereas for the EU13 this role is played by the government expenditure. In addition, the economic crisis has impacted differently on both groups. The club convergence approach allows us to explore these insights through individualized analysis and clusterization. Results for the EU28 show two clubs for the total expenditure, but the analysis of its components reveals a larger grouping. Our results evidence the necessity of revising the EU R&D policies towards greater coordination and resources, and the implementation of new instruments, due to the impact of this expenditure on growth, development and integration.
Keywords:
1. Introduction
Research, development and innovation (R&D&I) has a significant role in economic growth. The endogenous growth models, proposed by authors such as Romer (Citation1986, Citation1990), Guellec and Ralle (Citation1991), Aghion and Howitt (Citation1992, Citation1997) and Grossman and Helpman (Citation1994), have contributed to highlight the task of R&D&I as a fundamental factor for medium- and long-term economic growth. However, R&D&I does not only stimulate total factor productivity and economic growth; it also helps to tackle some of the main social and environmental challenges. Beyond its growth link, R&D&I allows the production of more and new goods and services with lower consumption of non-renewable resources, reducing the negative externalities associated with production. Otherwise, as these models are based on positive externalities and incomplete appropriability of knowledge, they also contribute to legitimating public intervention as an appropriate instrument for accelerating economic development.Footnote1
These reasons seem to have been appreciated by EU institutions, which, since the Lisbon strategy, on several occasions have reaffirmed their commitment to R&D&I policies, which have been introduced as goal number 9 of the 2030 Agenda for Sustainable Development (United Nations).Footnote2 Consequently, the budgets of the research Framework Programmes (FPs) have grown exponentially, from the 3.3 billion euros of the first FP, launched in 1984, to the 80 billion euros of Horizon 2020. Furthermore, the Research, Innovation and Science Policy Experts (RISE) high-level group, created in 2014, has proposed to double this budget or, at least, the maintenance of this growth rate, which would lead to a 7-year budget of more than 120 billion euros in current prices for the next period.
However, Horizon 2020 is not an isolated scheme; there are other outstanding R&D&I-orientated programmes within the EU. The COSMEFootnote3 programme and the structural funds are designed to promote the R&D&I development of small and medium enterprises (SMEs) and European regions. In fact, R&D&I investment has become the favourite tool of the EU institutions to boost not only economic growth but also regional development and income convergence among the European regions. The cohesion policy has been greatly reoriented according to the ‘Smart Specialization Strategy’ to boost the regional R&D&I investments and to adapt them to the specific needs and potential of each territory as the best way to maximize their rates of return and economic development.Footnote4
This shift in the regional policy is coherent with the new economic theories, since convergence was the expected result of the neoclassical models of economic growth (through the equalization of the capital rates of return), but it is not the expected outcome of the endogenous growth models. Unlike neoclassical theory, endogenous models have often been used to explain the non-convergence of countries’ growth in the long term, ruling out automatic equilibria and opening the door to public intervention.Footnote5 That is why R&D&I public policies assume, and some authors have highlighted,Footnote6 that long-run income convergence demands the following:
The less competitive countries invest more in R&D&I than the competitive ones.
These investments in R&D&I lead to innovation and new technologies that enhance economic competitiveness.
Without own R&D&I, we would be able to observe a short-term catching-up process due to capital investments because of the higher rates of return on capital and/or the absorption of foreign technologies (frequently associated with foreign direct investment) but not as a result of productivity improvements related to R&D&I.Footnote7 On the other hand, to transform new technologies into innovation in the practice and economic growth, a country needs a combination of other factors, such as open and competitive product markets that allow the entry of new firms, effective intellectual property rights, access to researchers and skilled labour, and capital markets that give innovators access to funding, among others.
However, despite the importance of R&D&I investment for economic development and thus for the cohesion policy, few papers to date have addressed the convergence of R&D&I expenditure among European countries and regions, usually devoted to income or prices convergence. We review those papers in Section 2.
Motivated by the significant role of R&D&I in the economy and development and the scarce literature on the convergence in the EU -an especially interesting case of study by the integration process-, we carry out a convergence study of R&D expenditure in the EU with the following objectives: i) determine whether there has been a sigma convergence process; ii) establish groups or clubs of countries, through an endogenous identification process without pre-established criteria; iii) study whether the clubs present relative convergence (convergence in the expenditure growth rates) or absolute convergence (convergence in expenditure level); and iv) analyse whether the economic crisis has affected the (sigma) convergence process.
We contribute to the literature in several ways. We apply the club algorithm developed by Phillips and Sul (Citation2007) to cluster the EU Member States jointly with a previous and preliminary analysis of sigma convergence, noting that this is the first paper devoted to club convergence in R&D expenditure among European countries. In addition, we analyse the total expenditure on R&D over the GDP and its three components or sectors – government, business enterprise and higher education – for the EU28 in the period 2004–2015. Finally, we also perform the exercise for the EU15 and the rest of the Member States, denoted as the EU13, seeking different patterns across these two groups of countries. Our empirical exercise will offer new insights about the convergence of R&D expenditure in European countries under the assumption that the club convergence pattern prevails over the full convergence hypothesis.
The paper is organized as follows. We review the previous literature in Section 2. Section 3 describes the methodology, while Section 4 presents the data. Section 5 contains the main results. Finally, Section 6 concludes.
2. Literature review
The convergence of R&D&I expenditure or related indicators among European countries and regions has been studied in relatively few papers.Footnote8 Martín et al. (Citation2005) employed a beta and sigma convergence analysis to explore the dynamics of the spatial distribution of regional technology indicators in the EU in the period 1990–2000 and its impact on cohesion. They found that some technology indicators converged among regions during the 1990s (especially public R&D spending). Nevertheless, the total R&D expenditure diverged across regions over time, due to an asymmetric expansion of private R&D activities during the second half of the decade.
Mulas-Granados and Sanz (Citation2008) studied the relationship between convergence in technology and convergence in income across EU regions during the period 1990–2002. Using the R&D expenditure of all sectors as a percentage of the GDP as the technology input indicator, patents per million people as the output indicator, and regional income per capita, they carried out a convergence analysis, including sigma convergence. They found that the input and output technology indicators had converged among regions and that it had run parallel to real convergence in income per capita. Furthermore, they identified a strong relationship between the distribution of technology indicators and the distribution of regional income in Europe.
In addition, other studies have widened the scope of the analysis to consider other indicators of technological progress, not only R&D expenditure and its components. Hence, Archibugi and Filippetti (Citation2011) explored the convergence among European Members States in terms of innovation capabilities in the period 2004–2008. They carried out a beta convergence analysis of the Summary Innovation Index (SII) of the European Innovation Scoreboard and its seven sub-indexes. The results show the achievement of convergence in technological capabilities and innovation performance across European countries for this period, especially for some sub-indexes, such as ‘Finance and Support’ (which includes public R&D) and ‘Throughput’ (which includes the registration of patents, trademarks and designs). However, it should be noted that their analysis, with data extending to 2008, is not able to address the real impact of the economic crisis on R&D&I convergence.Footnote9 In fact, in the ‘European Innovation Scoreboard 2017’, we find contrary evidence to past reports in which less innovative countries improved their performance faster than more innovative countries. In that report, the authors concluded that there has been no convergence in innovation performance between Member States, due mainly to the dispersion of business R&D expenditure (BERD)Footnote10 among European countries.
These results were partially ratified by Veugelers (Citation2017), who used sigma convergence to measure the dispersion of scoring of European Member States on the Innovation Union Scoreboard composite indicator for the period 2008–2015 and some of its components. She showed that the heterogeneity among the EU countries holds across all the indicators of innovation but is especially intense for business R&D. Despite this heterogeneity, there has been some convergence in private-sector R&D in recent years due to a combination of top countries losing their lead and EU13 countries achieving a significant advance, while the so-called EU15–South group has lacked any catching-up trend. Regarding the public R&D expenditure as a percentage of the GDP, she found that it increased over time for the EU. However, this increase stopped in 2010. The EU innovation-leading countries (above the average of the innovation score) are spending the most on public R&D as a share of their GDP, and they have even increased this share over time. The innovation-lagging countries (below the average of the innovation score) show no catching up, with particularly the EU15–South continuing to lag.
More recently, Barrios et al. (Citation2019) studied the convergence of the innovation activity among the European regions in 2002–2012. They identified seven convergence clubs for the patents as a proxy for innovation activities.
3. Methodology
In this section, we present the methodology of Phillips and Sul (Citation2007) to test for club convergence. They considered panel data for a variable yit, i = 1, 2, …, N and t = 1, …, T, (where N and T represent the number of countries and the sample size, respectively), and the model:
(1)
(1)
where
is a common component and
is a time-varying idiosyncratic component that measures the individual economic distance between the common trend component and yit.
Phillips and Sul (Citation2009) modelled the time-varying behaviour of the transition coefficients in the semiparametric form:
(2)
(2)
where
is fixed,
is iid(0,1) across i but may be weakly dependent over t and α measures the speed of convergence. Under this specification,
converges to the constant
as
for α ≥ 0.
The hypothesis of interest is convergence among all countries or overall convergence (), against the alternative hypothesis of no convergence for a particular country or countries. The latter includes overall divergence (
) or the case in which sub-panels of countries converge to different steady states, or club convergence, with possibly diverging countries (
).
Since is a common factor in (1), it may be removed by scaling to give the relative transition coefficients:
(3)
(3)
is the ‘relative transition path’ in the sense that it traces an individual trajectory over time for country i relative to the panel average and can be considered to be economy i’s relative departure from µt, reflecting possible divergences from it.
From some statistical properties of and the cross-sectional variance of
(
under convergence, Phillips and Sul (Citation2007) proposed the ‘log t’ convergence test, which involves running the following OLS regression with a robust covariance matrix:
(4)
(4)
for t= [rT], [rT] + 1,…,T, with r > 0, normally in [0.2, 0.3],Footnote11 [rT] being the integer part of rT.
Under the null of convergence, coefficient b provides a scaled estimator of the speed of convergence parameter α, since b = 2α. Thus, convergence can be tested by a one-sided t test of α ≥ 0 (using the estimate and HAC standard errors), being rejected at the 5 per cent significance level if
Since α measures the speed of convergence of not only the sign but also its magnitude is of interest. Hence, the estimate
(
) implies absolute convergence, that is, convergence to a club-specific expenditure level over the period (i.e. convergence in level), while
(
) involves convergence in a relative sense, indicating that the differentials tend to decrease over time (i.e. convergence in growth rates).
When the null of convergence in the panel is rejected, Phillips and Sul (Citation2007) proposed the application of a four-step clustering algorithm to detect clubs that converge in the panel.
The main steps can be summarized as follows: 1) Sort the countries into descending order on the basis of the last observation. 2) Form a core club. 3) Sieve the data for new club members and run the log t test in order to check if a convergence club is obtained. 4) Run the log t test on the non-selected countries in step 3. If the t statistic is greater than -1.65, conclude that there are two convergence clubs. Otherwise, repeat step 1 to step 3 to detect sub-convergence clusters. If no other clubs are detected, conclude that the remaining countries display divergent behaviour.
Finally, the clustering procedure allows us to study evidence of convergence between neighbouring members of different clubs. The analysis is performed by running the log t test including a fraction of 50 per cent of the lowest members of the upper club together with a fraction of 50 per cent of the highest members of the lower club.
4. Data
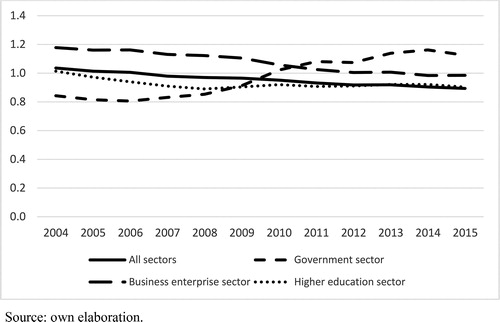
We use data for the EU28 from Eurostat, and the available period is 2004–2015.Footnote12 The data reflect the total expenditure on R&D over the GDPFootnote13 and three components as a function of the sectors (data by sector of performance, not by source of fundsFootnote14): government, business enterpriseFootnote15 and higher education. contains the descriptive statistics,Footnote16 and the evolution of the magnitudes is presented in . The increase in the (unweighted) average from 1.30 per cent in 2004 to 1.63 per cent in 2015,Footnote17 due especially to the rise in the business enterprise sector (from 0.79 to 0.97) and higher education (0.31 to 0.44), should be noted. However, the government sector presents a modest increase (only from 0.18 to 0.21). Note that the objective of the EU is to reach 3 per cent over the GDP of the (weighted) average in 2020, so a great effort is still necessary to achieve this target.
Figure 1. Evolution of the R&D expenditure in the EU28. Source: Eurostat and own elaboration
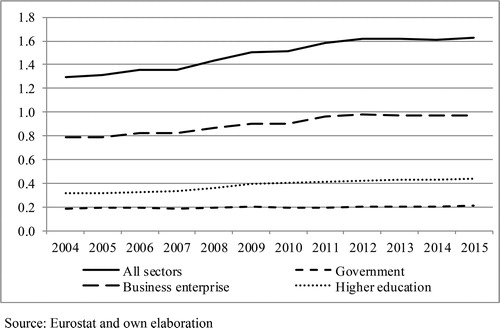
Table 1. Descriptive statistics.
The increase in the total expenditure in the first years of the crisis, 2008–2012, should be noted, but since then the expenditure has remained at the same level. Additionally, the heterogeneity between the EU15 and the EU13 is remarkable.
5. Results
5.1. Sigma convergence
As an exploratory analysis, it is interesting to study the time evolution of the dispersion through a sigma convergence analysis approached by the coefficient of variation over time (CVt). Hence, we compute the cross-section dispersion each year. Additionally, we compute the unconditional test of sigma convergence by regressing the dispersion measure against the time (t = 1, 2, …, T) and the annual rate of σ-convergence (γ):
(5)
(5)
(6)
(6)
The results of the sigma convergence for the EU28 are presented in , with σ-convergence for the total, business enterprise sectorFootnote18 and higher education sector, but σ-divergence for the government sector.
Figure 2. Sigma convergence. Source: Own elaboration.
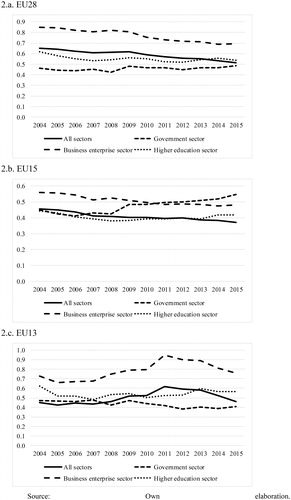
With the aim of obtaining more detailed results, we perform the unconditional test of sigma convergence for the EU28 as well as for the EU15 and the EU13, whose trends are presented in . The results are summarized in .
Table 2. Test of sigma convergence.
For the EU28, the test confirms the conclusions described above from the graphical analysis, with annual rates of sigma convergence of -2.05, −1.86 and -1.16 per cent for the total, business enterprise and higher education sectors, respectively. Additionally, the government sector presents an annual rate of sigma divergence of 0.49 per cent.
For the EU15, the results evidence σ-convergence in the total expenditure (with γ = −1.64) and the business enterprise sector (γ = −1.42) but strong σ-divergence in the government sector (γ = 2.01), whereas the results for the higher education sector are not significant.
Finally, when the EU13 is analysed, the σ-convergence is only present in the government sector (γ = −1.28), for which we conclude σ-divergence both for the EU28 and for the EU15. In the total and business enterprise sectors, the test points out σ-divergence (γ = 0.26 and 0.39, respectively), whereas the results for the higher education sector are not significant.
It should be noted that, in higher education, we observe a σ-convergence process in the EU28 but not in the EU15 nor EU13 separately. More specifically, the coefficient in the EU15 is negative but no significant. The σ-convergence is measured regarding the average of the group and hence different results can be achieved between the overall sample and subsamples, taking into account that the overall result is not the simple average of the subsamples.
The economic crisis and its different impacts on public deficits could be the reason behind public R&D expenditure divergence in the EU15 after 2008. Public deficits, on average, grew more in the EU15 countries than in the EU13, due to the shock suffered by countries such as Greece, Spain, Ireland, Portugal and the United Kingdom, which reached deficits above 10 per cent between 2009 and 2010.Footnote19 However, other EU15 countries, like Sweden, Finland, Luxembourg and Denmark, kept their deficit under control. This divergence of the public deficit trends among the EU15 countries after the economic crisis could be related to the R&D expenses’ divergence, first because the impact of the crisis on the public income, and thus on the government’s capability to finance R&D expenses, differed quite considerably among the EU15 countries, but also because the austerity policies undertaken to tackle the crisis were diverse.
On the other hand, the EU13 public expenditure on R&D converged during the period studied through a rate close to 0.2 per cent of the GDP. Some countries that were previously above this rate, such as Slovenia, Hungary and Croatia, reduced the share of their R&D expenses, while others that were earlier below that level, like Malta, Estonia, Latvia and Romania, increased their expenditure. Only the Czech Republic and Slovakia boosted their outlay well above the trend.
These results evidence different patterns among the European countries, so the club convergence analysis will yield interesting information about their clustering.
5.2. Club convergence
The results of the club convergence approach are reported in and . The average rates across clubs are presented in and the average relative transition curves for each club in .
Figure 3. Average across clubs. Source: own elaboration.
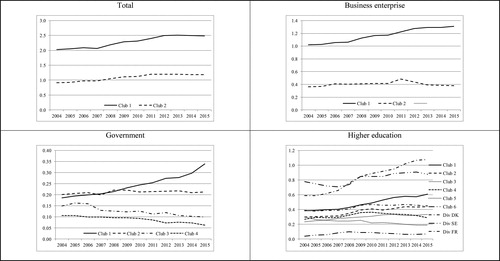
Figure 4. Average relative transition curve for each club. Source: own elaboration.
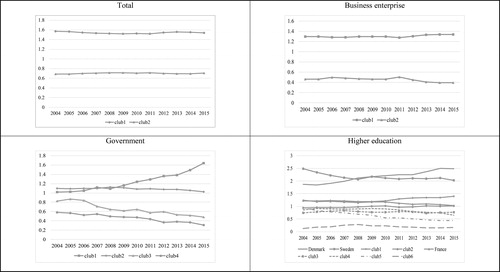
Table 3. Convergence club results: EU28.
Table 4. Summary of the results by country.
The null of full convergence, for the total expenditure as well as for the three sectors, is rejected at the 5 per cent significance level. Therefore, the club convergence algorithm is implemented to determine whether any subgroups of countries converge. The results indicate the presence of different numbers of clubs.
5.2.1. Total expenditure
We can distinguish only two large clubs, the first one formed by the high-innovation countries, comprising Austria, Sweden, Denmark, Finland, Germany, Belgium, Slovenia, the Netherlands, the Czech Republic and Slovakia. The five-year average (2011–2015, as the averages mentioned in the rest of the section) is 2.480, opposite to the 1.196 of club 2. In line with this result, the relative transition parameters in club 1 are above 1, while the values corresponding to club 2 remain below 1, showing some parallelism between the two paths and no trend towards convergence.
5.2.2. Government sector
Now the algorithm leads to four clubs: the first contains Germany, Luxembourg, the Czech Republic, Slovakia and Malta, countries with high government expenditure on R&D (the average is 0.289), except Malta, which is integrated into this club because of its high increase in the period, from 0.01 to 0.13; the third club is formed by Denmark, Sweden and the United Kingdom, where this expenditure is medium-low, with an average of 0.109; and the fourth club contains Portugal, Cyprus and Ireland, with the lowest expenditure in the EU (mean of 0.075). The second group absorbs the rest of the countries, with medium-high expenditure and an average of 0.214.
It is worth emphasizing that countries such as Sweden or Denmark, with high total expenditure, present low expenditure at the government level. For example, in Sweden, the total expenditure in 2015 accounts for 3.26 per cent of the GDP, the highest in the EU28, but the government expenditure is only 0.11 per cent, ranked in twenty-fourth position. The business enterprise sector represents 2.27 per cent, showing the commitment of firmsFootnote20 to the research and innovation process in those countries.
Club 1 shows a noticeable upward trend in its relative transition paths (mainly from 2007), while the opposite behaviour is found in clubs 3 and 4. Meanwhile, the mean of the countries that form club 2 tends to the mean of the EU28 states.
5.2.3. Business enterprise
In this sector, the methodology leads to two clubs, as for the total expenditure. It should be noted that this sector is the most relevant to the composition of the expenditure (0.97 out of 1.63 in 2015). The second club, with low expenditure, consists of Estonia, Luxembourg, Portugal, Croatia, Malta, Slovakia, Lithuania, Romania, Latvia and Cyprus, presenting a mean of 0.416, whereas the rest of the countries conform to the first group of high expenditure, which is composed mainly of EU15 countries and has an average of 1.278. The relative transition curves’ behaviour is similar to that corresponding to the total expenditure, showing a slight change from 2011 and no trend towards convergence.
5.2.4. Higher education
Here the heterogeneity captured by the algorithm is the greatest and hence the results show six clubs and three divergent countries: Denmark, Sweden and France. The first club – high expenditure, with a mean of 0.571 – includes Austria, Finland, Estonia, Lithuania, Slovakia and the Czech Republic. The second group comprises the Netherlands, Portugal, Germany, Belgium, Greece, Malta and Luxembourg; its average is 0.424. Then, the United Kingdom, Italy, Latvia, Poland and Cyprus belong to the third club – with a mean of 0.326 – and Spain, Ireland and Slovenia to the fourth one – with an average of 0.324. It should be noted that these two clubs present similar averages. Clubs 5 and 6 contain the countries with very low expenditure in the higher education sector: Croatia and Hungary, and Romania and Bulgaria, with averages of 0.204 and 0.071, respectively.
The divergent behaviour corresponding to Denmark and Sweden (mainly the former, whose transition parameters are gradually moving away from 1) is remarkable. Club 1 also shows an upward trend and transition parameters above 1, as evidence of the effort of these countries in higher education. Meanwhile, club 2 shows values around the mean, whereas the transition parameters in clubs 3–6 are below 1 and do not show a trend towards convergence to this value.
In most cases, the results evidence relative convergence or convergence in the growth rates, with modest speeds of club convergence. We observe just one case of absolute convergence (or convergence in level): club 5 in higher education, with a speed of 4.199. Note also that, in some cases, the point estimate in the log t test is negative, although the null of convergence is not rejected.
Finally, examines the evidence of transitioning between clubs to investigate whether part of a convergent club tends to approach another club or the possibility of sequential club convergence whereby part of one club moves towards another club. For that, the log t test is run for the 50 per cent of the lowest members in the upper club and the 50 per cent of the highest members in the lower club.
Table 5. Transitions between clubs.
The test strongly rejects transitioning for the total expenditure, but we find some evidence of transition in all the subgroups. In particular, the data support relative convergence in the government sector between the highest countries in club 2 and the lowest in club 1 and the same for clubs 3 and 4. Thus, these groups of countries may be understood to be in a state of transition. Transition is also found in the business enterprise sector and most of the higher education clubs.
We repeated the club convergence analysis considering the EU15 and EU13 countries. The results are reported in and .
Table 6. Convergence club results: EU15.
Table 7. Convergence club results: EU13.
5.2.5. EU15
Focusing on the total expenditure, we identify three clubs plus a divergent country, France. Club 2 comprises the United Kingdom, Ireland, Italy and Greece and Club 3 Luxembourg, Portugal and Spain. These two groups present similar averages, around 1.3 per cent. It is worth noting that Ireland, the United Kingdom and Luxembourg are aligned with the southern countries. The rest of the countries appear in club 1 of high expenditure. In the case of the government sector, the states are arranged into four clubs. Germany and Luxembourg form the high-expenditure club 1, while the United Kingdom, Sweden and Denmark on one hand and Portugal and Ireland on the other hand present low expenditure. The analysis of the business sector leads to three clubs, with club 1 formed by Sweden, Austria, Germany, Finland, Denmark, Belgium, France and the Netherlands with high expenditure; their average is 1.827 per cent. Finally, in the higher education sector, we again appreciate substantial heterogeneity, with four clubs and three divergent countries, Denmark, Sweden and France.
5.2.6. EU13
In the aggregate expenditure, the algorithm detects only two clubs: Slovenia, the Czech Republic and Slovakia, (precisely the countries grouped into club 1 in the EU28, with an average of 1.713), and the rest, for which the mean is 0.880. The case of Slovenia is particularly interesting: in 2015, the total expenditure reached 2.21 per cent of the GDP, the eighth in the EU28; the government expenditure is 0.30 – the fifth – and the business enterprise expenditure represents 1.69 per cent of the GDP, being the seventh in the European ranking. On the other side, the higher education sector accounts for only 0.23 per cent of the GDP in Slovenia, falling to the twenty-fourth position in the EU28. The government side reveals two clubs plus a divergent country, Cyprus. In the business sector, we again detect two clubs and four divergent countries (Slovenia –with expenditure clearly above the rest – and Romania, Latvia and Cyprus, below the two clubs). Finally, the higher education sector again shows the highest fragmentation, with three clubs, Romania and Bulgaria being the countries belonging to the low-expenditure club.
5.3. Discussion
Our results support the sigma convergence in the R&D expenditure in the EU28 as a whole, but differences arise when distinguishing the EU15 and EU13. The results also support our preliminary hypothesis about the prevalence of clubs of convergence over the full convergence, and reveal two groups in the total expenditure, being the heterogeneity larger in the disaggregated analysis of the expenditure by sector of performance. These achievements denote a clear (at least) dual pattern or centre-periphery in European R&D.Footnote21
In addition, and regarding the economic crisis, the sigma convergence results evidence an impact on government and higher education expenditures, with σ-convergence in the period 2004–2008, but σ-divergence onwards. And the separated analysis of EU15 and EU13Footnote22 also reveals a larger impact of the crisis on the convergence process of the second group, denoting its larger weakness in R&D facing recessions.
Taking into account that the EU pursues a smart, sustainable and inclusive growth, where knowledge and innovation should play a relevant role in the current and future economy,Footnote23 these results evidence the need of a bigger European budget for R&D&I, promoting the convergence among the countries, regions and cities as the best way to encourage the economic growth and reduce the disparities in income and productivity across territories. In this sense, the Smart Specialisation Strategies can be good instruments for those aims, although new tools must be developed to accomplish the digital transformation of the economy within the Fourth Industrial Revolution and the extension of artificial intelligence. The firm survival will depend on the innovation capacity and the R&D efforts and the EU needs to revise the strategies, resources and instruments.
Regarding previous studies, this work analyses the period 2004–2015 and it focuses on the R&D expenditure by European countries; hence the results are not directly comparable with other analyses as this is the first study devoted to the search for convergence clubs in this main measure of R&D in EU countries, and related empirical studies focused mainly in the 90 s (e.g. Martín et al., Citation2005; Mulas-Granados & Sanz, Citation2008). In any case, as stated above, our results partially coincide with Izsak and Radosevic (Citation2017), who analyse the EU28 and the period 2006–2013, as they concluded that the R&D&I policies have reinforced the divergence between the Northwest and the South. In addition, our results also support the conclusion by Veugelers (Citation2017), who analysing the Innovation Union Scoreboard composite indicator for 2008–2015, finds notable differences or divergences among the Innovation Leaders in the North and Innovation Laggards in the South and East.
Finally, it should be noted that the recent Brexit will probably have effects on the European budget and hence will impact on the resources devoted to R&D in Europe and on the fund-receiving countries. Additionally, Horizon Europe, the new research and innovation framework, will have an impact on the national R&D expenditures and it will surely affect the expenditure convergence process. The success of this new R&D framework, regarding both the resources and the policies or instruments, will be essential for the income and productivity convergence among European countries.
6. Conclusions
R&D&I expenditure plays an important role in economic growth, as stated in the endogenous growth models, and consequently also in some key policies of the EU, such as the regional development and cohesion policies. In fact, EU institutions have committed increasing sums to different programmes, such as Horizon 2020 and COSME. However, recent studies, such as the European Innovation Scoreboard 2017 and Veugelers (Citation2017), have suggested that the economic crisis could have exerted an impact on the previous R&D expenditure convergence trends.
In this paper, we study the evolution of the R&D expenditure in the EU28 for the period 2004–2015, paying attention not only to the overall expenditure but also to the three major components or sectors – government, business and higher education.
The results of a sigma convergence analysis show that total R&D expenditure convergence continued throughout the period, due to convergence in the business and higher education sectors and despite government expenditure divergence. Furthermore, noticeable differences between the EU15 and the other 13 EU countries are reported. The business enterprise sector is the main driver of EU15 R&D convergence, whereas for the EU13 this role is played by the government expenditure.
In fact, the data show that the economic crisis especially impaired government expenditure convergence within the EU15 members, as their public deficits and budgets were also affected on quite different scales.
Club analysis is employed to deepen these insights. The club convergence approach for the EU28 shows two clubs for the total expenditure, but the analysis of its components reveals a larger grouping: four clubs in the government case, two clubs on the business enterprise level and six clubs in the higher education sector. The study for the EU15 and the EU13 shows a specific grouping and different patterns that are not captured by the overall analysis.
The results achieved in this study evidence the necessity of revising the EU R&D policies, with significant positive externalities, towards greater coordination and impetus, due to the impact of this expenditure on growth and development and hence on European integration. The EU programmes and policy have been shown to be insufficient to maintain government expenditures on R&D on the convergence path, particularly when an economic crisis influences their budgets unequally. In addition, the current state of the European Union, with the exit of the United Kingdom and its effects on the European budget and hence on the cohesion policies, constitutes an additional risk to the achievement of the objectives of expenditure on research and innovation.
Finally, it should be pointed out the limitations of the present study, as the length of the series analysed (2004–2015), in order to take into account all the EU28 countries. In addition, as it has been shown in the manuscript, the evolution of the expenditure on R&D can be studied from several perspectives and we have tried to overcome this drawback with complementary analyses included in the Appendices, specifically with data by source of funds and also in per capita terms, reinforcing the conclusions of the study due to the similarities found in the different analyses. On the other hand, as future research, it will be interesting to analyse whether the Brexit will have impact on the convergence or divergence process of R&D expenditure, as the UK was a net contributor and hence the European funds can be reduced with the consequent effects on fund-receiving countries. In addition, Horizon Europe, the new research and innovation framework, will have an impact on the national R&D expenditures and the results can be analysed within a few years.
Acknowledgement
The authors gratefully acknowledge comments and suggestions by three referees.
Disclosure statement
No potential conflict of interest was reported by the authors.
Figure A1. Sigma convergence (per capita expenditure, EU28).
Additional information
Funding
Notes
1 As Romer (Citation1986, p. 1003) stated: ‘investment in knowledge suggests a natural externality. The creation of new knowledge by one firm is assumed to have a positive external effect on the production possibilities of other firms because knowledge cannot be perfectly patented or kept secret’. Thus, unlike neoclassical models, these models legitimize public intervention supporting education and R&D&I. In addition, Brown et al. (Citation2017, p. 447), in their recent study for OECD countries and focusing on the high technology R&D, concluded that ‘domestic policies directly dealing with appropriability and financing problems may be more effective than traditional tax subsidies at promoting the innovative investments that drive economic growth’. It also should be remarked the theoretically work by Howitt and Mayer-Foulkes (Citation2005) where conclude three convergence groups: R&D leaders, implementation and stagnation.
2 Their progress is monitored by Eurostat. Concretely, the EU published ‘Sustainable development in the European Union. A statistical glance from the viewpoint of the UN sustainable development goals’, which contained indicators such as the expenditure on research and development or the R&D intensity, the eco-innovation index and the employment in high and medium-high manufacturing.
3 The EU programme for the Competitiveness of Enterprises and Small and Medium-sized Enterprises.
4 See Pinto and Rodrigues (Citation2010) for an empirical study on the impact of regional strategies on innovation in the EU in the period 1994–2001. In addition, Hall et al. (Citation2009) provided an excellent review of the returns of R&D.
5 In addition to the theories of regional development of Perroux (Citation1950), Myrdal (Citation1957) and Kaldor (Citation1981), which defended the divergence based on scale and agglomeration economies.
6 For example, Mulas-Granados and Sanz (Citation2008).
7 Filippetti and Peyrache (Citation2013) studied the convergence in labour productivity and the role of the technological gap in Europe for the period 1993–2007. They claimed policies to diminish the gap in technology directed to innovation capabilities, quality of human capital and education expenditure.
8 Recently, Churchill et al. (Citation2019) study the convergence in OECD countries. In addition, in a related literature, Co and Wohar (Citation2004) analysed the convergence of invention activities in US states through time series analysis, denoting the interest in the studies of convergence techniques and innovation indicators.
9 Izsak and Radosevic (Citation2017), using the Erawatch–TrendChart Inventory, concluded that the R&D&I policies have reinforced the divergence between the northwest and the south and the convergence between the northwest and the central-east. They analysed the EU28 and the period 2006–2013.
10 Reinstaller and Unterlass (Citation2012) analysed and decomposed the BERD for the EU27, concluding that the changes in the aggregate figures are driven by both within and between effects, differently among countries.
11 Phillips and Sul (Citation2007) suggested setting r = 0.3 for T ≤ 50.
12 Data extracted in September 2017. Note that previous data are not available for many countries outside the EU-15.
13 Following the recommendation by one referee, we have also performed a club convergence analysis with data in per capita terms, offering a complementary view. In order not to complicate the reading of the paper with many perspectives, the results are presented in the Appendix A. In summary, there are few differences between the categorization of countries, although the disparities achieved are highlighted in the mentioned Appendix. The most remarkable difference is that the EU13 countries, with the exception of Slovenia and the Czech Republic, are not classified in ‘high’ clubs of convergence when the per capita analysis is performed. Note that those two countries are among the few EU13 countries which increased population in the period.
14 Note that data by source of funds are not available for the 28 EU countries in this period. They are only available since 2007. In any case, and following the recommendation of one referee, we have performed a sigma convergence analysis to observe the temporal evolution with data by source of funds. Again, in order not to complicate the reading of the paper, results have been included in the Appendix B. In short, the main conclusions are similar to the obtained with data by sector performance: sigma convergence except the case of government.
15 Regarding this component, Moncada-Paterno-Castello et al. (Citation2010) compared the private R&D investment between the EU and the USA. The authors claimed that the lower intensity for the EU is a result of the sector specialization or structural effect. In addition, Archibugi and Filippetti (Citation2018) alert about the possible adverse effects on innovation of the increasing share of the private R&D to the detriment of the public one.
16 Note that the sum of the three components is not exactly the total due to a fourth sector not being included in this study: the private non-profit sector, with values near zero. Concretely, in 2015, this sector represented 0.01 per cent. It should be also noted that government and higher education could be considered jointly to face only two sectors, but we believe that the disaggregated analysis is more informative.
17 The weighted average in the EU28 was 2.03 per cent in 2015 and 1.75 in 2004.
18 In the firm framework, recently Nie and Wang (Citation2019) theoretically analysed the effects of capacity constraints on innovation, concluding that firms with lower efficiency levels launch more innovation and produce more outputs than firms with higher efficiency levels. Hence, the interaction of innovation and efficiency differences may be relevant in the business sector.
19 Concretely, the deficit in 2009 in Greece, Spain, Ireland, Portugal and the United Kingdom was 15.1, 11.0, 13.8, 9.8 and 10.1 per cent of the GDP, respectively. In addition, the transition to the equilibrium was especially complicated, with the exception of Ireland, as denoted by the deficit indicators in 2015: 5.7, 5.3, 1.9, 4.4 and 4.3, respectively.
20 See Huergo and Garcia-Vega (Citation2018) for a recent discussion about the internationalization of R&D and its effects.
21 In an interesting study about innovation and economic growth in the EU regions, Verspagen (Citation2010) reached four groups, denoting the heterogeneity in this regard. In addition, Foddi and Usai (Citation2013), through data envelopment analysis and Malmquist indexes, and for EU regions, detected notable differences in the regional knowledge performance between the rich and industrialized countries of the Old Europe and the new member states.
22 Regarding the income convergence and the role of innovation and other factors and the differences between EU15 and EU13, Chapman and Meliciani (Citation2017) concluded growing divergence across old members regions and within new members regions.
23 Rodríguez-Pose and Crescenzi (Citation2008) revised the effect of innovation on economic growth in EU25 regions, showing the importance of the local socio-economic conditions for the genesis and assimilation of innovation and its transformation into economic growth, and of proximity for the transmission of productive knowledge as spillovers are affected by distance decay effect. In addition, Capello and Lenzi (Citation2013) analysed the EU regions and concluded 5 clusters regarding innovation patterns. And Capello and Lenzi (Citation2014) carried out an interesting discussion about the different effects of invention (new ideas and knowledge creation) and innovation (commercialization of new ideas) on economic growth and the implications for the EU regions.
References
- Aghion, P., & Howitt, P. (1992). A model of growth through creative destruction. Econometrica, 60(2), 323–351. doi:10.2307/2951599
- Aghion, P., & Howitt, P. (1997). Endogenous growth theory. MIT Press.
- Archibugi, D., & Filippetti, A. (2011). Is the economic crisis impairing convergence in innovation performance across. JCMS: Journal of Common Market Studies, 49(6), 1153–1182. doi:10.1111/j.1468-5965.2011.02191.x
- Archibugi, D., & Filippetti, A. (2018). The retreat of public research and its adverse consequences on innovation. Technological Forecasting and Social Change, 127, 97–111. doi:10.1016/j.techfore.2017.05.022
- Barrios, C., Flores, E., & Martínez, M. A. (2019). Club convergence in innovation activity across European regions. Papers in Regional Science, 98(4), 1545–1565. doi:10.1111/pirs.12429
- Brown, J. R., Martinsson, G., & Petersen, B. C. (2017). What promotes R&D? Comparative evidence from around the world. Research Policy, 46, 447–462.
- Capello, R., & Lenzi, C. (2013). Territorial patterns of innovation and economic growth in European regions. Growth and Change, 44(2), 195–227.
- Capello, R., & Lenzi, C. (2014). Spatial heterogeneity in knowledge, innovation, and economic growth nexus: conceptual reflections and empirical evidence. Journal of Regional Science, 54(2), 186–214. doi:10.1111/jors.12074
- Chapman, S., & Meliciani, V. (2017). Behind the pan-European convergence path: the role of innovation, specialisation and socio-economic factors. Growth and Change, 48(1), 61–90.
- Churchill, S. A., Inekwe, J., & Ivanovski, K. (2019). Convergence of R&D intensity in OECD countries: evidence since 1870. Empirical Economics. doi:10.1007/s00181-019-01628-1
- Co, C. Y., & Wohar, M. E. (2004). Technological convergence among US regions and states. Economics of Innovation and New Technology, 13(2), 101–126.
- Filippetti, A., & Peyrache, A. (2013). Is the convergence party over? Labour productivity and the technology gap in Europe. JCMS: Journal of Common Market Studies, 51(6), 1006–1022. doi:10.1111/jcms.12066
- Foddi, M., & Usai, S. (2013). Regional knowledge performance in Europe. Growth and Change, 44(2), 258–286. doi:10.1111/grow.12007
- Grossman, G. M., & Helpman, E. (1994). Endogenous innovation in the theory of growth. Journal of Economic Perspectives, 8(1), 23–44. doi:10.1257/jep.8.1.23
- Guellec, D., & Ralle, P. (1991). Product innovation and endogenous growth. Document de Travail INSEE, 91–03.
- Hall, B. H., Mairesse, J., & Mohnen, P. (2009). Measuring the returns to R&D. Working Paper 15622, NBER.
- Howitt, P., & Mayer-Foulkes, D. (2005). R&D, implementation and stagnation: a Schumpeterian theory of convergence clubs. Journal of Money, Credit and Banking, 37, 147–177.
- Huergo, E., & Garcia-Vega, M. (2018). ‘R&D&I and firms’ internationalization: Introduction to the special issue. Economia Politica: Journal of Analytical and Institutional Economics, 35(2), 523–528.
- Izsak, K., & Radosevic, S. (2017). EU research and innovation policies as factors of convergence or divergence after the crisis. Science and Public Policy, 44(2), 274–283.
- Kaldor, N. (1981). The role of increasing returns, technical progress and cumulative causation in the theory of international trade and economic growth. Economie Appliquée, 34(4), 593–617.
- Martín, C., Mulas-Granados, C., & Sanz, I. (2005). Spatial distribution of R&D expenditure and patent applications across EU regions and its impact on economic cohesion. Investigaciones Regionales, 6, 41–61.
- Moncada-Paterno-Castello, P., Ciupagea, C., Smith, K., Tübke, A., & Tubbs, M. (2010). Does Europe perform too little corporate R&D? Research Policy, 39(4), 523–536.
- Mulas-Granados, C., & Sanz, I. (2008). The dispersion of technology and income in Europe: Evolution and mutual relationship across regions. Research Policy, 37(5), 836–848. doi:10.1016/j.respol.2008.03.002
- Myrdal, G. (1957). Economic theory and under-developed regions. Duckworth.
- Nie, P. Y., & Wang, C. (2019). An analysis of cost-reduction innovation under capacity constrained inputs. Applied Economics, 51(6), 564–576. doi:10.1080/00036846.2018.1497850
- Perroux, F. (1950). Economic space: theory and applications. The Quarterly Journal of Economics, 64(1), 89–102. doi:10.2307/1881960
- Phillips, P. C. B., & Sul, D. (2007). Transition modeling and econometric convergence tests. Econometrica, 75(6), 1771–1855. doi:10.1111/j.1468-0262.2007.00811.x
- Phillips, P. C. B., & Sul, D. (2009). Economic transition and growth. Journal of Applied Econometrics, 24(7), 1153–1185. doi:10.1002/jae.1080
- Pinto, H., & Rodrigues, P. M. (2010). Knowledge production in European regions: The impact of regional strategies and regionalization on innovation. European Planning Studies, 18(10), 1731–1748. doi:10.1080/09654313.2010.504352
- Reinstaller, A., & Unterlass, F. (2012). Comparing business R&D across countries over time: A decomposition exercise using data for the EU 27. Applied Economics Letters, 19(12), 1143–1148.
- Rodríguez-Pose, A., & Crescenzi, R. (2008). Research and development, spillovers, innovation systems, and the genesis of regional growth in Europe. Regional Studies, 42(1), 51–67. doi:10.1080/00343400701654186
- Romer, P. (1986). Increasing returns and long-run growth. Journal of Political Economy, 94(5), 1002–1037. doi:10.1086/261420
- Romer, P. (1990). Endogenous technological change. Journal of Political Economy, 98(5, Part 2), S71–S602. doi:10.1086/261725
- Verspagen, B. (2010). The spatial hierarchy of technological change and economic development in Europe. The Annals of Regional Science, 45(1), 109–132. doi:10.1007/s00168-009-0293-8
- Veugelers, R. (2017). Missing convergence in innovation capacity in the EU: Facts and policy implications. European Economy - Discussion Paper 066, European Commission.
Appendix A.
Convergence with per capita data
The main results from the sigma convergence analysis are represented in and the corresponding test included in . As in the GDP perspective, we observe sigma convergence in all cases except government (significantly divergent), being more intense in the business enterprise case, with an annual rate of −1.49 per cent.
Table A1. Test of sigma convergence (per capita, EU28).
The results from the club convergence study are summarized in . Now the countries are clustered into three categories in the total expenditure, being two in the GDP approach:
Table A2. Convergence club results – per capita expenditure.
With the aim to compare the results between the GDP and per capita terms, summarizes the main results.
Table A3. Comparison of main results from GDP and per capita perspectives
total.
Appendix B.
Sigma convergence with data by source of funds
The results from the sigma convergence analysis from data by sources of funds for the period 2007–2015 and the EU28 are summarized in and . In short, the results are very similar to those obtained in the GDP approach: we observe a sigma convergence in all the series except the government, again clearly divergent.
Figure B1. Sigma convergence (source of funds, EU28).
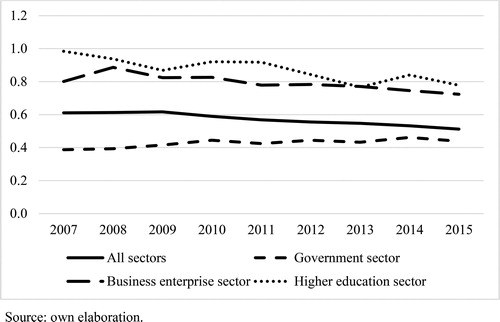
Table B1. Test of sigma convergence (source of funds, EU28).
Table A4. Comparison of main results from GDP and per capita perspectives government.
Table A5. Comparison of main results from GDP and per capita perspectives business enterprise.
A3.4. Table A6. Comparison of main results from GDP and per capita perspectives higher education.