
 ?Mathematical formulae have been encoded as MathML and are displayed in this HTML version using MathJax in order to improve their display. Uncheck the box to turn MathJax off. This feature requires Javascript. Click on a formula to zoom.
Abstract
The article discusses the structural changes in bilateral trade flows between Western Balkan (WB) countries in 2007-2018. The basic idea was to address whether there is a justification for the often proposed deepening of economic cooperation among WB states. After analysing the dynamics of mutual trade, we computed the value of intra-industry trade, whose potential decrease could indicate a divergence between observed trade structures. To detect a possible structural change in WB trade sectors, qualitative changes in those countries’ exports were calculated through the tendencies of a share of products at higher levels of processing. After calculating the export concentration coefficients, all the results were compared with those achieved by these countries in trade with the EU and in total. The article argues that there is no solid reason to pursue policies for strengthening mutual economic ties particularly towards a customs union, especially given the more attractive prospect of EU integration.
1. Introduction
The EU enlargement process is in a deep crisis, and it is doubtful that this will be significantly changed with the newly proposed EU methodology for the Western Balkans (WB) accession that has yet to be implemented (European Commission, Citation2020). Faced with persistent delays of their EU accession prospects, WB states themselves have made some efforts, at least publicly, to improve mutual cooperation. The last of them was in October 2019, when the leaders of Albania, North Macedonia, and Serbia announced that they would put into effect some sort of a mini-Schengen zone allowing free movement of goods, services, and people (with other WB countries expected to join soon). According to their public statements, the hope is that more harmonised standards and faster border crossings for goods and people would open up new markets for businesses and foster cross-border trade. A similarly ambitious proposal, albeit one that has had no epilogue, was announced in 2017 when Serbia declared that a paper had been drafted with Albania and Bosnia and Herzegovina (B&H) on the possible creation of a customs union in the WB. It is important to note that the term ‘Western Balkans’ was coined in the 2000s, originally encompassing the countries of the former Yugoslavia without Slovenia, but also including Albania. Since Croatia’s accession to the EU, six states comprise the WB (WB 6): Albania, B&H, UNMIK-Kosovo* (hereinafter Kosovo), Montenegro, North Macedonia, and Serbia.
Roughly two decades ago the EU offered important trade preferences to the WB economies with the aim of promoting their economic integration into European value chains, among other things. Also with EU support, in 2006 came the (revised) CEFTA with all WB economies plus Moldova becoming its members, which practically provides for tariff-free trade but in goods only. In fact, non-tariff barriers are not prohibited and trade in services is not regulated, with frequent violations of the agreement (for example in 2018 Kosovo imposed 100% tariffs on Serbian and B&H goods).
There is an obvious lack of in-depth analyses of economic and trade relations in the WB. In fact, we have no empirical research studies that look into the qualitative structure of trade between WB countries and its implications. The question arises whether enhanced cooperation, including the proposed customs union of WB economies, is the right step forward. By calculating several trade indicators, this paper aims to reveal the structure and consequently the quality of bilateral trade flows between WB economies. Based on the changes in their dynamics in the previous period, these parameters can help us estimate future tendencies of observed bilateral trade flows, among other things, by comparing them with the same indicators for WB-EU and total WB merchandise trade.
The expected (potential) main contribution of this paper is to show, by using extensive empirical evidence (expressed through numerous calculated indicators) sourced from bilateral flow data between WB states, that the further intensification of trade and economic integration among WB countries makes no sense, especially in comparison with the much stronger significance of the EU for each and every observed economy. Furthermore, on the basis of his calculations, the author argues that potential enhanced trade integration between WB states could even have a negative political and economic impact, including the trade diversion effect. Given that most of the relevant literature employs the gravity model, the very focus of this research on the structural change of bilateral trade flows between WB states is a contribution of its own kind.
Additionally, the usage of the disaggregated product-level bilateral export-import trade data at the 3-digit SITC level is a technical contribution of this study. Using 3-digit SITC disaggregation allows us to avoid the biases of lower levels of disaggregation. Last but not the least, this is the first empirical research of the dynamic of performances of bilateral trade among WB states, and consequently of the economic effect of trade integrations on the WB. The existing literature is usually focussed on the trade relations between the EU and WB countries and it is hard to find studies that examine the structure of trade between WB states themselves.
The rest of the article is organised as follows. The next section surveys the literature related to our topic. Section 3 presents the tested hypotheses, while the following chapter discusses the dynamics of merchandise trade within WB economies. It is followed by Section 5 where intra-industry trade among WB states was calculated, with the results being presented and interpreted. Changes in the WB’s export structures 2007-2018 – together with an analysis of export concentration indices in bilateral trade flows – are explained in Section 6, which is followed by concluding remarks and policy implications.
2. Literature review
In order to have a better understanding of bilateral trade flows between WB economies, a subset of literature has been selected. Different authors often conducted comparative studies on a sample that included a group of CEFTA members, EU (potential) candidate countries (including Turkey), or WB states (including Croatia until 2013). As all WB states are members of CEFTA (which also includes Moldova which has marginal trade flows with the rest of the region, and Croatia until 2013), most researchers dealt with this form of integration, given that it is (at least formally) a free trade area. The first articles about the positive effects of regional trade integration were published shortly after the revised CEFTA appeared in 2006 (e.g. Bartlett, Citation2009; Börzel & Risse, Citation2009; Družić et al., Citation2009; Kathuria, Citation2008 Hamovic & Subic, Citation2007; Konopek, Citation2011; Masahiko, Citation2011). While these articles differ in various aspects, such as methods, time frame, and sample size, they have reached several general empirical and theoretical conclusions. It was shown that intra-regional trade appeared to be led by the level of economic activity, then by cultural aspects such as similarity between languages. In addition, the majority of authors also noticed that being neighbouring countries and sharing the legacy of former Yugoslav market connections are contributing factors to trade flows in the region. In contrast, non-tariff barriers have a significant negative impact on trade between WB states.
Unlike this paper, most studies employed the gravity model, which seeks to predict bilateral trade based on the economic size of an economy and its distance from trading partners. For example, the study by Braha et al. (Citation2015, pp. 15–17) found that preferential trade agreements, trade liberalisation, and cultural ties of the EU candidate countries facilitate trade flows. Variables such as language and membership in common trade areas are found to be significant and raise the total export potential, with the assumption that the existence of compatriot nationals in importer countries could also play a role in export flows. The (augmented) gravity model of trade between WB economies, employed by Ninka and Pere (Citation2017), Klimczak and Trivić (Citation2015), Tosevska-Trpcevska and Tevdovski (2014), in general, showed that intra-regional trade has been positively driven by the level of economic activity and to some degree by cultural factors, while non-tariff barriers significantly reduce trade exchanges between the countries in the region. War and the one-year-post-war effect showed a strong and statistically important influence. Ranilović (Citation2017) showed that Croatia traded more with higher-income and closer countries – which is in line with the standard gravity model assumption – with a strong bias towards trade with countries of the former Yugoslavia, especially towards B&H where a strong Croatian community is based. Estimating a gravity equation, Choi and Asier (Citation2019) raised the question of whether and how much CEFTA increased Albanian export. It grew between 34% and 144%, depending on how the previous bilateral agreements with CEFTA countries are accounted for, with the deciding factor being the reduction of customs duties.
However, regarding the topic of our research, there are only a few papers questioning the reasons for CEFTA’s deepening, or even its very existence. While many authors praise the achievements of CEFTA (Baranenko & Milivojevic, Citation2012; Dragutinović-Mitrović & Bjelic, Citation2015; Hoti, Citation2015; Klimczak, Citation2016), others believe that economic benefits are secondary and that the main goal of CEFTA is to prepare countries for EU integration. Admittedly, this position doesn’t take into account agricultural trade among WB states (that are CEFTA members), which has expanded greatly since 2007 (Natos et al., Citation2014; Peshevski et al., Citation2013).
According to this group of scholars, CEFTA economic benefits are overrated and the agreement is more of a platform for political cooperation. Among others, Begović (Citation2011) notes that the general belief that trade liberalisation leads to enhanced commercial performance does not apply to CEFTA states. The author used a sample consisting of panel data, which includes CEFTA members and their major trading partners in 1999-2007. The results of the gravity model suggest that trade liberalisation did not improve trade in the region for the period under review when controlling for other trade determinants, for example historical, political and ethnic circumstances. Moreover, these countries tend to develop commercial relations with the EU rather than within CEFTA. Additionally, prior to Kosovo imposing 100% tariffs on Serbia and B&H, there was already a range of non-tariff barriers strongly hampering mutual trade. Similar conclusions were proposed by The Economist (2017), which pointed out that the short-term scope for intensifying intra-regional trade in the WB has already been largely exhausted. One of the examples provided is that Serbia was importing relatively low volumes from other WB countries and running a very large trade surplus with them, thereby reflecting the weakness of WB’s exports to the largest economy in the region. Also, Damijan et al. (Citation2006) highlighted early on that WB countries had reached their trade potential in almost all observed sectors, and hence an increase of export and import flows of the WB with the EU and other countries could be expected, as all these countries’ trade is below its potential with the rest of the world.
A rather similar view was offered by Petreski (Citation2018, pp. 303-309). Covering the period 1996-2015, he measured the effect of the CEFTA on the current composition of the members’ mutual trade. His results robustly indicate that CEFTA demonstrated quite a big and statistically significant effect on its members’ trade. However, if the instruments’ strict exogeneity cannot be reached by arguments or statistical tools, then the conclusions can show that the CEFTA effect’s rise may be rather driven, at least in part, by the correlation between the instrument and trade shocks. Namely, in his earlier study, Petreski (Citation2013) pointed out that although empirical evidence suggests that CEFTA exercised a positive, significant, and large impact on trade in Southeast Europe, these findings can to a large degree be ascribed to the disrupted trade flows in the region over the 1990s.
Additionally, according to Jusufi and Bellaqa (Citation2019, p. 75), intra-regional trade between WB states has been in decline over the last several years, as non-tariff barriers, induced by political problems, strongly and negatively impacted trade in the region. On top of that, regional businesses are also underdeveloped, due to the present trade distortions largely caused by administrative rigidities, despite recent institutional development and economic growth in the WB (Sklias & Tsampra, Citation2013).
Generally, efforts towards economic integration through the CEFTA have not increased the shares of trade with the WB despite the proximity, but the opposite happened as the EU increased its dominant trade position for all WB countries (World Bank, Citation2017, pp. 15-16). A comprehensive study by the European Commission (Citation2018) stated that overall intra-regional trade has been stagnant, and has even relatively decreased since the 2009 crisis. Exports and imports among WB states have remained concentrated in goods with low value-added (consisting largely of minerals, base metals, and foodstuffs) and their structure did not change significantly in 2007-2016 (pp. 10-12, 20). Crudu et al. (Citation2018, pp. 55-60) showed that although the CEFTA agreement was primarily beneficial for the countries’ economic relations with their neighbours and the EU, it has not had a determinative impact on economic development, trade, and investments. In an effort to uncover the reasons for the lack of success of ongoing WB economic integration initiatives, Sklias (Citation2011) came to the conclusion that only a top-down approach – an EU/International Community imposed action – can yield results, unlike authentic endeavours channelled by WB states.
The common conclusion stemming from several above-mentioned studies is that CEFTA’s positive and significant impact on bilateral trade is largely a consequence of the severely restricted trade due to wars and sanctions in the last decade of the 20th century and that WB states have already reached their full potential for mutual trade. Consequently, the question arises whether the further strengthening of mutual cooperation makes sense.
3. Tested hypotheses
This part of the research presents the hypotheses that are to be tested. As stated, the objective of this article is to analyse the currently very important and topical issue of whether deepening economic cooperation among WB economies would make economic sense. Our hope is that a structural analysis of bilateral trade flows in 2007-2018, at a highly disaggregated level, should give an answer to this question. To explore this issue, we propose the following three hypotheses:
Hypothesis 1: From 2007 to 2018 the shares of merchandise trade of the WB 6’s economies with each other has decreased in most observed cases, as well as cumulatively, indicating the reduced significance of their mutual bilateral trade.
This hypothesis will be tested by calculating tendencies of mutual merchandise trade between these six economies in 2007 and 2018. Along with the share of every country in total exports and imports of the remaining WB economies, tendencies of the average absolute annual growth of trade (total, with the EU, and with the rest of the WB, expressed in EUR) will be computed. Also, to gain insight into the relevance of overall trade within those countries relative to the total trade of the WB 6, we will calculate the share of cumulative exports and imports to and from the WB and put it in relation to cumulative exports and imports of all WB economies. A presumed decrease of shares in mutual trade between those countries, all of which are CEFTA members, would suggest a reduced relative importance of this free trade area (with a consequential reduced trade impact on the overall economic performances of those six states), thereby suggesting that further efforts to enhance cooperation (through a customs union, for example) are most likely to be futile, due to the increased significance of other partners for those economies.
Hypothesis 2: In the period under review, intra-industry trade between the WB 6 has substantially decreased, creating in this way no conditions for a quality improvement of bilateral merchandise trade and indicating a further deceleration in export and import flows between these economies.
To accept or reject this hypothesis, the most common technique of measuring the share of intra-industry trade – the Standard Grubel-Lloyd index (Grubel and Lloyd Citation1975, pp. 21–23) will be used. It measures the degree of intra-industry trade due to product differentiation, which indicates how a country simultaneously imports and exports varieties of a particular product. In the aggregate intra-industry trade index, higher ratios suggest that the economies of scale and various sources of gains are being exploited. The fall of intra-industry trade between WB states would indicate a deterioration of their bilateral trade flow quality, implying the continuation of a slower-than-average growth of their mutual trade. Even the stagnation of intra-industry trade, given its empirically proven tendency to grow worldwide, would suggest a negative structural development in bilateral trade flows between WB economies.
Hypothesis 3: From 2007 to 2018 the export quality of WB bilateral trade flows in the majority of observed cases has shifted towards a decreased portion of products at higher levels of processing (or retained roughly the similar share), indicating a deterioration (or stagnation) of the WB 6’s bilateral trade structures.
This hypothesis will be tested using the methodologies developed by Mayer and Wood (Citation2001), Munkacsi (Citation2009), and UNCTAD (2019). A presumed decreasing share of products at higher levels of processing (those with higher factor intensity and advanced technology structure) in total exports would suggest a qualitative deterioration of mutual trade between those economies, given the lower share of products with higher value-added. The qualitative changes in the WB 6’s mutual trade are measured through tendencies in the shares of skill-intensive manufactures, (medium- and) high-tech products, and high-skill and technology-intensive manufactures (between 2007 and 2018), where higher-level indicates their better quality. Analysing export quality in this way is especially important given that the basic condition for accelerating export growth is its structural improvement.
4. Dynamics of merchandise trade within Western Balkan economies
The data on countries’ exports (and imports) structures are drawn from the United Nations Commodity Trade Statistics Database (COMTRADE). We have used the structure of exports and imports by Standard International Trade Classification (SITC), encompassing 261 merchandise groups at the SITC 3-digit level (Revision 4). The first year for which we have data at this level of disaggregation is 2007, while the last available year is 2018. The UN COMTRADE database provides no data for both observed years for the following pairs of countries: Albania-Montenegro, B&H-Montenegro, and B&H-Albania, and there is no data for Kosovo at all (as it is not a member of the UN). It is important to note that there are often differences between data if they are mirrored, which is mostly a consequence of the different capabilities of national statistical offices to collect them (they are the ultimate sources of data for the UN COMTRADE). Hence, we applied two rules. First, we used data from countries that have data for both observed years (for example, this was the case when we analysed trade flows between North Macedonia and B&H, where only the former had data for 2007). Second, we have chosen as our primary source the country with the bigger export in the selected years, presuming that a larger sample leads to smaller error probability.
When it comes to the total volumes of trade between the EU and WB states, first and foremost we used the (official) EUROSTAT (online) database. Data referring to total trade between WB countries are taken from the CEFTA (official) statistical portal (for 2018), while for 2007 – in the absence such a source – we have had to use national statistical sources. All statistical sources are listed in the appendix.
On the basis of our calculation, using values expressed in EUR, which can be seen in and in in the appendix, there are clear signs of a decrease in the significance of WB trade flows (CEFTA minus Moldova) for most WB economies. Namely, because of a slower trade growth from and to CEFTA members in the observed period, shares of exports and imports to and from them have decreased.
Table 1. Standard Grubel–Lloyd index 2007 and 2018 for merchandise trade between WB economies.
Table 2. Shares of (Medium- and) High-Tech products, Skill-intensive manufactures, and High-skill and technology-intensive manufacture products in merchandise trade flows between WB economies in 2007 and 2018.
4.1. Graph 1
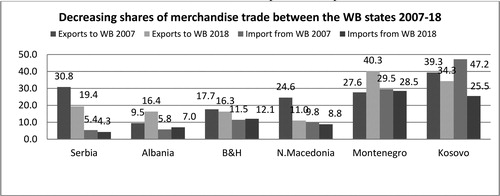
The shares of the rest of the WB countries in total exports and imports of six WB countries
Simplifying the matter, we aggregated merchandise exports (and imports) for all six countries observed and did the same with their intra-WB exports and imports (their mutual trade is counted twice in both cases). The results clearly indicate that cumulative exports (and imports) between WB countries relative to their total exports (and imports) decreased significantly in the period 2007-2018.
This is especially pronounced when it comes to export (the share of which fell from slightly more than one-fourth to 17.6%) and to a lesser extent when merchandise import is regarded (the portion of which was 10.9% in 2007 and 9.4% in 2018). Namely, in the observed period cumulative exports of WB states have grown at high rates (on average 8.4% annually), increasing their volumes, expressed in EUR, almost two and a half times. At the same time the exports of those economies to the remaining WB countries have grown at a significantly slower rate (by 61% cumulatively or 4.4% on average annually), thereby reducing their shares in total export. The cumulative imports of those economies have grown slower because of the effects of the Great Recession (by 62%, on average 4.5% annually), but still at an undoubtedly faster pace than the increase of cumulative imports from CEFTA members (by 36%, on average just 2.8% annually). So, the cumulative trade of those six economies has risen at a much faster pace than their mutual bilateral trade.
The opposite pattern was detected in the export of those six states to the EU 28. Namely, the share of their cumulative export to the EU in their total export has grown from 67.7% in 2007 to 69% 11 years later, growing at an average annual rate of 8.4%. At the same time, the increment of EU import share in total imports was similar (by 1.4 percentage points, to 59%), rising at an average annual rate of 4.7%.
Looking at particular WB countries, the average annual export growth in this period amounted to 8.7% for Serbia, 7.9% for B&H, 8.1% for North Macedonia, 10.8% for Albania, 7.5% for Kosovo, while the average export growth to the rest of the WB was generally lower, amounting to 4.2% in the case of Serbia, 5.7% for B&H, just 0.6% for N. Macedonia, 16.4% for Albania, and 9.3% for Kosovo. Yet, in the smallest economy of the WB, Montenegro, the share of exports with WB states increased (and the total export even fell in the observed 11 years, while export to the rest of the WB rose at an average annual rate of 2.3%), which was also the case with Albania’s export and import to CEFTA members (due to increased trade flows with Kosovo). In addition, B&H’s imports have also shown a marginal share growth when it comes to CEFTA economies. However, given the cumulatively modest sizes of the mentioned economies and their merchandise trade to the overall trade flows in the WB, it is clear that there is a tendency of reduced significance of bilateral trade flows between these six economies, especially in view of the growing significance of trade with the EU for those countries (in 2014, compared to 2001, total exports to ‘third countries’ increased by about 16 billion EUR, and only by about 4.5 billion EUR among the countries in the region, according to Ninka & Pere, Citation2017, pp. 108–110). So, our first hypothesis can be accepted, as from 2007 to 2018 the shares of merchandise trade of the WB 6’s economies with each other have decreased in most observed cases, as well as cumulatively.
5. Tendencies of intra-industry trade in the Western Balkans
The standard Grubel–Lloyd index measures the degree of intra-industry trade due to product differentiation with scale economies, which indicates how a country simultaneously imports and exports varieties of a particular product. As a rule, the index is given as the share of intra-industry trade in total trade. In the absence of trade within the same product groups (or industries), the index will be zero. In the opposite case, when exports and imports are equal for all products at a given level of disaggregation the index will be one. Bigger shares of intra-industry trade indicate that the economies of scale and various sources of gains are being utilised. Therefore, if the bilateral Grubel–Lloyd index is relatively high for a highly aggregated set of merchandise trade flow data (at the SITC 3-digit level), it can be inferred that a relatively large proportion of bilateral trade in this data set is associated with two-way trade in differentiated products (Grubel & Lloyd, Citation1975, pp. 21–23).
(1)
(1)
GLj– intra-industry trade index for total trade between the two countries; Xij(Mij) – exports (imports) of product ‘i’ for country ‘j’, where ‘i’ (sector, merchandise group)= 1…N
A low index value indicates the possibility of significant structural adjustment costs due to increased competition from other countries. It also suggests that the country is not making a significant income from horizontal and vertical integration into the world economy and is not taking advantage of selling products in large markets and from specialisation in certain areas. It has been empirically proven that a possible rise of intra-industry trade is an indicator of economic development, as well as a sign of a reduced technological gap compared to advanced economies.
5.1. Results
We calculated the Standard Grubel–Lloyd index, meaning intra-industry trade between WB states for 2007 and 2018. Results are given in , which shows that in the majority cases a fall of indices was detected between the two observed years. Looking at intra-industry trade between the economies of the region, the only cases of growth of the Grubel–Lloyd index were detected in merchandise trade between B&H and N. Macedonia and N. Macedonia and Albania. On the other hand, when it comes, for example, to bilateral trade flows between Serbia and B&H there is a clear falling trend of intra-industry trade in the observed period, as well as when Serbia – North Macedonia merchandise trade is concerned. The relatively low values of obtained indices, as well as their dynamics, are not good signs. Things look worse given the empirically detected growing trend of these coefficients in general, but also of the total trade of WB economies (for example, Kosovo recorded a growth of this index from 0.085 to 0.127, while the rise in the case of Serbia was more pronounced – from 0.420 in 2007 to 0.540 in 2018). Yet, the development of trade with the EU seems even more important. Namely, in in the appendix, it can be seen that all six WB economies detected a strong growth of intra-industry trade with the EU in the period under review. In this regard, the transition experience of European countries is particularly important for WB economies, and they detected a strong growth of the same indicator since the 1990s, making their economies more similar to the EU economies in the so-called catching-up process (Kawecka-Wyrzykowska 2008, p. 15).
As the empirical experience of developed countries, including economies in Central Europe, shows, intra-industry trade has opened up new areas of cooperation leading to the development of global value chains (GVCs). Given the low and declining indicators of intra-industrial trade between the WB states, it is clear that this type of cooperation between these countries has practically not been achieved, which is in line with the general experience. Overall, the ‘happier’ countries in the region are attracting FDI, mainly from the EU, thus creating value chains and dominant trade flows. In view of all this, there does not seem to be room for any other kind of economic integration, including enhanced regional cooperation (such as a customs union, for example), especially among non-complementary economies – which is the case with those of the WB.
6. The change of the Western Balkans’ export structures 2007–2018
Given the crucial role of changing the nature of the skill and technological composition of products to improve economic performance, the purpose of this part of the paper is to investigate the change in the quality of WB exports by classifying them according to the applied level of skill and technology. Trade merchandise groups (261 of them) are used to compute different indicators to show how countries are moving out from primary commodities to manufactures-skill and technology content sectors, including high-tech products. Namely, a higher-level of applied skill and technology content suggests better quality of a given product or merchandise group. It should be reiterated that the basic condition for accelerating export growth is its structural improvement.
We used the UNCTAD (2019) methodology with all merchandise groups classified into five categories, where we were focussed on high-skill and technology-intensive manufactures. They cover Section 5 of Standard International Trade Classification (SITC), SITC divisions 75, 76, 87, 88 and SITC merchandise groups 776, 792, 891, 892, 896, 897 and 898.
Then, in line with the methodology developed by Mayer and Wood (Citation2001, pp. 9-10), we extracted the shares of skill-intensive manufactures in WB bilateral export flows. The point is that manufacturing sectors (industries) are positioned by their skilled/unskilled labour ratios or other measures of skill intensity. A wide explanation of this type of classification is also given in the study by Nikolić, but what is important for our analysis is that chemicals, machinery, cars, aircraft, and instruments are classified as skill-intensive, which will be used as a proxy for the achieved level of exports sophistication.
After that, we have used the methodology developed by Munkacsi (Citation2009). He classified exports according to technology structure into four categories, but the most important objective for us was to extract medium- and high-tech products from all other goods. Then, we calculated the shares of high-tech products alone as well as the cumulative portions of medium- and high-tech products in the total export. These types of products – with higher processing levels – largely determine the overall quality of a country’s export structure. An eventually growing share of these products in bilateral trade flows would suggest a qualitative improvement of mutual trade between WB countries. Which merchandise groups make up these categories is also explained in detail in a study by Munkacsi (Citation2009), but generally they include the majority of products belonging to Sector 5 (Chemicals and related products) and Sector 7 (Machinery and transport equipment).
All of the mentioned classifications have been used in numerous studies. According to Fabrizio et al. (Citation2006), a growing high-tech export share causes higher unit value compared with other countries, also showing that, with deeper integration into the EU, CEE states’ export structure had significantly improved. Crespo and Fontoura (Citation2007) examined the new member states’ exports of goods going to the EU15 in time and by cross-section. The share of low-skill exports decreased sharply. The Czech and Hungarian export structure has strongly improved, becoming the most similar to that of long-time EU member states, with the Hungarian export structure resembling mainly the Austrian and German examples. Landesmann and Worz (Citation2006) analysed the export specialisation of new CEE member states and pointed out that, considering medium and high-tech products, specialisation increased (which the authors explained by unit labour costs).
Shimbov et al. (Citation2019) stated that export sophistication has a positive and significant effect on growth in WB economies and that this process, associated with greater participation in GVCs, is more driven by the sophistication of medium-skill and technology-intensive manufacture products than by the sophistication of high-skill goods. The paper by Trlaković et al. (Citation2018) showed that commodity groups produced by medium-low and low technology industries had the greatest effect on the change in the volume of GDP p/c in WB countries (including Croatia) in 2005–2015.
6.1. Results
As proposed, we calculated the shares of the four mentioned product groups according to applied skill and technology content. shows: the shares of Cumulative medium- and High-Tech products (Medium + High-Tech), Skill-intensive manufacture products, High-Skill and technology-intensive manufactures, and High-Tech products in the exports of WB countries to other WB economies. As the classified products’ categories showed totally different tendencies for different trading flows, there are significantly different trends regarding the observed bilateral trade flows. For example, looking at the Serbian export to N. Macedonia, all four applied product categories detected a solid share growth, implying the improved quality of exports from Serbia to its southern neighbour. Yet, a worldwide growing trend of this kind of products in international trade should be noted, which certainly makes this achieved progress of Serbia’s export sector less relevant. On the other hand, B&H’s export to Serbia has strongly deteriorated from 2007 to 2018, as shares of cumulative Medium- and high-tech products and Skill-intensive manufacture products have almost halved. When the Serbian export structure to B&H is concerned there is an improvement of two wider covering indicators, with a fall of High-Tech and High-skill technology-intensive products’ shares. While the Macedonian export to B&H and Albania has solidly improved, its import from the same markets has shown an opposite trend. Serbia improved its export structure to Albania, while Albanian export to Serbia practically stagnated at a very low achieved structural level. North Macedonia largely improved its export quality to Montenegro, while a strong deterioration of the export structure was detected in the opposite direction. As expected, Serbia has the highest shares of high processing export products, while smaller WB economies like Albania or Montenegro have the smallest portions of this kind of product, especially High Tech. Looking at the first two categories, which are more inclusive and practically encompass all merchandise groups from SITC Sector 5 and 7, the situation is essentially the same.
In summary, showed so divergent structural trends that there is no easy way to draw a clear conclusion. Therefore, the initial hypothesis referring to the stagnating or decreasing share of products at higher levels of processing in overall bilateral trade flows between WB 6 countries can neither be accepted nor rejected. Namely, the results are inconclusive since in half of the observed 56 cases structures have deteriorated or stagnated from 2007 to 2018. At the same time, in the other half of observed cases, the structures were improved.
But the analysis was not yet complete: we then computed the same indicators regarding both the total and export to the EU from WB economies. What is striking is that almost all observed WB countries recorded an improvement of their export structure in 2018 compared to 2007, at the same time achieving a significantly higher level of export sophistication compared to regional trade flows (results are given in in the appendix). In view of similar trends in Central and Eastern European countries and in emerging markets, the conclusion suggested by these tendencies is that the detected trends in bilateral trade flow in WB can be seen in somewhat different contexts. Namely, given the improvement of export structure not only worldwide, but also when export to the EU or the total export of those same states is concerned (see: World Bank, Citation2019, 11-21), the trade structure detected among WB countries can also be seen as very unfavourable, both in terms of its dynamics and especially in terms of the achieved level of export sophistication.
6.2. Tendencies of export concentration coefficient in WB bilateral trade flows
In order to better understand the change in bilateral export structures, we have used the export concentration ratio (Cxj), also known as the Herfindahl-Hirschmann index. This index ranges from 0 to 1, with 0 reflecting the least concentrated export (import) portfolio and 1 the most concentrated (UNDP, Citation2011, 44). Export concentration reflects the degree to which a country’s exports are concentrated on a small number of products. It is normalised because the number of merchandise products differs from country to country.
The decline in export concentration ratios was a tendency in almost all countries in the post-World War II period, especially in the last two decades of the 20th century. In addition, it is natural for smaller (as well as less developed) countries, like those in the WB, to have higher ratios of exports because they can’t sufficiently diversify their export offer.
It is empirically proven that at some point developed countries began to raise this coefficient, as they were generally achieving some specialisation in high value-added products. Given that the export concentration ratio of country A to country B is at the same time the import concentration ratio of state B to state A, there is no need to separately analyse this indicator (apart from the not so rare situation when data are not correct).
(2)
(2)
where i = 1…n, n = number of SITC 3-digit export categories (about 260); Xij = value of export of sector ‘‘i’’ from the country ‘‘j’’ in a given year; Xj= total export volume of the relevant country in the same year.
We have calculated the export concentration ratio of WB 6 in their trade with each other. To interpret this indicator for economies that are not developed and trade with each other in a totally different context depending on various non-economic factors (the legacy of former Yugoslavia, common languages, ongoing political disputes) is very tricky. However, the results could provide an additional explanatory tool in our efforts to address the fundamental question of this paper: whether the deepening of economic integration in the WB makes economic sense.
Based on empirical data, a fall of export concentration would be an expected tendency given the reciprocal mutual opening of these countries (diversification of import demand) in the last two decades and the growth of the absolute level of bilateral trade, which is in line with the increase in the purchasing power of the population of those economies. Also, given that the fall of export concentration has been a global tendency in the last decades, we can also expect to detect spill-over effects of this trend on bilateral levels.
In line with this, our calculations presented in show that export concentration ratios have mostly decreased, excluding some rising bilateral trade flows, largely between smaller WB economies. As expected, as the largest economy in the region Serbia has the lowest level of bilateral export concentration ratios, which is, among other things, a consequence of the size of its exports. When it comes to the dynamics of the Herfindahl-Hirschmann index regarding merchandise trade flows between Serbia and B&H, there is a clear falling trend of both Serbian export concentration to B&H, and Bosnian export concentration to Serbia. The situation is the same with Serbia’s trade with North Macedonia. However, there is a fall in the concentration of B&H’s export to Macedonia, but a rising concentration of Macedonian exports to B&H. The majority of bilateral trade flows show a similar picture, but there are also exceptions, particularly when it comes to smaller economies. The most drastic example is the export of Montenegro to N. Macedonia, which became strongly concentrated in 2018. The high level of the Herfindahl-Hirschmann index in some WB economies generally represents a poor diversification of those states. High export concentration ratios detected in Montenegro, Albania, and Kosovo in their trade with other WB economies are caused by a strong share of only a handful of commodity groups, always resource- or labour-intensive ones. These examples indicate why it wouldn’t be good to see a significant increase in the specialisation of those economies because, given the domestic factor availability, or production potential, it would practically mean that these countries were strongly increasing the share of certain products at the lower processing stage, which generally has a low unit value. Generally speaking, and especially in the medium- to long-run, the preferred route is export diversification, basing exports on a large number of products in multiple phases of finalisation, and most preferably export-based on new products.
Table 3. Export concentration ratio (Herfindahl-Hirschmann index) in 2007 and 2018 (merchandise export from one WB economy to another).
However, overall development suggests that the level of export diversification has not achieved significant improvements given the relatively high level of export concentration ratios despite a decreasing tendency. So, in spite of these empirically tested and expected tendencies, the overall picture is far from simple, adding to the inconclusive statement regarding the previous part of this chapter. Namely, even the relatively low and decreasing values of the coefficients in the case of bilateral trade between Serbia and B&H and Serbia and Macedonia, similar to those of the developed countries, are not a consequence of the broad supply of those countries’ export sector and its favourable structure; instead, they were above all caused by a lack of certain competing products. Namely, there are often only a few merchandise groups that have a significant share, and these are, as a rule, primary, resource, or labour-intensive products. This statement can be easily verified by looking into the structure of bilateral trade flows between WB economies. For example, as much as 29% of Serbian import from N. Macedonia, that is N. Macedonian export to Serbia was made up of merchandise groups belonging to division 67 (Iron and steel), which are certainly not products of a high phase of finalisation. As much as half of the Macedonian export to Montenegro consisted of agricultural products (sector 0-Food and division 11-Beverages), indicating the unfavourable structure of their mutual trade.
To provide additional comparative insight, we calculated the concentration ratio of both total and exports of those countries to the EU. These ratios are, as expected, lower than their bilateral ratios, which is unsurprising given the significantly larger number of products that they export. However, some WB economies still have a high export concentration index of total export, especially Albania, Montenegro, and even Macedonia (0.222), indicating the poor diversification of those economies. For example, in Montenegro, a very high level of export concentration ratio in 2018 (0.339) was caused by the fact that a single merchandise group accounted for one third of total exports (684-Aluminum). It was even worse in 2007 when the same index was 0.784. A similar situation emerged in Albania (0.541) where the share of 851 (Footwear) was about one quarter in 2018, which is certainly not a good indicator given the low level of value-added in this kind of product. The situation is better in Serbia (with this index being stable - 0.088 in 2007 and 0.080 in 2018) and B&H (0.108 in 2018), while Kosovo has decreased its concentration ratio level in the last 11 years (to 0.133 from 0.175). When it comes to export to the EU, all six states recorded declining tendencies, as expected, but the achieved level of this indicator is – excluding Serbia and B&H – relatively high (see in the appendix).
These findings, along with the previous ones relating to change in WB trade structures, are certainly inconclusive. Yet, it can be assumed, especially in view of the tendencies of WB exports both total and to the EU, which recorded a significant improvement in the period under review, as well as the worldwide trend of decreasing export specialisation, that the basic assumption of the article can be accepted with a dose of reservation.
7. Concluding remarks
The objective of this article is to empirically examine the bilateral trade of WB countries in the period 2007-2018. The basic idea was to address the justification for the often proposed deepening of economic cooperation among WB states.
After analysing the dynamics of mutual trade, the value of intra-industry trade was calculated. Then, qualitative changes in those countries’ exports were computed through tendencies of the share of goods at higher levels of processing, followed by a calculation of trade concentration coefficients. All results were compared with those achieved by these countries in trade with the EU and in total.
First, two of the tested hypotheses are accepted. Namely, from 2007 to 2018 the shares of merchandise trade of the WB 6’s economies with each other have decreased in most observed cases, as well as cumulatively, indicating the decreasing significance of trade cooperation in the region, expressed mostly through CEFTA. In that context, the significantly slower-than-average growth of their mutual trade in the observed period is only a sign of these processes. In fact, the results clearly indicate that cumulative exports (and imports) between WB countries relative to their total exports (and imports) decreased significantly in the 2007–2018 period. This is especially pronounced in exports (with the share falling from slightly more than one-fourth to 17.6%), while the opposite trend was detected for the export of those six states to the EU 28.
The second hypothesis is also valid: in 2018, compared to 2007, intra-industry trade (derived from bilateral trade flows in the region) has mostly decreased. The relatively low values of obtained indices, as well as their falling dynamics, suggest a divergence between the observed trade structures, creating in this way no conditions for a quality improvement of bilateral merchandise trade and indicating a further slowdown in export and import flows between these economies.
Deteriorating trade quality (structure) between WB states indicates that there is little room for any other kind of economic integration, including enhanced regional cooperation, such as a customs union. Namely, as the empirical experience of developed countries, including economies in Central Europe, has shown, intra-industry trade has opened up new areas of cooperation, leading to the development of GVCs. Overall, the countries in the region are attracting FDI, mainly from the EU, thus creating value chains and, strongly associated with that, increasing trade flows with the EU. But, in spite of that, the major problem for WB states remains their poor integration into Europe’s developed GVCs, while trade within the region is limited and tends to be bilateral rather than cluster-like. This is the case despite the fact that WB states have seen a growth of trade in components and parts above the global average, mostly due to factors of proximity, geography and labour cost differences, and due to the international fragmentation of production (Shimbov et al., Citation2013). To quote one example, the Fiat Chrysler Automobiles plant in Serbia exports cars to the EU market, while its suppliers from N. Macedonia specialise in the production of insulated electrical wiring. On top of that, there are market complementarities, such as in tourism where, for instance, Montenegro and Albania might sell bundled travel packages for tourist destinations. These sectors can further pull local manufacturing or services and strengthen links between WB states. Similarly, Serbia’s growing ICT market can source human resources from N. Macedonia or B&H (World Bank, Citation2018, p. 27). Returning to merchandise trade, an indicative view was proposed by Ilahi et al. (Citation2019, pp. 3-10), who argues that linking up with GVCs could be greatly beneficial for promoting exports, as they have proven to be an efficient way for smaller economies, particularly in Europe, to raise exports and integrate into global trade.
When it comes to the third hypothesis, the findings referring to the change in the structure of bilateral export and import are inconclusive, as is the additional part of this chapter dealing with the dynamics of export and import concentration among WB economies. Yet, it can be assumed, especially having in mind the tendencies of WB exports both total and to the EU, which recorded a significant improvement in the period under review, that the basic assumption of the article can be accepted with some reservations. Namely, the trade structure among WB countries, although not conclusively deteriorating, can also be seen as unfavourable. That includes both its dynamics and especially the achieved level of export sophistication, given the improvement of the export structure of these states to the EU or of their total export, but also the tendencies of export structures worldwide.
While this research has identified many relevant trade tendencies among WB states, it is far from encompassing all relevant export and import flows in the region. In fact, the issue is not exhausted by the findings in this study, and there are several further research avenues such as different time periods and a more in-depth look into the change of product structures. Some of the questions raised, especially regarding the reasons for the lack of deepening of cooperation between WB countries (especially given the growing role of the EU for all of the observed economies) have been answered, but some may find the answers insufficiently empirically grounded. In addition, a three-digit level of disaggregation cannot adequately capture individual products in trade with each other, which is often very important given how small these economies are. Unit Value indicators may be helpful in pointing out differences in product quality, but they are often lacking, especially at a higher level of disaggregation. In addition, we do not have structures for the period before 2007, while the non-mirroring of statistics is often unacceptably frequent.
Yet, the future prospects of CEFTA in the context of a possible deepening of cooperation among these individual economies, despite the doubts raised, remain open. It seems certain that fresh analytical approaches might be necessary to encompass the reality of the WB trade structure, in an attempt to determine the rational scope of trade integration between these countries.
Based on our research, it seems that there is no strong justification for the proposed deepening of economic cooperation among WB states. Practically all three hypotheses tested in this article, to a lesser or to a larger extent, suggest or imply the decreasing significance of regional trade flows, with at best stagnant bilateral export-import structures. Namely, trade structures among WB states, despite not deteriorating or improving on average in the period under review, can be regarded as unfavourable given the improvement of the export structure of these states to the rest of the world or to the EU, and bearing in mind the generally favourable tendencies of export structures worldwide. Additionally, using intra-industry trade indicators, divergences between WB trade structures were detected, thereby indicating no room for the acceleration of bilateral export and import flows.
8. Policy Implications
When it comes to the practical implications of this research, it is certain that there are numerous problems regarding possible deeper integration in the WB. First, the true question is the reality of the current relations among WB economies and the degree of their genuine willingness to pursue economic cooperation with each other. In this regard, there are fears that the larger countries would dominate and benefit far more than the smaller ones, which is a factor hampering initiatives for deeper regional integrations. Third, the conditions for a successful customs union, such as the EU, are quite specific and work well when members have similar economic profiles and exchange similar products, which is not the case in the WB. Additionally, creating a customs union does not eliminate administrative barriers such as border cheques – a single market is needed for that. An example of that is Turkey, which is in a customs union with the EU, but that doesn’t prevent huge queues of trucks forming on the Turkish-Bulgarian border (The Economist, 2017).
The idea that a Balkan customs union attached to the EU could be an emergency solution, without having to expand the EU, is unrealistic given the historical legacy of animosity in the region as well as the non-complementarity of these economies. Also, another similar proposal was about establishing a sort of ‘pre-membership’. According to such a project, WB countries would take part in EU decision-making processes as observers, without voting rights, on issues that are of concern for the region, which is not an encouraging solution for WB states.
There is no doubt that the existence of CEFTA is moderately beneficial, at least because it instigates cooperation among those states. However, before CEFTA’s foundation, the dominant portion of merchandise trade among WB states was covered by bilateral free trade agreements, so when the (revised) CEFTA was inaugurated in 2006, the existing trading patterns were mostly confirmed. One of CEFTA’s notable limitations is the weak coordination of the different states’ trade policies. Additionally, the legacy of the former Yugoslavia’s internal markets, along with their consumer habits, the large number of ethnicities living outside their own domicile states, as well as practically the same languages used in Albania and Kosovo or Serbia, B&H and Montenegro, are all factors pushing for stronger cooperation between those countries, regardless of CEFTA. For example, the crisis in the 1990s, which involved armed conflicts and sanctions, distorted the later achieved results by artificially increasing them from a very low base. Without the former Yugoslavia, WB bilateral trade flows would have been much lower, as was the case with the trade of these states with Albania. Also, in analysing the CEFTA record, specific realities must be taken into account, such as the legacy of armed conflicts and animosities that had an adverse impact on trade. Finally, the dominant trading and, more generally, economic partner for all WB states is the EU.
In general, all given conclusions implicitly suggest a need for the acceleration of the EU enlargement process, which is currently at a practical standstill. Namely, if the WB countries lose the European track it will backfire on the EU in terms of security and migration, as well as in the context of interest representation. Also, the vacuum potentially left by the non-fulfillment of EU promises could easily be filled with Russian, Turkish and even Chinese interests (Fenkart, Citation2019).
The previous conclusions suggest that there does not seem to be room for any other deeper kind of economic integration, especially among non-complementary economies – which is the case with those in the WB. It means that deepening cooperation in the region is not the answer to the existing economic problems in the WB. All of this suggests that there is no solid reason to believe that strengthening bilateral economies ties, particularly towards a customs union, is the right policy – especially in view of the more attractive prospect of EU integration.
Disclosure statement
No potential conflict of interest was reported by the authors.
Figure 1. The shares of the rest of the WB countries in total exports and imports of six WB countries. Source: See Appendix 1.
References
- Baranenko, E., & Milivojevic, S. (2012). Bilateral trade flows between Western Balkan Countries. Chapter 21 in European Integration Process in Western Balkan Countries (Institute of Economic Sciences), 1, 416–434.
- Bartlett, W. (2009). Regional integration and free-trade agreements in the Balkans: opportunities, obstacles and policy issues. Economic Change and Restructuring, 42(1/2), 25–46. doi: 10.1007/s10644-008-9062-4
- Begović, S. (2011). The effect of free trade agreements on bilateral trade flows: The case of CEFTA. Zagreb International Review of Economics and Business, 14(2), 51–69.
- Börzel, T., Risse, T. (2009). The rise of (inter-) regionalism: The EU as a model of regional integration, APSA Meeting Paper, Toronto, Canada.
- Braha, K., Qineti, A., Ibraimi, S., & Imeri, A. (2015). Trade and integration: A gravity model of trade for selected EU candidate countries. No 211371, 2015 Conference, August 9–14, 2015. International Association of Agricultural Economists
- Choi, J., & Asier, M. (2019). The trade effects of Albania’s trade agreements with CEFTA members. Post-Communist Economies, 2019, 31issue (4), 451–463. doi: 10.1080/14631377.2018.1537736
- Crespo, N., & Fontoura, M. P. (2007). Integration of CEECs into EU market: Structural change and convergence. JCMS: Journal of Common Market Studies, 45(3), 611–632. doi: 10.1111/j.1468-5965.2007.00726.x
- Crudu, R., Olesea Sirbu, O., & Ignatov, A. (2018). Central European Free Trade Agreement: Did the initiative prove its commitments?. Eastern Journal of European Studies, 2018, 9(1), 45–62.
- Damijan, J., De Sousa, J., Lamotte, O. ( (2006). ): The effect of trade liberalization in South-Eastern European countries, The Vienna Institute for International Economic Studies, Working Paper, 70.
- Dragutinović-Mitrović, R., & Bjelic, P. (2015). Trade regimes and bilateral trade in the EU enlargement process: Focus on the Western Balkans. Acta Oeconomica, 2015, 65issue (2), 249–270. doi: 10.1556/032.65.2015.2.4
- Družić, I., Penava, M., & Sekur, T. (2009). Dynamics and composition of trade relations between Croatia and CEFTA 2006 Countries. Proceedings from the Third International Conference:Regional Cooperation and Economic Integration: Challenges and Opportunities, October, 15-17 2009, Faculty of Economics, Skopje.
- European Commission (2018). Untapped potential: Intra-regional trade in the western Balkans. European Economy-Discussion Paper 80. Luxembourg: Publications Office of the European Union.
- European Commission (2020). Enhancing the accession process – a credible EU perspective for the Western Balkans, Brussels, 5.2.2020 COM (2020) 57 final, pp. 1–7.
- Fabrizio, S., Igan, D., Mody, A., & Tamirisa, N. (2006). Czech Republic, Republic of Estonia, Hungary, Republic of Latvia, Republic of Lithuania, Republic of Poland, Slovak Republic and Republic of Slovenia – Export Structure and Credit Growth. IMF Country Report No. 06/414, International Monetary Fund. doi: 10.5089/9781451807110.002
- Fenkart, S. (2019). The promise of the European Union towards the Western Balkans: Reflections on the French perspective. International Institute for Peace, October 24, 2019. https://www.iipvienna.com/new-blog/2019/10/24/the-promise-of-the-european-union-towards-the-western-balkans-reflections-on-the-french-perspective (accessed November 25, 2019)
- Grubel, H. G., & Lloyd, P. J. (1975). Intra-Industry Trade: the Theory and Measurement of Intra-Industry Trade in Differentiated Products (pp. 21–23). London: Macmillan.
- Hamovic, V., & Subic, J. (2007). Cefta-Strengthening Of Competition And Weakening Of Monopoly. Economics of Agriculture, Institute of Agricultural Economics, 54(3), 345–351.
- Hoti, A. (2015). Kosovo in Former Yugoslavia and Its Way to the EU Integration: Perspectives and Challenges. In A. Hoti & I. Kosir (Eds.), European perspectives of the Western Balkan countries. (disputed territory) (pp. 1–265). Prishtina: AAB College.
- Ilahi, N., Khachatryan, A., Lindquist, W., Nguyen, N., Raei, F., Rahman, J. ( (2019). ): Lifting growth in the Western Balkans; The role of global value chains and services exports, No. 19/13, IMF Departmental Papers/Policy Papers from International Monetary Fund.
- Jusufi, G., & Bellaqa, B. (2019). Trade barriers and exports between Western Balkan countries. Naše Gospodarstvo/Our Economy, 65(4), 72–80. doi: 10.2478/ngoe-2019-0021
- Kathuria, S. (2008). Western Balkan integration and the EU: an agenda for trade and growth (English). Directions indevelopment, 44174. Washington, DC: World Bank.
- Klimczak, L. (2016). Trade liberalization and export performance of the western Balkans. Montenegrin Journal of Economics, 12(2), 45–60. doi: 10.14254/1800-5845.2016/12-1/3
- Klimczak, L., & Trivić, J. (2015). The determinants of intra-regional trade in the Western Balkans. Proceedings of Rijeka School of Economics, 33(1), 37–66.
- Konopek, M. (2011). Trade and investment in regional trade agreements: The case of the Central European Free Trade Agreement (CEFTA) 2006. OECD Journal: General Papers, 2010/(2), 21–32. doi: 10.1787/gen_papers-2010-5kg9zc18tds5
- Landesmann, M., & Worz, J. (2006). The competitiveness of CEE in a global context. The Vienna Institute for International Economic Studies, Bank Austria Creditanstalt.
- Masahiko, Y. (2011). The South and Eastern European Economy as a periphery of the EU, and their cross border economic cooperation, Discussion Papers 1115, Graduate School of Economics, Kobe University.
- Munkacsi, Z. (2009). Export structure and export specialisation in Central and Eastern European countries, Magyar Nemzeti Bank. Occasional Papers, 81, 34–35.
- Mayer, J., & Wood, A. (2001). South Asia’s export structure in a comparative perspective. Oxford Development Studies, 29(1), 9–10. doi:10.1080/13600810120016173
- Natos, D., Staboulis, C., & Tsakiridou, E. (2014). Agricultural trade integration in Western Balkans: Orientation and complementarity, Agricultural Economics Review. Greek Association of Agricultural Economists, 15(2)pages, 1–15.
- Ninka, E., Pere, E. (2017). International trade in Western Balkan Countries: Analysis based on the gravity model, No. 126, wiiw Balkan Observatory Working Papers from The Vienna Institute for International Economic Studies (wiiw)
- Peshevski, M., Ameti, I., Vukaj, O., & Petkov, R. (2013). Trading of agricultural products from agro-complex between countries from Balkan Region, Economics of Agriculture. Institute of Agricultural Economics, 60(4), 1–9.
- Petreski, M. (2013). Southeastern European Trade Analysis: A Role for Endogenous CEFTA-2006?. Emerging Markets Finance and Trade, 49(5), 26–44. doi: 10.2753/REE1540-496X490502
- Petreski, M. (2018). Has CEFTA increased members’ mutual trade? Evidence with an enlarged set of plausibly exogenous instruments. Czech Journal of Economics and Finance, 68(3), 294–317.
- Ranilović, N. (2017). The effects of economic integration on Croatian merchandise trade: A gravity model study. Comparative Economic Studies, 59(3), 382–404. 2017, issue doi: 10.1057/s41294-017-0032-6
- Shimbov, B., Alguacil, M., & Suárez, C. (2013). Fragmentation and parts and components trade in the Western Balkan countries Post-Communist Economies, 25(3), 371–391.
- Shimbov, B., Alguacil, M., & Suárez, C. (2019). Export structure upgrading and economic growth in the Western Balkan Countries. Emerging Markets Finance and Trade, 55(10), 2185–2210. 2019, issue doi: 10.1080/1540496X.2018.1563538
- Sklias, P. (2011). The political economy of regional integration in the Western Balkans. International Journal of Business and Economic Sciences, 4(3), 21–37..
- Sklias, P., & Tsampra, M. (2013). Assessing regional integration and business potential in the Western Balkans. International Journal of Economics and Business Research, 6(1), 28–51. 2013, issue doi: 10.1504/IJEBR.2013.054840
- The Economist (2017). A western Balkans customs union: pie in the sky? The Economist, March 14th, 2017. Retrieved, November 3, 2019, from http://country.eiu.com/article.aspx?articleid=1675214751
- The United Nations Commodity Trade Statistics Database (COMTRADE). Retrieved November 2, 2019, from https://comtrade.un.org/data/.
- Toševska-Trpčevska, K., & Tevdovski, D. (2014). Measuring the effects of customs and administrative procedures on trade: Gravity model for south-eastern Europe. Croatian Economic Survey, 16(1), 109–127. doi: 10.15179/ces.16.1.4
- Trlaković, J., Despotović, D., & Ristić, L. (2018). Impact of technology-intensive exports on GDP of Western Balkan countries. Journal of Policy Modeling, 40(5), 1038–1049. doi: 10.1016/j.jpolmod.2018.01.006
- UNDP (2011). Export dependence and export concentration. In Towards Human Resilience: Sustaining MDG Progress in an Age of Economic Uncertainty (Chaper 1, pp. 18-52).
- World Bank (2017). Western Balkans: Regional Economic Integration Issues Notes. No. 2 Regional Trade Integration Achieving Economic Prosperity through Regional Trade Integration. The World Bank Group, pp. 1–98.
- World Bank (2018). Western Balkans regular economic report No.14: Higher but fragile growth, The World Bank Group.
- World Bank (2019). Serbia new growth agenda: Exporting to grow. World Bank Group., pp. 1–56.
Appendix
Table A1. The average trade growth rate 2007-18; total and to the rest of the WB (expressed in EUR).
Table A2. The Volume and Growth of WB6’s Total Trade and Trade with the EU28 2007-2018 (EUR million, %).
Table A3. Standard Grubel–Lloyd index of intra-industry trade of WB countries with EU28 in 2007 and 2018.
Table A4. Shares of (Medium- and) High-Tech products, High-skill and technology-intensive manufacture products, and Skill-intensive manufactures in WB exports 2007 and 2018.
Table A5. Shares of goods at higher levels of processing in WB merchandise export to the EU 28.
Table A6. Herfindahl-Hirschmann index for WB countries trade with EU 28 in 2007 and 2018.