
 ?Mathematical formulae have been encoded as MathML and are displayed in this HTML version using MathJax in order to improve their display. Uncheck the box to turn MathJax off. This feature requires Javascript. Click on a formula to zoom.
Abstract
Composite indicators are a remarkably useful tool in policy analysis and public communication for assessing phenomena, such as Knowledge-Based Economy (KBE), that cannot be expressed by means of a simple indicator. The objective of this study is to propose and compare three MCA-DEA models from a “Benefit of Doubt” (BoD) approach in order to build KBE Composite Indicators. To show the effectiveness of the models, this paper proposes a case study of 36 European countries to assess the degree of development of KBE. The results revealed differences with respect to the optimal weights assigned to the sub-indicators, the discriminating power, the operability, and the participatory nature of the models. Model 1 yielded high scores for every country and low discriminating power. Model 2 favored the most efficient countries in terms of KBE and allows for the incorporation of expert knowledge, thereby giving flexibility to the process. Model 3 made it possible to construct composite indicators from an optimal balance approach and yielded low results overall. These results demonstrate the necessity to analyze the different choices for measuring KBE in order to determine which indicator is more suitable for each context.
1. Introduction
Economic theory has exposed the importance of technology and knowledge in economic development and human welfare (Tchamyou, Citation2017; Dodgson & Gann, Citation2018). A historical analysis of the processes of transformation of the productive system allows us to identify the growing importance of the concept of “knowledge” as a driving force in development processes (Karahan, Citation2012). The concept of “Knowledge-Based Economy” (KBE) was initially introduced by Machlup (Citation1962) and made popular by Drucker (Citation1969). This concept is currently used to refer to productive systems whose basis is, precisely, knowledge (Chen & Dahlman, Citation2005). The Organization for Economic Cooperation and Development (OECD) described KBE as “the economies which are directly based on the production, distribution, and use of knowledge and information” (OECD, Citation1996:3). Indeed, knowledge has always been a driver of economic growth, but nowadays it has grown significantly. This idea is encapsulated in Foray and Lundwall (Citation1996: 27) as follows “Economy is more strongly and more directly rooted in the production, distribution and using of knowledge than ever before”. If we focus on companies, we can say that those whose activity is knowledge-intensive have a value-added multiplier and greater productivity, compared to those whose activity is less knowledge-intensive (Lee & Gibson, Citation2002).
Regarding the growing importance of knowledge in production systems, research on KBE has grown significantly in recent decades, including studies at the company and/or national level. Economists have revised long-term growth theories to accommodate the role of knowledge (Romer, Citation1994). However, it is complicated to quantify the concept of knowledge and, therefore, the description and measurement of KBE are conditioned by the construction of reliable indicators (Karahan, Citation2012), the data available, and their capacity to reflect a complex reality. This is not a minor issue, as the possibility of proposing objective approaches to the concept of knowledge, as well as to measurements of KBE, is essential to understand its dynamics and design more effective policies.
The first step towards measuring and monitoring the achievements of the KBE is to identify the conceptual framework and the aspects included in the measurement systems of KBE. The second step would be to define methodologies for the construction of composite indicators (CI) that are capable of adapting to different contexts and reflecting the many aspects of the phenomenon in question. Thus, creating CIs is a very useful solution for monitoring a complex problem, as they synthesize in a single piece of data the information contained in a number of variables about different aspects of a given issue (Guaita et al., Citation2020; Salinas et al., Citation2020). Therefore, their use is advisable when the complexity of the phenomenon makes it impossible to work with a single variable, as would be the case with KBE. There are several proposals designed to measure and monitor countries’ achievements as regards KBE. However, despite the importance of measuring these, the number of methodological proposals is very limited, and there is yet no analysis of how each of them can be adjusted to different contexts or concrete needs. This work focuses on this research gap. The aims of this project are, on the one hand, to propose new methodologies for the creation of KBE composite indicators and, on the other hand, to compare the differences between them in a specific context. The starting point is the idea that a single methodology for creating descriptive indicators of KBE cannot respond to the needs of different societies, or describe the particular aspects of a knowledge-based economy. In order to be able to offer a proposal, this paper provides a review of the main KBE frameworks and a description of the main measurement indicators. This will allow us to come up with new methodologies for creating indicators that complement the current ones, but which also conform to the generally accepted conceptual frameworks.
The proposals put forward in this study are based on Multi-Criteria Analysis (MCA) techniques, which are greatly suitable when working from a multidimensional approach. To achieve the objectives of this study, we propose and compare three MCA-DEA models that were developed following a “Benefit of Doubt” (BoD) approach, which will allow us to build KBE composite indicators. Model 1 is a basic BoD model. Model 2 is a BoD model with proportional sub-indicator share restrictions of a participatory nature. Model 3 is a common weighted DEA that uses a balanced analysis approach to aggregate simple indicators by means of a MINMAX Goal Programming method. To demonstrate the usefulness of the models, a case study including 36 European countries was carried out, taking as a reference the system of indicators proposed by the European Commission. This framework considers 27 indicators associated with innovation, grouped into ten sub-indexes: Human resources, Attractive research systems, Innovation-friendly environment, Finance and support, Firm investments, Innovators, Linkages, Intellectual assets, Employment impacts, and Sales impacts. The robustness of the models was confirmed by using a Spearman’s Rank correlation coefficient and compared with the Composite Innovation Indicators of the European Innovation Scoreboard.
2. Theoretical framework and main indicators proposed
When talking about KBE, reference is often made to a process of structural transformation at the national level, and so the focus of international organizations has been on developing indicators capable of describing the weight that knowledge has in their economies (Karahan, Citation2012). Carter (Citation1996) pointed out that measuring knowledge is not only a problem at the business level, but that the challenge extends to country-level measurement too. There is currently no widely accepted framework for measuring KBE, but there are several proposals from international organizations such as the Asia Pacific Economic Cooperation (APEC), the Organization for Economic Cooperation and Development (OECD), the World Bank (WB), and the European Union (EU). One of the main disadvantages of the above proposals and other alternatives is that, as Shapira et al. (Citation2006) puts it, they are conditioned by the fact that the indicators selected are those whose availability is ensured in all the countries involved in the analysis. Moreover, these indicators are conditioned by the quality of the statistical sources, something that in less developed countries can be a problem (Devarajan, Citation2013).
The World Bank’s (WB) proposal, known as Knowledge Assessment Methodology (KAM), born in 1999, states that KBE is based on four pillars: Education and Human Resources, Economic Incentive and Institutional Regime, Communication Technology, Innovation System and Information (World Bank Institute, Citation2007). The framework proposed by this organization takes into consideration 83 different variables that serve as proxies for the four pillars described above. These variables are grouped as follows: Economic Incentive and Institutional Regime Index (19), ICT Index (12), Overall Economic Performance (9), Innovation System Index (24), Education and Human Resources Index (19). Concerning the methodology for aggregating information, this institution has used two modes, the Knowledge-based Economy Index (KEI) and the Basic Scorecard, both of them included within the KAM. The former is calculated on the basis of 12 indicators. The result of this indicator provides a picture of the degree of development of a country or region in terms of KBE. The methodology on which it is based relies on the simple average of normalized values of the 12 indicators of the basic scorecard. Whereas the Basic Scorecard offers an overview of the performance of the country as concerns KBE by using 14 variables (). The KAM Basic Scorecard is a disaggregated representation of the KEI.
Table 1. Indicators included in the measurement of KBE by several international organizations.
The OECD issued another methodology for the analysis of KBE. This institution defined KBE in 1996 as “economies which are directly based on the production, distribution, and use of knowledge and information” (OECD, Citation1996: 20). Although the OECD proposed a direct measurement of KBE, there are several obstacles. For instance, it is difficult to set up intellectual capital accounts in a way that is comparable to accounts of conventional fixed capital. In short, knowledge is difficult to measure and value. In this sense, the proposals for indicators have been developed little by little, and have at least tried to reflect the rates of return in education and training (Leung, Citation2004). The first attempt at measurement proposed by the OECD emerged in 1999 (), from a body of 32 indicators grouped into 5 dimensions (OECD, Citation1999). This proposal grants special relevance to information and communication technologies, to science, and to technological activities, all of which are conditioned by the way in which these activities are globalized.
The European Commission has also developed a measurement methodology based on the European Innovation Scoreboard (EIS). The proposal is not too different from previous ones, including a set of selected indicators to measure the performance of KBE in Europe. This methodology focuses on innovation systems to identify indicators of KBE. Its scoreboard has been designed on the basis of the main drivers of KBE, and also includes measures related to the innovation outputs. As shown in , the proposed indicators are distributed in 5 categories that consider input and output measures. Parallel to this proposal, the European Commission publishes the Global Innovation Scoreboard, which offers a reduced version of the EIS based on 12 indicators.
The Asia Pacific Economic Cooperation (APEC) has also made a proposal for measuring KBE. The rationale behind this system was to create a framework that could serve as a guide for the effective use of knowledge among its member countries. This proposal includes 26 indicators, grouped into 4 dimensions () (APEC, 2001). It should be noted that in order to create the four dimensions of KBE, the APEC carried out an analysis of its main pillars. This analysis highlighted the importance of innovation and technological change, the improvement of human resources, the need for efficient communication infrastructures, and a business network that fosters innovation and the creation of companies.
The above methodologies represent groups of indicators that seek to measure or describe a complex reality such as KBE. The major challenge lies in how to aggregate these simple indicators to build composite indicators capable of measuring the same concept and analyzing how they interact with each other (Karahan, Citation2012), for if we merely build groups of indicators, we will only provide a very basic description (Leung, Citation2004).
3. The challenge of building a meaningful KEB indicator
The concept of composite indicators (CI) was introduced in a practical way in the 1990s as a procedure to synthesize information about a complex and multidimensional phenomenon (Sumner & Tezanos Vázquez, Citation2014). Many institutions have since created CIs to measure a wide range of phenomena. In fact, 160 composite indicators have been established and employed around the world (Foa & Tanner, Citation2012). The use of CIs takes on special relevance in the description of complex realities in which many variables are involved (Martín et al., Citation2017; Rodríguez et al., Citation2016). These indicators provide an overview of a group of partial indicators, thus avoiding comparison based on multiple individual data. The worth of these indicators lies in their capacity to synthesize information and provide a useful tool for decision-making (Cherchye et al., Citation2011). Aggregating information into a single variable allows for an easier interpretation of the phenomenon in question and, thus, makes it possible to capture the performance of regions or countries (Hudrliková, Citation2013). Such an approach is very useful for policymakers, academics, experts, journalists, etc., given that they can analyze a phenomenon with only one piece of data (Saltelli et al., Citation2006). The OECD (n.d.) Glossary defines CIs as: “A composite indicator is formed when individual indicators are compiled into a single index, on the basis of an underlying model of the multi-dimensional concept that is being measured”. However, these indicators raise a number of issues that should not be overlooked (Nardo et al., Citation2005). To some extent, their construction is conditioned by a degree of subjectivity, which may come to undermine their credibility (Booysen, Citation2002). This would also include the definition of the phenomenon at issue, which of the partial indicators should be included, how these should be aggregated, how inaccurate or poor quality data should be treated (Cherchye et al., Citation2011), how to avoid redundant information or how to establish the weights of partial indicators, or even their misinterpretation or simplicity (Zermeño et al., Citation2019).
On the more technical side, CIs are mathematical combinations of a set of multidimensional indicators (Nardo et al., Citation2005, Saisana et al., Citation2005), and normal measures that aggregate the information generated by a complex phenomenon. A basic condition of CIs is transparency in their construction; thus, allowing for discussion and replication on the part of stakeholders (Saisana et al., Citation2005). Partial indicators can be aggregated without being scaled by means of percentages or ratios, if all the variables are measured with the same unit (Talukder et al., Citation2017). In other cases, the indicators are expressed in different units (Salzman, Citation2003) or measurement techniques. When this occurs, it is necessary to apply a process of normalization, which consists of making partial indicators expressed in different units comparable on a common basis (Sajeva et al., Citation2005). During the process of normalization, measurement errors can be made and the indicator may lose quality (Hudrlíková & Kramulová, Citation2013). Therefore, this process must be carefully chosen, as different normalization techniques can yield different values (OECE, 2008) and therefore, lead to significant differences in the results of the CI (Cherchye et al., Citation2007; Tate, Citation2012).
The methodology for estimating the relative weights assigned to the partial indicators is one of the most delicate stages in the process of creating CIs (Hudrliková, Citation2013). One of the most widely used methods to construct composite indicators when the information about the weights is unknown is the Data Envelopment Analysis (DEA), developed using the Benefit of Doubt Approach (BoD). DEA is often applied to analyze the best practices or the efficiency level in the production or delivery of a service (Phucharoen & Sangkaew, Citation2020). The main disadvantage of this method is that without setting constraints the weight is given by an indicator in which the analysis unit is the best (Cherchye et al., Citation2009); therefore, cases displaying a good performance in a single indicator obtain a better position in the ranking of the global indicator. This methodology can be found explained in detail in Cherchye et al. (Citation2008). One of the most widespread methodologies is Linear Aggregation (LIN) since its calculation is very simple. However, this form of aggregation implies full compensability, and the poorer performance of one indicator can be balanced with higher values in others. In addition to the above, the OECD (Citation2008) has suggested additional ones such as geometric aggregation and the non-compensatory multi-criteria approach. The former benefits the higher-performing countries the most, so countries with poorer performance tend to prefer linear aggregation. Multi-Criteria Analysis (MCA) represents the non-compensatory approach. This methodology can lead to problems when there is a large number of criteria being analyzed (Munda and Nardo (Citation2009), although some solutions to this weakness have been proposed (Munda, Citation2010). An additional proposal is the Distance Method (DP2), which offers another form of aggregation of partial indicators (Pena, Citation1977). This methodology has some advantages related to key aspects in the process of building CIs. It assigns weights to partial indicators objectively, avoids duplicate information, and makes it possible to aggregate variables expressed in different units (Rodríguez et al., Citation2018; Rodríguez et al., Citation2018; Rodríguez et al., Citation2017; Martín et al., Citation2019; Guaita et al., Citation2019).
As discussed in the previous section, several alternative indicators have been proposed to measure the main dimensions, criteria, and sub-criteria representative of KBE. One of the key aspects, as mentioned above, lies in the assignment of weights to each of the partial indicators used. The criterion used for this purpose should take into account the context in which the indicator is applied, or even the existence of a specific goal that might condition the measurement of KBE (Freudenberg, Citation2003). Therefore, bearing in mind the primary objective of creating a representative CI of KBE, there are different proposals for constructing indicators, each of which is better suited to a particular context or objective. Under this premise, we offer below a proposal of alternative indicators that differ in the methodology with which they are created, but that share a common body of partial indicators. These indicators are those proposed by the European Commission.
4. Material and methods
4.1. Case study
The case study in this paper is based on 10 sub-indicators, made up of 27 indicators, as identified by the European Commission to measure KBE under the framework of the European Innovation Scoreboard (EIS) (EU, 2019). The EIS focuses mainly on innovation processes so as to define KBE indicators and has been designed to capture the main drivers of a knowledge-based economy plus some measures of innovation outputs (Karahan, Citation2012). The measurement framework of the EIS includes 4 dimensions, 10 sub-indicators, and 27 indicators, as shown in .
Table 2. Dimensions, sub-indicators, and indicators considered to the Knowledge Economy Composite Indicators.
Framework conditions compiles information on the main drivers of innovation performance external to the firm, related to human resources, research, and innovation opportunities. Investments includes investments made in both the private and public sectors. Innovation activities encompasses different issues related to the promotion of innovation in the business sector, to the collaboration and dissemination of this type of activity, and to the generation of intellectual assets. Finally, Impacts covers the effect on employment and the sales of firms’ innovation activities.
The EIS calculates the composite indicators (CIs) for each country using a Min-Max normalization method and an aggregation method based on unweighted averages. Besides, there is a reference year, which is usually the first one in the series. The MinMax method calculates re-scaled scores by first subtracting the Minimum score and then dividing by the difference between the Maximum and the Minimum score. The composite indicator is calculated as the unweighted average of the re-scaled scores of all indicators, in which all indicators have the same weight, i.e. 1/27. The sub-indicators used in this study correspond to the period 2011-2018, taking as a reference the value of the EU in 2011. For more details on methodological approaches to the calculation of sub-indicators, see EU (2019) and Hollanders and Janz (Citation2013).
Basically, the spirit of the EIS lies in the cross-country comparison of innovation indicators to identify the strengths in terms of KBE of member countries. In this regard, it is particularly important to pay attention to how sub-indicators are aggregated to calculate the final composite indicator, since, depending on the purpose of the indicator, one method may be more appropriate than another. There is not just one way of designing composite indicators; however, choosing one or another method may yield different results (Greco et al., Citation2019). In this study, we compare the performance of three MCA-DEA models so as to develop composite indicators on KBE. In order to do so, we took as a reference the 10 sub-indicators proposed by the EIS for the 36 European countries in 2018 (relative to EU 2011). The data concerning the original sub-indicators used in the case study are presented in .
Table 3. Original data of sub-indicators in 2018 relative to EU 2011, Composite Indicators for each country regarding model 1, model 2, model 3, and Unweighted average.
4.2. Methodology
The construction of CIs requires a multidimensional approach, which allows for the addition of different criteria in a structured manner. In this regard, Multi-Criteria Analysis (MCA) techniques are particularly appropriate (El Gibari et al., Citation2019). In this paper, we present three models that have been developed using a “Benefit of the Doubt” approach from Multi-Criteria Analysis to build composite indicators on Knowledge Economy. Model 1 is a basic BoD model. Model 2 is a BoD model with proportional sub-indicator share restrictions. Model 3 is a common weights DEA model using a Goal Programming (GP) technique.
The BoD approach has its origin in the Data Envelopment Analysis (DEA) in an environment of inaccurate information. The DEA methodology is a linear programming technique that evaluates a set of homogeneous productive units using both input and output variables in an uncertain environment, in which the weights associated with these variables are not known, nor is the form of the function that relates these variables. The very name “benefit of the doubt” captures the essence of this type of model and emphasizes its ability to obtain the most appropriate weighting scheme for each decision unit performance benchmarking from the data available for each unit of analysis (Cherchye et al., Citation2007). A great number of works have already successfully used this approach for the construction of composite indicators, such as those of Cherchye et al. (Citation2011), Mizobuchi (Citation2014), Karagiannis (Citation2017), or Verbunt and Rogge (Citation2018). The only difference with respect to traditional DEA models is that only the output variables are fixed, considering just one dummy input variable whose value equals 1 for each unit of analysis. The BoD model compares the performances of one country with the others, assigning higher weights to the first indicators and lower to the seconds. In doing so, the model chooses the most favorable set of weights for each unit of analysis.
Model 1 is a basic BoD model and its objective function is formulated as shown in Equationequation (1)(1)
(1) :
(1)
(1)
s.t.
(1a)
(1a)
(n constraints, one for each country j)
(1b)
(1b)
(m constraints, one for each indicator i)
Where and i = 1,2,…….,m, wc,i represents the weight of country c in relation to sub-indicator i. Ic,i represents el sub-indicator i associated with country c. And Ij,i represents sub-indicator i for any country j.
Model 2 is a variation of model 1 but which includes proportional sub-indicator share restrictions. Such restrictions were introduced by Wong and Beasley (Citation1990) to make it easier for experts to quantify their opinion in terms of percentage values.
The objective function of model 2 is as follows:
(2)
(2)
s.t.
(2a)
(2a)
(2b)
(2b)
(2c)
(2c)
Where and i = 1,2,…….,m, wc,j represent the weight of country c in relation to sub-indicator i. Ic,i represents sub-indicator i associated with country c. Ij,i represents sub-indicator i for each country j, and
and
represent the respective lower and upper limits of the contribution of sub-indicator i for each country j with respect to the total of sub-indicators.
Model 3 uses a different approach to determine the CIs for each country, the MinMax Goal Programming (GP) approach. GP is based on a satisfying or non-optimizing rationale, where the decision-making authority tries to bring a number of relevant goals as close as possible to pre-set levels of aspiration (Jones & Romero, Citation2019).
This model seeks to minimize the maximum deviation, in terms of efficiency, among the possible deviations of all the analysis units.
This model is based on Hatefi and Torabi (Citation2010) and is formulated according to equation (3):
(3)
(3)
s.t.
(3a)
(3a)
(3b)
(3b)
(3c)
(3c)
(3d)
(3d)
Where and i = 1,2,…….,m, wi represents the common weight assigned to sub-indicator i for each country. Iji represents sub-indicator i associated with country j. dj represents deviation for country j, and D represents the largest possible deviation.
The composite indicator calculated for each country is determined by the difference 1-
5. Results and discussion
The results of the CIs obtained from the application of each of the three models are shown in . In addition, we provide the results of the CIs using the unweighted average as an aggregation method, which is the aggregation method proposed by the EIS. The main differences between the three models are determined by 1) the weights assigned to the sub-indicators, 2) the simplicity of use, 3) the discriminatory power and 4) the participatory nature.
shows a comparison between the values of the CIs obtained from the application of the three models to each country. As can be seen, model 1 yields higher values for all countries than the rest of the models since it assigns weights to each of the sub-indicators, which provide an optimal overall score in the case of each country. This is a fairly adaptable model when selecting optimal weights, as it only has to meet two restrictions: restriction (1a), which standardizes the weights, and restriction (1 b), which indicates that the CI is an increasing function of the sub-indicators, so an improvement in one of the sub-indicators will always result in an improvement in the final CI score. Applying model 1 is appropriate in those cases where there is no agreement on the weights assigned to each indicator or sub-indicator. This model assigns the best scores (CI = 1,0000) to Denmark, Germany, Ireland, Luxembourg, Malta, Netherlands, Austria, Finland, Sweden, United Kingdom, Israel, Norway, and Switzerland. The main advantage of this method is that it is generally accepted by the parties being assessed (Bas Cerdá, Citation2014).
Figure 1. Comparative Composite Indicators for each country regarding model 1, model 2 and model 3. Source: The authors.
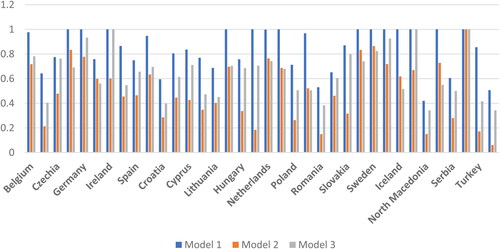
When constructing the CI, model 2 provides higher values to countries that excel at everything. The main advantage of this model is that it takes into account some constraints on the relative contributions of the dimensions analyzed, according to expert opinions. Notice how some countries that had reached the highest score according to model 1, have obtained a much lower score according to model 2. For example, Malta obtained a CI = 1,0000 according to model 1, but according to model 2, it obtained a CI = 0,1838. This huge difference in the overall value of the indicator is due to the fact that, although there are some sub-indicators with high values, such as IFE (217.0) or IA (169.7), there are other sub-indicators with very low values, such as FS (5.2). These “bad” sub-indicators greatly penalize the value of the CI. Something similar happens with Ireland, Luxembourg, Austria, or Bulgaria.
Model 3 yields a more balanced result, although it is overall lower. This model gives priority to obtaining the “least bad” result and, therefore, the overall value is much more balanced for all the countries, i.e. the score is split between all of them. Thus, it can be seen that some countries with low sub-indicators have obtained a higher relative score according to this model, even above model 1 and, of course, model 2. Clear examples of this are Czechia, Slovenia, or Slovakia.
With regard to simplicity of use, models 1 and 2 required replication of the model for each decision unit, in this case, for each country. As a result, each model had to be replicated 36 times. One of the main limitations of these two models is that they allow for null values to be assigned to the weights associated with some sub-indicators in the calculation of the CI. This may be an undesirable circumstance for the analyst when, for example, one wishes to include every sub-indicator in the CI. On the other hand, model 2 can sometimes provide inconsistent results, derived from a lack of compliance with restriction (2 b). When this occurs, it is necessary to use some kind of approximation. In this case study, the limits used to delimit the contribution of each indicator with respect to the CI were 0.1 and
0.7. When dimensions such as these are imposed, inconsistencies can sometimes arise. For example, it may well be that a sub-indicator has a value of zero or a significantly lower value than the rest of the indicators for a country. In such a case, it is necessary to incorporate an additional restriction that assigns the value zero to the weight associated with that specific indicator. In our case study, this approximation had to be applied to the ARS indicators in Germany, IA in Greece, I in Romania, and SI in Norway. Although the range of acceptance is quite broad, the results of the CIs have shown significant differences. Although model 3 uses a linear programming technique like the other two models, it only requires a replica, as it uses common weights for all countries, so its application is much simpler. This model has provided similar results in terms of performance as other models based on the DEA approach and in other contexts (Hatefi & Torabi, Citation2010).
With respect to discriminating power, the worst model was model 1, which obtained 13 ties. As such, it may be difficult to prioritize countries on the basis of these criteria and, therefore, to develop rankings. Model 3 obtained 4 ties for the best positions. Model 2 has been the most discriminating and has not resulted in any tie. It is also to be expected that the narrower the interval between the greater the discriminating power of the model.
With regard to the possibility of incorporating experts’ opinions or defining, usually minimal, thresholds for the different sub-indicators, the only valid model is model 2. This model is the most appropriate for constructing CIs with a minimum degree of quality, which can clearly point at the countries that excel at everything. Additionally, it is also advisable when experts’ opinions must be taken into consideration.
The unweighted average aggregation method is the easiest to apply, as it only uses a sum weighted by 1/ where
is the number of countries considered in the analysis for obtaining the CI. However, it is the least accurate method, as it does not identify optimal sub-indicators, but rather distributes the values of all sub-indicators equally regardless of their efficiency. With respect to discriminating power, this aggregation method did not obtain any tie, so it is adequate if a ranking is desired, regardless of the efficiency of the sub-indicators with respect to the CI. Although this system of aggregation per se does not consider participation, merely by transforming it into a system of weighted averages, it would already allow for the incorporation of weights specifically defined by decision-makers.
In order to choose the most appropriate model, the analyst must take into account all these scenarios and must consider that different aggregation methods will yield different results (De Castro-Pardo et al., Citation2020).
An analysis of the ranking of countries with respect to the results of the CIs () shows that, although the best position (highlighted in bold) and the worst positions (highlighted in italics) are the same for all models, the middle positions of the ranking vary. The most important deviations have been found in the CIs provided by model 3. This is so because the aim of this model is not to find an optimal one, but to find solutions that are as good as possible. For this reason, the results are more balanced and, therefore, the positions in the ranking vary to a larger extent. Denmark, Luxembourg, Austria or Norway are examples of countries that have obtained very good positions with model 1, while with model 3, their position in the ranking has significantly dropped. At the same time, model 2 has placed the countries with the best scoring sub-indicators in the top positions, i.e. the most efficient in everything. This is the case of Switzerland, Sweden, and Denmark. The ranking put forward by model 1 is the closest to that given by the unweighted average aggregation method. Both the average and standard deviation of the distances between the two rankings are lower than in the other two cases. On the other hand, model 2 shows the most significant differences with respect to the ranking provided by the unweighted average. This is due to the fact that model 2 gives more importance to the countries that scored higher on all sub-indicators, rather than distributing the weights equally.
Table 4. Ranking of countries regarding model 1, model 2, model 3 and unweighted average.
The Spearman’s Rank correlation test was carried out to validate the proposed models. At the same time, the CIs provided by the three models were compared with the model used by the EIS. The test indicates whether or not there is a positive correlation between the two sets of indicators calculated by using each one of the three models proposed by the EIS’ CIs. So the null and alternative hypotheses were put forward as and
so, for model 1:
H0: There is no correlation between the CIs obtained by model 1 and the CIs obtained by EIS.
H1: There is a positive correlation between the CIs obtained by model 1 and the CIs obtained by EIS.
Equally, we put forward both the null and the alternative hypotheses to validate models 2 and 3 by comparing them with the EIS’ CIs.
The Spearman’s Rank correlation coefficient scored 0.869 for model 1, 0.957 for model 2, and 0.733 for model 3. In addition, the p-value of the test was 0 for all three models, so H0 is rejected with a significance of 0.01. On the other hand, there is a high positive correlation between the CIs related to the three models proposed here and the EIS’ CIs. These results show the robustness of the models and their appropriateness for building Knowledge Economy Composite Indicators.
6. Conclusions
Composite indicators are quite useful for evaluating phenomena, as is Knowledge-Based Economy, that cannot be encapsulated in a single simple indicator. However, the way in which indicators and sub-indicators are aggregated to calculate a CI must be considered in terms of the analyst’s objectives, the purpose of the CI, and the context and resources available. The BoD approach can be very useful for building CIs, as it allows for an adaptive and optimal weighting of indicators in a multidimensional environment.
The three models proposed are robust and allow for the construction of valid CIs; however, they can bring about changes in the intermediate positions of the ranking. In order to select the most appropriate model for each situation, the analyst must decide which characteristics he or she prefers to prioritize for the calculation of the global assessment. The basic BoD model is generally accepted by all those being evaluated. For this reason, it may be recommended in contexts of weak consensus or conflict, since the scores of all the countries are usually higher and the best positions of the ranking are more equally distributed. The BoD model with proportional sub-indicator share restrictions is recommended for more demanding evaluations, which require better-defined rankings, in which it is possible to pinpoint the countries that excel at everything. In addition, it facilitates a participatory approach, which allows for the incorporation of stakeholders’ opinions.
The GP model provides balanced results and may be recommended when indicators favoring weaker countries are desired. In addition, its application is very simple, which makes it suitable when resources are limited. In the case study presented, all models provided the best position in terms of innovation to Switzerland. Whereas Romania, North Macedonia, and Ukraine held the worst positions in all cases. It would be interesting to apply these methodologies to different groups of countries, in order to see how they perform in different areas. Such would be the case of comparing countries with very different levels of development or, on the contrary, comparing countries with very homogeneous characteristics. This task, in addition to the above, could be taken as a basis for developing research aimed at monitoring KBE when applying different public policies or business undertakings. In the authors’ opinion, this would be the natural evolution of the research proposed here. As a public policy recommendation, we recommend that alternative systems for measuring KBE, such as those proposed, be taken into consideration. In so doing, it will be possible to compare the results with more traditional ones, allowing for a wider range of information to support decision-making.
Disclosure statement
No potential conflict of interest was reported by the author(s).
References
- APEC. (2000). Towards Knowledge-Based Economies in APEC. APEC Economic Committee.
- Bas Cerdá, M. C. (2014). Estrategias metodológicas para la construcción de indicadores compuestos en la gestión universitaria [Doctoral dissertation]. Editorial Universitat Politècnica de València.
- Booysen, F. (2002). An overview and evaluation of composite indices of development. Social Indicators Research, 59(2), 115–151. https://doi.org/https://doi.org/10.1023/A:1016275505152
- Carter, A. P. (1996). Measuring the performance of a knowledge based economy. In D. Foray, & B.A. Lundvall (Eds). Employment and growth in the knowledge based economy (pp. 61–68). Organisation for Economic Cooperation and Development.
- Chen, H., Dahlman, C. (2005). The knowledge economy, the KAM methodology, and world bank operations. World Bank Institute Working Paper 37256. The World Bank, Washington D.C.
- Cherchye, L., Moesen, W., Rogge, N., Van Puyenbroeck, T. (2009). Constructing a Knowledge Economy Composite Indicator with Imprecise Data. CES KU Leuven Discussion Paper Series 09.15.
- Cherchye, L., Moesen, W., Rogge, N., & Van Puyenbroeck, T. (2007). An introduction to ‘benefit of the doubt’ composite indicators. Social Indicators Research, 82(1), 111–145. https://doi.org/https://doi.org/10.1007/s11205-006-9029-7
- Cherchye, L., Moesen, W., Rogge, N., & Van Puyenbroeck, T. (2011). Constructing composite indicators with imprecise data: A proposal. Expert Systems with Applications, 38(9), 10940–10949. https://doi.org/https://doi.org/10.1016/j.eswa.2011.02.136
- Cherchye, L., Moesen, W., Rogge, N., Van Puyenbroeck, T., Saisana, M., Saltelli, A., Liska, R., & Tarantola, S. (2008). Creating composite indicators with DEA and robustness analysis: The case of the technology achievement index. Journal of the Operational Research Society , 59(2), 239–251. https://doi.org/https://doi.org/10.1057/palgrave.jors.2602445
- De Castro-Pardo, M., Fernández-Martínez, P., Guaita Martínez, J. M., & Martin Martin, J. M. (2020). Modelling natural capital: A proposal for a mixed multi-criteria approach to assign management priorities to ecosystem services. Contemporary Economics, 14(1), 22–37.
- Devarajan, S. (2013). Africa’s statistical tragedy. Review of Income and Wealth, 59(1), S9–S15. https://doi.org/https://doi.org/10.1111/roiw.12013
- Dodgson, M., & Gann, D. (2018). Innovation: A Very Short Introduction (2nd ed.). Oxford University Press.
- Drucker, P. (1969). The age of discontinuity. Harper Business.
- El Gibari, S., Gómez, T., & Ruiz, F. (2019). Building composite indicators using multicriteria methods: a review. Journal of Business Economics, 89(1), 1–24. https://doi.org/https://doi.org/10.1007/s11573-018-0902-z
- European Commission (2010). European Innovation Scoreboard.
- European Commission (2019). European Innovation Scoreboard. Methodology Report. https://ec.europa.eu/growth/industry/policy/innovation/scoreboards_en.
- Foa, R., & Tanner, J. (2012). Methodology of the Indices of Social Development; ISD Working Paper Series, No. 2012-04; Indices of Social Development, 2012; https://repub.eur.nl/pub/50510/.
- Foray, D., & Lundwall, B.-A. (1996). Knowledge-based Economy: From the Economics of Knowledge to the Learning Economy. Introduction to OECD-publication on The Knowledge-Based Economy. OECD: Paris, France.
- Freudenberg, M. (2003). Composite indicators of country performance: A critical assessment. STI Working Paper 2003/16, OECD Paris.
- Greco, S., Ishizaka, A., Tasiou, M., & Torrisi, G. (2019). On the methodological framework of composite indices: A review of the issues of weighting, aggregation, and robustness. Social Indicators Research, 141(1), 61–94. https://doi.org/https://doi.org/10.1007/s11205-017-1832-9
- Guaita, J. M., Martín, J. M., Salinas, J. A., & Mogorrón-Guerrero, H. (2019). An analysis of the stability of rural tourism as a desired condition for sustainable tourism. Journal of Business Research, 100, 165–174.
- Guaita, J. M., Martín, J. M., & Salinas, J. A. (2020). Innovation in the Measurement of Tourism Competitiveness. Analyzing the Relationship Between Innovation, Value Creation, and Entrepreneurship (pp. 268–288). Ed. IGI Global.
- Hatefi, S. M., & Torabi, S. A. (2010). A common weight MCDA–DEA approach to construct composite indicators. Ecological Economics, 70(1), 114–120. https://doi.org/https://doi.org/10.1016/j.ecolecon.2010.08.014
- Hollanders, H., & Janz, N. (2013). Scoreboards and indicator reports. In Handbook of innovation indicators and measurement. Edward Elgar Publishing.
- Hudrliková, L. (2013). Composite Indicators as a Useful Tool for International Comparison: The Europe 2020 Example. Prague Economic Papers, 22(4), 459–473. https://doi.org/https://doi.org/10.18267/j.pep.462
- Hudrlíková, L., & Kramulová, J. (2013). Do transformation methods matter? The case of sustainability indicators in Czech regions. Adv. Methodol. Stat, 10, 31–48.
- Jones, D., & Romero, C. (2019). Advances and new orientations in goal programming. In New Perspectives in Multiple Criteria Decision Making (pp. 231–246). Springer.
- Karagiannis, G. (2017). On aggregate composite indicators. Journal of the Operational Research Society, 68(7), 741–746. https://doi.org/https://doi.org/10.1057/jors.2015.81
- Karahan, Ö. (2012). Input - Output Indicators of Knowledge-Based Economy and Turkey. Journal of Business, Economics & Finance, 1(2), 21–36.
- Lee, K. S., & Gibson, D. V. (2002). Towards Knowledge-based Economy in Korea: Metrics and Policy. International Journal of Technology, Policy and Management, 2(3), 301. https://doi.org/https://doi.org/10.1504/IJTPM.2002.001771
- Leung, K. C. (2004). Statistics to Measure the Knowledge-based Economy: The Case of Hong Kong. Asia Pacific Technical Meeting on Information and Communication Technology Statistics. 30 November 2004
- Machlup, F. (1962). The production and distribution of knowledge in the United States. Princeton University Press.
- Martín, J. M., Salinas, J. A., Rodríguez, J. A., & Jiménez, J. D. (2017). Assessment of the tourism’s potential as a sustainable development instrument in terms of annual stability: Application to Spanish rural destinations in process of consolidation. Sustainability, 9(10), 1692.
- Martín, J. M., Salinas, J. A., Rodríguez, J. A., & Ostos, M. S. (2019). Analysis of Tourism Seasonality as a Factor Limiting the Sustainable Development of Rural Areas. Journal of Hospitality & Tourism Research, 44(1), 45–75.
- Mizobuchi, H. (2014). Measuring world better life frontier: a composite indicator for OECD better life index. Social Indicators Research, 118(3), 987–1007. https://doi.org/https://doi.org/10.1007/s11205-013-0457-x
- Munda, G. (2010). Social Multi-Criteria Evaluation for a Sustainable Economy. Springer.
- Munda, G., & Nardo, M. (2009). Noncompensatory/Nonlinear Composite Indicators for Ranking Countries: A Defensible Setting. Applied Economics, 41(12), 1513–1523. https://doi.org/https://doi.org/10.1080/00036840601019364
- Nardo, M., Saisana, M., Saltelli, A., & Tarantola, S. (2005). Tools for Composite Indicators Building. Joint Research Centre.
- OCED. (n.d.). Glossary http://stats.oecd.org/glossary/detail.asp?ID=6278
- OECD (1996). The Knowledge-based Economy. OECD/STI Outlook.
- OECD (1999). The Knowledge-Based Economy: A Set of Facts and Figures. OECD.
- OECD (2008). Handbook on Constructing Composite Indicators. Methodology and User Guide. OECD.
- Pena, J. B. (1977). Problemas de medición del bienestar y conceptos afines. Instituto Nacional de Estadística (INE).
- Phucharoen, C., & Sangkaew, N. (2020). Does firm efficiency matter in the hospitality industry? An empirical examination of foreign demand for accommodation and hotel efficiency in Thailand. Journal of Tourism Analysis: Revista de Análisis Turístico, 27(1), 62–80. https://doi.org/https://doi.org/10.1108/JTA-08-2019-0034
- Rodríguez, J. A., Jiménez, J. A., Salianas, J. A., & Martín, J. M. (2016). Millennium Development Goals 4 and 5: Progress in the Least Developed Countries of Asia. Social Indicators Research, 129, 489–504.
- Rodríguez, J. A., Jiménez, J. D., Martín, J. M. M., & Salinas, J. A. (2018). Crisis in the Horn of Africa: Measurement of Progress Towards Millennium Development Goals. Social Indicators Research, 135(2), 499–514. https://doi.org/https://doi.org/10.1007/s11205-016-1491-2
- Rodríguez, J. A., Martín, J. A., & Jiménez, J. D. (2018). A Synthetic Indicator of Progress Towards the Millennium Development Goals 2, 3 and 4 in the Least Developed Countries (LDCs) of Asia. Applied Research in Quality of Life, 13(1), 1–19. https://doi.org/https://doi.org/10.1007/s11482-017-9503-1
- Rodríguez, J. A., Martín, J. A., & Salinas, J. A. (2017). Assessing MDG 6 in Sub-Saharan Africa: A territorial analysis using a synthetic indicator. Revista de Economía Mundial, 47(47), 203–221. https://doi.org/https://doi.org/10.33776/rem.v0i47.3873
- Romer, P. (1994). The Origin of Endogenous Growth. Journal of Economic Perspectives, 8(1), 3–22. https://doi.org/https://doi.org/10.1257/jep.8.1.3
- Saisana, M., Tarantola, S., Schulze, N., Cherchye, L., Moesen, W., Van Puyenbroeck, T. State-of-the-Art Report on Composite Indicators for the Knowledge-Based Economy. Work-Package 5. (2005). Available online: https://www.uni-trier.de/fileadmin/fb4/projekte/SurveyStatisticsNet/KEI-WP5-D5.1.pdf (accessed on 15 August 2016).
- Sajeva, M., Gatelli, D., Tarantola, S., & Hollanders, H. (2005). Methodology Report on European Innovation Scoreboard. 2005. European Commission.
- Salinas, J. M., Serdeira, P., Martín, J. M., & Rodríguez, J. A. (2020). Determinants of tourism destination competitiveness in the countries most visited by international tourists: Proposal of a synthetic index. Tourism Management Perspectives, 33, 100582.
- Saltelli, A., Munda, G., & Nardo, M. (2006). From Complexity to Multi-dimensionality: the Role of Composite Indicators for Advocacy of EU Reform. Tijdchrift vor Economie en Management, 3.
- Salzman, J. (2003). Methodological Choices Encountered in the Construction of Composite Indices of Economic and Social Well-Being. Ottawa.
- Shapira, P., Youtie, J., Yogeesvaran, K., & Jaafar, Z. (2006). Knowledge economy measurement: Methods, results and insights from the Malaysian Knowledge Content Study. Research Policy, 35(10), 1522–1537. https://doi.org/https://doi.org/10.1016/j.respol.2006.09.015
- Sumner, A., & Tezanos Vázquez, S. (2014). How Has the Developing World Changed Since the Late 1990s?. A Dynamic and Multidimensional Taxonomy of Developing Countries; Working Paper 375. Center for Global Development.
- Talukder, B., Hipel, K. W., & van Loon, G. W. (2017). Developing Composite Indicators for Agricultural Sustainability Assessment: Effect of Normalization and Aggregation Techniques. Resources, 6(4), 66. https://doi.org/https://doi.org/10.3390/resources6040066
- Tate, E. (2012). Social vulnerability indices: A comparative assessment using uncertainty and sensitivity analysis. Natural Hazards, 63(2), 325–347. https://doi.org/https://doi.org/10.1007/s11069-012-0152-2
- Tchamyou, V. S. (2017). The Role of Knowledge Economy in African Business. Journal of the Knowledge Economy, 8(4), 1189–1228. https://doi.org/https://doi.org/10.1007/s13132-016-0417-1
- Verbunt, P., & Rogge, N. (2018). Geometric composite indicators with compromise Benefit-of-the-Doubt weights. European Journal of Operational Research, 264(1), 388–401. https://doi.org/https://doi.org/10.1016/j.ejor.2017.06.061
- Wong, Y. H., & Beasley, J. E. (1990). Restricting weight flexibility in data envelopment analysis. The Journal of the Operational Research Society, 41(9), 829–835. https://doi.org/https://doi.org/10.2307/2583498
- World Bank Database. (n.d.). The Knowledge Assessment Methodology (KAM), website (www.worldbank.org/kam)
- World Bank Institute (2007). Measuring Knowledge in the World’s Economies. Knowledge for Development Program.
- Zermeño, K. A., Añaños, K. G., Martín, J. M., Salinas, J. A., & Rodríguez, J. A. (2019). Human rights in the Horn of Africa: an index of child and maternal health. Gaceta Sanitaria, 34(2), 186–188.