
 ?Mathematical formulae have been encoded as MathML and are displayed in this HTML version using MathJax in order to improve their display. Uncheck the box to turn MathJax off. This feature requires Javascript. Click on a formula to zoom.
Abstract
The present article aims to analyse wage-labour productivity causalities in Croatia and Slovenia using cointegration methods based on monthly time series data of variables for labour productivity and real gross wages in tourism industry during the period December 1999–January 2020. The data vector is integrated by chain indices with the constant base January 2000 = 100. A stochastic trend and shocks are covered in the analysis. Shocks are linked to the European Union accession, and economic crisis following with overwhelmed tourist arrivals. The contribution of the research is two-fold. First, the equations for at most normal distributed variables of labour productivity and real wages in tourism are exposed. Three spatial cointegration relations confirm labour productivity integrity of the regional tourism market. Second, pair-wise causalities indicate one cointegrated vector for labour productivity, which drives real gross wages in tourism sub-industries. These results suggest that for a higher non-seasonal assessment of real gross wage, the labour productivity should rise, i.e. less workers, more robotization or more tourist arrivals with better quality solutions. These findings are at most important to be implemented after the COVID-19 infection crisis with expected restructurings and digital transformation in the tourism industry.
1. Introduction
Tourism is a key sector with its deterministic influences on national economies in almost all Adriatic countries. Therefore, tourism and service sectors should seek for a better understanding on macroeconomic relevant issues, for example on labour productivity and real gross wage, rather than zigzag microeconomic “hair in the egg” findings. In tourism, there is a specific need to understand that macroeconomic environment can have an important external influence on each company as seen in March 2020 hereafter. This applies not only for tourism, but on all spatial and borderless (export) services. Provenzano and Baggio (Citation2019) proposed simple methodological step(s) in quantitative analysis of tourism and hospitality industry, while Juselius and Drehmann (Citation2020) warn of data puzzles. For example, based on macroeconomic data Gričar (Citation2019) predicts decline in tourism industry for the hot spot tourism destination, i.e. Slovenia (Warren, Citation2019). The decline in 2020s is predicted on a grade of 20% and is silenced to a prediction of UN World Tourism Organisation (Citation2020).
Successful and efficient analysis of tourism, one of the leading economic sectors in exports and employment, requires specific and adequate quantitative methods in modelling and forecasting of the future trends and key market determinants. In this paper applied comparative analysis between Croatia and Slovenia is motivated by the lack of adequate empirical analyses in the field of tourism industry. The service economy represents more than 60% of total gross domestic product (GDP) in both Croatia and in Slovenia, respectively. Both countries are known by the increasing role of tourism in the national economy. In 2017, the Slovenian tourism contributed 5.3% of total GDP (SORS, Citation2020), whereas in Croatia, one of the leading tourist destinations, the tourism sector is even more important in the structure of the national economy as it counts 19.6% of total GDP (Gulić, Citation2018).
These two neighbouring countries shared a common history in 20th century and become independent from the Yugoslav federation in 1991. Both countries have made its own economic path and growth (Gričar et al., Citation2019). They are positioned at the Adriatic Sea and are members of the European Union (EU). Contrarily to Croatia, which is expected to enter into the European Exchange Rate Mechanism II, Slovenia adopted euro as a national currency in 2007 as a first post-socialistic country. In 2018, Croatia attracted 16.6 million of international tourist arrivals, while Slovenia had 4.4 million of international tourist arrivals (World Bank, Citation2020). The article closes the gap in literature regarding comparisons of real gross wage and labour productivity in tourism industry in Croatia and Slovenia. More specifically, the paper aims to answer whether there are similarities and differences between the two countries in tourism labour productivity and real gross wage. To do so, we conduct cointegration tests on time series data for labour productivity and real gross wage in the tourism sub-industry (accommodation and food and beverage services). The first aim is to analyse previous empirical researches on the causalities between real gross wage and labour productivity. The second aim is to develop empirical models for Croatia and Slovenia on real gross wage and labour productivity using secondary time series data.
The next section provides brief literature review. In the third section the data vector and methodology are explicated. Empirical results are presented in the fourth section followed by the discussion in the fifth section. Contemporary research is concluded by implications, restrictions and conclusion sections.
2. Literature review
Gričar and Bojnec (Citation2019) recognised that the perception of the security of stable prices for customers could play more important role than prices alone, because it implies that price stability determines hotel competitiveness. Gross wage could be an important element of the price, as well as for causality between gross wage and labour productivity. The problem of how to ensure the growth of labour productivity in tourism is especially relevant in developing economies (Dua & Garg, Citation2019; Silva & Guimarães, Citation2017; Stundziene & Saboniene, Citation2019).
There are rare studies concerning spatial labour market activities in neighbouring Central European countries (CEC). While labour productivity has been widely studied for manufacturing activities, this has been largely neglected for service activities, including for the tourism sector (Sunanda & Dinabandhu, Citation2019; Yildirim, Citation2015). Such studies can contribute to better understanding the drivers of gross wage formation and links between gross wage and labour productivity (Assaf & Tsionas, Citation2018; Chatzimichael & Liasidou, Citation2019; Kim & Jang, Citation2019; Liu & Wu, Citation2019; Pham, Citation2020; Walmsley et al., Citation2019).
Even scarcer are studies concerning Croatia and Slovenia regarding causalities between real gross wage and labour productivity in tourism industry. In the past, Weinschenck (Citation1979) found development problems of labour-managed market economies with ‘mixed’ structures consisting of large labour-managed firms. There is only one study on tourism productivity in two neighbouring Adriatic countries using panel data (Tkalec & Vizek, Citation2016), but not for applied unit root tests in a time series. Ilić and Petrevska (Citation2018) discuss statistical methods for measuring efficiency in the Slovenian and Croatian tourism sector, whereas Žigo et al. (Citation2017) discuss questions on immigrant workers in Slovenia using interviews as a method.
The results in previous studies confirmed some similarity in patterns of development of wages and labour productivity levels. Bojnec (Citation2003) argued that wages in Slovenia were higher than in other transition post-communist countries and higher than labour productivity. Labour productivity and competitive pressures in firms' output markets were not found important for wage formation. Moreover, Bojnec (Citation2004) reported that the increase in labour productivity only partly explains real wage increases in Slovenia, suggesting an important role of other, unexplained factors in wage formation.
Kump and Novokmet (Citation2018) analyse income inequality in Croatia and Slovenia based on long term time series, not only from Yugoslav long history (1918–1991), but also from the earlier period from 1898 to 1918 within the Austro-Hungarian Monarchy. They argue that substantial importance of the state ownership of the corporate sector in Slovenia and foreign and state ownership in Croatia have made the concentration of private capital income less pronounced on the top of the income distribution. They show new inequality series for Croatia and Slovenia as a contribution to assessing the importance of policies and institutions in shaping inequality. The ownership structures emerging from the various privatization programmes in Slovenia have not led to a higher performance of growing sustainability (Lahovnik, Citation2019).
Kotarski and Petak (Citation2019) claim that the political economy of Croatia’s transition represents the case of partial reform equilibrium where winners represent the biggest threat to successful long-term transition. In addition, comparative political economy analysis of five key areas (product market competition, collective bargaining, financial sector, social protection and education) shows that Croatia developed a typical variation of capitalism, which is in its attributes closer to South European capitalisms than to capitalisms prevalent in CEC EU member states.
Grulja et al. (Citation2013) show that Croatia and Slovenia differ not only in level of average gross wage, but also in the overall taxation of wages. In 2018 Slovenia recorded 87% of the EU average GDP per capita in purchasing power standards (PPS), while in Croatia it was only 63% (Eurostat, Citation2020). Those countries are also part of the Alps-Adriatic working community and the difference in this region on gross wages are considerable. In 2010 the average gross wage in Slovenia was slightly more taxed than in Croatia: the overall tax wedge in former represented around 42% of labour costs and 40.6% in the latter (Grulja et al., Citation2013).
The Croatian and Slovenian economies have faced complex and interrelated political and economic problems with delays in improvements of labour market conditions. Gligorov et al. (Citation2008) argued that lower rise in GDP in the Western Balkan is not transmitted to causality between wage and labour productivity. The main reasons are structural: low export capacity, skill mismatches, and problems with competition in the product markets. Except for wages in the public sector, wages were not found to grow faster than labour productivity.
Kersan-Škabić (Citation2015) conducted research on macroeconomic data using panel method including labour productivity for new EU member states. It was recognised that in the pre-crisis period labour costs rose faster than labour productivity, while that was not the case in the EU-28 average. In the period 2010–2014 most of the countries experienced growth rates of labour productivity, but significantly slower than in the pre-crisis period.
The Adriatic region, where both countries belong, has a substantial deficit of scientific research. One of the reasons is shortcoming of the available secondary data in a long term. summarises the previous empirical researches on labour productivity and wages in general and especially in the tourism sector.
Table 1. Overview of recent previous empirical researches on wage-labour productivity.
The size of the informal sector activities, irrespective of the method used indicates a considerable share of the unofficial or shadow economy (Nastav & Bojnec, Citation2007). Arandarenko and Vukojevic (Citation2008) stated that formality and informality do not appear as binary choice, but rather along a spectrum of statuses, from full informality through semi-formality (tourism industry with sharing services, self-employment, double payrolls in many small private firms), to full formality most typically in the public sector. The availability of secondary data can represent limitations for research (Badshah & Bulut, Citation2020; Dogru & Bulut, Citation2018; Gulić, Citation2018; Hall, Citation2002; Yalçinkaya et al., Citation2018). Finally, quality in tourism services cannot be measured merely by the number of stars, or by investment in infrastructure. The highest contribution to the quality or deficiency of any service in tourism relates to the employees (Zanini Gavranić & Šugar, Citation2019). Therefore, labour productivity and wages are of highest importance for the overall quality of service in tourism sub-industries. The overall quality could be measured by income, output, loyalty and complain equations indicators. Following the previous literature, the hypothesis is defined as follows:
The null hypothesis H_0: there is no-causal-cointegrated relationship between labour productivity and real gross wage.
The alternative hypothesis H_1: there is uni-directional-causal-cointegrated relationship between real gross wage and labour productivity in the tourism sector in Slovenia and Croatia. The tested model is expressed in EquationEquation (8)(8)
(8) , i.e., productivity precipitates wages. This main empirical model follows the salient theoretical model presented in EquationEquation (7)
(7)
(7) appearance of data vector which is dispensed in EquationEquation (10)
(10)
(10) .
3. Data and methodology
Tourism can be a key to economy growth (Fonseca & Sánchez-Rivero, Citation2020) in the most of the Adriatic countries. It seeks for new techniques that are more stable in its proficiency and prediction. Some analyses regarding ordinary least squares (OLS) in tourism are spurious.
While the time series approaches to unit root and stationarity testing appear very similar on the surface, in fact a valid construction and application of the test statistics is much more complex for time series than for single OLS series. A difficulty arises since different asymptotic distribution for the test statistics may result depending on whether the number of all observations (N) is fixed and T (as much time series data as possible) tends to infinity, or vice versa, or both T and N increase simultaneously in a fixed ration.
Hence, it would be easier to increase the number of observations by simply increasing the length of the sample period. However, this data may not be available. There is a reason more, because of structural breaks in the time series, e.g. seasons, policy maker decisions, economic crisis, adverse weather conditions and other unexpected events.
3.1. Data
Time series data of four variables are obtained from the national statistical offices; for Croatian data, the Croatian Bureau of Statistics (CBS, Citation2020), and for Slovenia, Statistical Office of Republic of Slovenia (SORS, Citation2020). December 1999 is a first period month, which links relatives of current month:
(1)
(1)
where
is nominal value of current month,
is nominal value of previous month, and December 1999 is first observed month. Therefore, the chain index taking January 2000 = 100 as the base month is:
(2)
(2)
where
is the current month linked to relative, and
is the previous month linked to relative.
The following four variables have been used in the empirical analysis: i) gross wage (W), which is deflated by constant base harmonized, ii) consumer price index (CPI) to obtain real gross wage, and iii) tourist arrivals (ARR) divided by the iv) number of employees (EMPLOY) in the tourism sub-sector to obtain labour productivity.
The employees in crafts, trades, and freelancers are not included in the analyses. For the latter the main reason of such a decision is that Croatia provides data for this kind of employment only from 2010 onwards. Therefore, if we include total employment, we lose the pre-crisis and crisis periods. The analyses showed that employees in paid employments by legal persons represent most of the employees in both countries; in Croatia 64.4% and in Slovenia 63.7%, respectively. Therefore, in the paper the importance of degrees of freedom is respected.
3.2. Methodology
The data used in levels are presented in and to become familiar with their time series properties and comparisons between the countries. In addition to check whether there are some similarities and differences in collected variables, it is also computed labour productivity (PROD) for Croatia and Slovenia. In there is a dispersion of time series for Slovenia and in for Croatia. Second, the calculated variables PROD and real W () in EquationEquation (4)
(4)
(4) are presented in .
Figure 1. Dispersion of time series in levels for Slovenia.
Notes: ARR_SI – Number of tourist arrivals in Slovenia, W_SI – Gross wage in tourism sub-industries in Slovenia, EMPLOY_SI – Number of employees in tourism sub-industries in Slovenia, CPI_SI – Harmonized consumer price index for Slovenia.
Source: SORS (Citation2020).
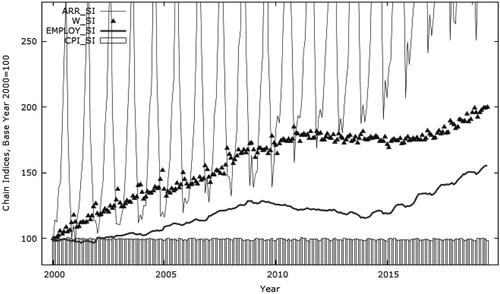
Figure 2. Dispersion of time series in levels for Croatia.
Notes: ARR_HR – Number of tourist arrivals in Croatia, W_HR – Gross wage in tourism sub-industries in Croatia, EMPLOY_HR – Number of employees in tourism sub-industries in Croatia, CPI_HR – Harmonized consumer price index for Croatia.
Source: CBS (Citation2020).
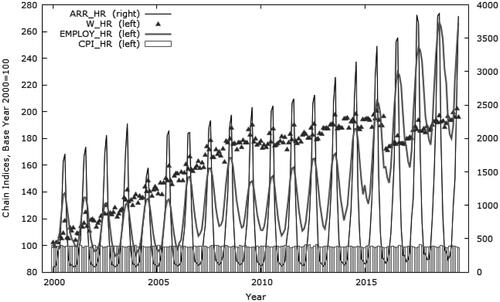
Figure 3. Dispersion of labour productivity and real gross wage in logs for Slovenia.
Notes: l_PROD_SI – logarithm of labour productivity for Slovenia, l_W – real gross wage for Slovenia.
Source: SORS (Citation2020); authors.
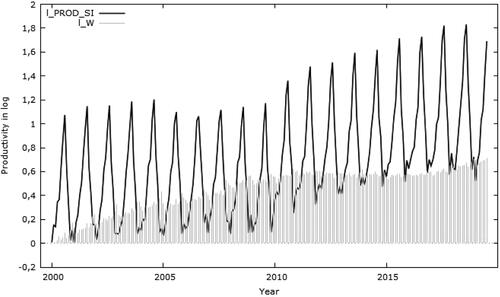
Figure 4. Dispersion of labour productivity and real gross wage in the first differences for Slovenia.
Notes: d – first differences in time series.
Source: SORS (Citation2020); authors.
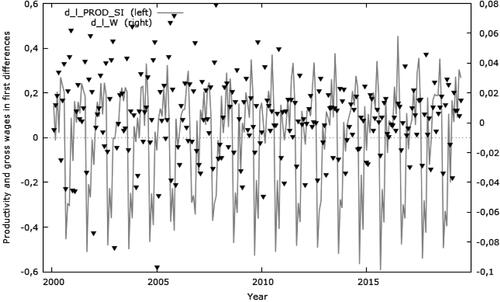
Figure 5. Dispersion of labour productivity and real gross wage in logs for Croatia.
Note: l_PROD_HR – logarithm of labour productivity for Croatia, l_W – real gross wage for Croatia.
Source: CBS (Citation2020); authors.
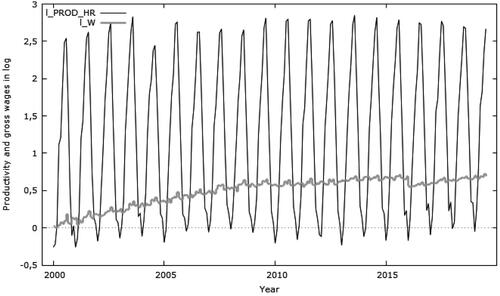
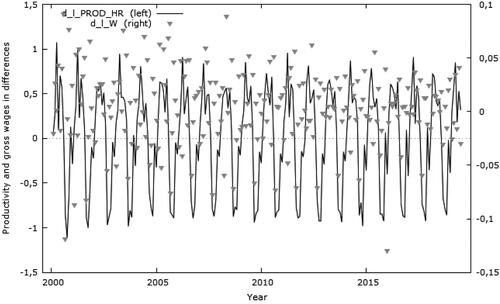
Figure 6. Dispersion of labour productivity and real gross wage in the first differences for Croatia.
Notes: d – first differences in time series.
Source: CBS (Citation2020); authors.
and indicate that in both countries CPI is relatively low and under control. ARR and W experienced seasonality in Slovenia whereas EMPLOY and CPI look more stable (). In Croatia, ARR, W and EMPLOY experienced obvious seasonality (). Therefore, the data are in a seasonal manner and a large part of the change in scale is determined by a seasonal pattern that is parsimoniously modelled by cubic spline. Harvey and Ito (Citation2020) report seasonal pattern in time series assumed to be fixed.
The volatility of all variables except for CPI is high and therefore we can estimate with no normal and no stable model if variables in levels are included in the finite model. Therefore, variables have been transformed into the real ones; computed as expressed by EquationEquations (3) (4)(4)
(4) and Equation(5)
(5)
(5) to obtain distributed residuals for the equations that provide real gross wage and labour productivity for both countries in a reliable empirical model.
For a credible result, we employ EquationEquation (3)(3)
(3) relative of gross wage to CPI:
(3)
(3)
where CPI measures inflation (Gričar & Bojnec, Citation2019). For the exact analysis equations of the labour productivity in tourism industry are performed, where labour productivity is analysed as output measured by ARR divided by EMPLOY in the tourism sub-industry (3). In the case of this research, the number of tourist arrivals are divided by the number of employees in tourism industry for Croatia and Slovenia (4). The equations are listed in a form:
(4)
(4)
(5)
(5)
where abbreviations used are: HR for Croatia, SI for Slovenia, t for time series.
Finally, the cointegration is foreseen:
(6)
(6)
where
is dependent variable,
is independent variable,
long-term coefficient, and
are residuals; adjustment coefficient. Some authors discussed about the cointegration, e.g. Brooks (Citation2019). There are several possible steps to get generalisation on cointegration in the literature such as for example Tang (Citation2010, Citation2012, Citation2014).
Testing for cointegration using the residuals following these extensions of Engle and Granger (Brooks, Citation2019) is also possible, although in general more complicated than to use a generalisation of the Johansen technique by Tang (Citation2010). This approach is simple alternative for each group of series separately, collecting the p-values for the trace test and then take two times the sum of their logs. A fully approach based on a vector autoregressive model (VAR) model:
(7)
(7)
where
is i.i.d. (
) and
are assumed fixed. Thus, even when the observations
are strongly time dependent, the conditional process (
) is independent and OLS estimates of
are Maximum Likelihood estimates; and error correction model (ECM):
(8)
(8)
are possible but with considerable additional complexity.
4. Empirical results
4.1. Empirical settings
In and are presented three variables in levels. First, ARR as tourism industry output (Gholipour et al., Citation2020). Tourist is sustaining in a transformation process as a coherent output. Second, PROD in a wage-labour productivity manner requires two-time series variables to calculate labour productivity as a ratio between ARR and EMPLOY in the tourism sub-industry, which are obtained from the statistical sources; EMPLOY is the number of persons in paid employment in legal entities. The last variable is W in tourism sub-industry. The later was deflated by CPI. Therefore, the data vector analysed in this research is two-fold. First, the data vector of variables in levels
(9)
(9)
where
and
are Slovenia and Croatia, respectively,
is exogenous variable,
time series and
length of time series. Second, the data vector in differences:
(10)
(10)
which are included in cointegration analysis, ECM and VAR model; and variables are at most
Therefore, the empirical part includes data sets from EquationEquation (9)
(9)
(9) presented in four steps: first, summary statistics and visual inspection; second, Granger Causality test; third, ECM; and fourth, VAR and VECM following theoretical considerations (Brooks, Citation2019) and empirical approaches (Badshah & Bulut, Citation2020; Tang, Citation2010, Citation2012, Citation2014).
Table 2. Overview of monthly data and misspecification tests, Croatia, T = 242.
Table 3. Overview of monthly data and misspecification tests, Slovenia, T = 242.
4.2. Summary statistics
Summary statistics of the collected secondary data for Croatia and Slovenia during the period December 1999–January 2020, i.e., for 242 observations, are presented in and , respectively.
In the case of Croatia (), a large maximum value in the number of tourist arrivals (ARR) is recognised. Its index is 4,171.90 for August 2019. This confirms rapid increases in ARR in Croatia to an overwhelmed nominal number of almost five million of tourist in a month; Croatia has a bit less than four million of inhabitants (Gričar et al., Citation2019). The result is scary having in mind of that public infrastructure, transportation and other facilities needs to be in a function for such a process output. Contrary, when lockdown due a sudden pandemic shock, it is a challenge for higher unemployment in tourism sector (Yu et al., Citation2020). The EMPLOY was the lowest in January 2003 and the highest in August 2019. On the other hand, W in Croatia was on the lowest level in February 2000 and the highest in January 2020 when a person earns 7.5 thousand Croatian kuna, which is a bit more than one thousand euro.
The data for Slovenia () shows that ARR is the most volatile variable with its standard deviation of 159.04. W (210.00) rose faster than EMPLOY (155.47). The lowest index of EMPLOY is 97.89 for January 2000 and of W for February 2000 (99.83).
The misspecification tests of ADF and normality test (Lilliefors test) for the variables in levels (EquationEquation 9(9)
(9) ), and relative variables (EquationEquations 3
(3)
(3) and Equation5
(5)
(5) ) confirmed unit root and proposed cointegration between analysed variables. The appropriate strategy for econometric modelling in this case would be to form and estimate an ECM on three steps procedure. First, to obtain misspecification test for the stability of the process, second, to import cointegration regression (EquationEquation 6
(6)
(6) ) for a long-term, and third, to employ causality relationship using Granger Causality technique for a short-term. Additionally, Johansen cointegration in a VAR is foreseen. The VAR is a natural framework for analysing some types of nonstationary processes and cointegration turns out to be a natural concept to describe long-term relations in economics and other fields, i.e. tourism.
In the case, there are two differenced variables (EquationEquations 3(3)
(3) and Equation5
(5)
(5) ) in an EquationEquation (6)
(6)
(6) ; say there can be at most only one linear cointegration of
and
that is stationary, i.e., at most one cointegrating relationship. The results of cointegration regression in and show that there could be only one stationary relation for each spatial equation. The relation
is dependent variable and
is independent variable. The speed of adjustment of
in Croatia is at below mean level and therefore has upward trend of 0.49 in a long-term. The beta coefficient for Croatia confirms that increase in
of one produce better labour productivity of 2.84 in a long-term (). On the other hand, results for Slovenia indicate slower speed of adjustment on a level of 0.48 and has negative trend in a long-term. The beta coefficient for Slovenia confirms that increase in
of one produce better labour productivity of 1.66 in a long-term ().
4.3. Visual inspection for Slovenia
The comparison of Slovenian W and PROD in logs are plotted in . It can be concluded that W after 2013 did not follow the PROD in tourism sub-industries (accommodation and food and beverage services).
On the other hand, variables are highly volatile and therefore additional calculation is needed. For more accurate further analysis, variables are transformed in the first differences (, ). From we can obtain that after 2013 have some specifics in most volatile months. This could lead to the conclusion that managers in tourism industry and policy decisions managers need to find the way to prolonged season with more employment during the whole year. Better quality service during the entire year can contribute to a lower volatility. Among the most optimal years for tourists, tourism enterprises and employees in Slovenia were 2015 and 2016 ().
4.4. Visual inspection for Croatia
The comparisons of Croatian W and PROD in logs are plotted in . We can recognise that the results for Croatia differ more than this is the case for Slovenia. Because of high (summer) seasonality, Croatian tourism sub-industry suffers volatilities in PROD and W, and therefore do not match optimal measure ().
High seasonality and volatility require that all variables should be transformed into at most first differences (, ). For Croatia, reports that is not optimised; W is largely dispersed and obviously not under control in the Croatian tourism sub-industry. The latter is obvious for all the analysed periods and
is more stable only after 2015. Similar for Slovenia, but at a slightly higher seasonality could be seen for pattern in development for
variable. The latter is due to very high summer output and lower output in the rest of the year. The difference between the summer and autumn periods is 9:1.
and show that the average level of labour productivity in Croatia is much higher than in Slovenia. This can be explained by some new developments in the tourism and sharing economy markets such as Airbnb, Booking.com and similar platforms providing tourist accommodation without employment in the hotel industry, as an issue for further research (Vinogradov et al., Citation2020).
4.5. Granger causality test comparisons, ECM, VAR and forecast
Pair-wise differences on both countries are analysed using Granger Causality test (). Results at lag two for both countries cannot reject that there is no causal relationship between
and
Table 4. Granger Causality test for Croatia and Slovenia and ECM.
Value of strong significance at zero % (or less than 1%) level confirms that causes
in Croatia. On the other hand,
does not cause
in Croatia by
value of 0.59. Therefore,
does not provide any increases of
which can be explained by relatively low real gross wage close to their minimum value as demanded by Croatian tourism trade unions, while managers might seek for prolonged seasons, but keeping W low to reduce costs.
The result at lag two for Slovenia rejects that there is causal relationship between
and,
but not vice versa. Considering the alternative hypothesis, this confirms that there is a strong uni-directional causal relationship between
and
for Slovenia. On the other hand,
does not cause
in Slovenia by
value of 0.95. Therefore,
does not provide any increases in
Results of ECM in corresponds to the intuition of one cointegration vector between the variables. We found that two series are cointegrated in a linear form since the residuals are weakly normally distributed. Note that we have calculated residuals in differenced data, whereas the data in levels do not confirm any uni-dimensional Engel and Granger cointegration. Therefore, residuals are attached to the data vector and lag them by one period to estimate ECM out of EquationEquation (8)(8)
(8) , as:
(11)
(11)
where
is estimated long-term relationship coefficient and
is the deviation of from long-term relationship in the previous period. It is vital to note that
is negative and an ECM is appropriate. The lagged residuals from the linear regression represent the deviation from the long-term relationship in the previous period.
The intuition is if real gross wage is above its long-term equilibrium with the market (PROD), the negative coefficient pulls it back down. This is a case for Slovenia. If it is below the long-term equilibrium, the negatives disappear and become positive pulling the gross wage back up. That is the magic of the ECM for Croatia. The coefficient can be interpreted as the proportion of disequilibrium that dissipates by the next period. Therefore, the results significantly confirm our statements that there is a decline in real gross wages in Slovenia, and no changes in real gross wages in Croatia. The new equilibrium for Slovenia is a bit more than a month, and for Croatia is a half of month. Croatia has two times faster productivity change that corresponds to the real gross wages.
Additionally, spatial autoregressive model (EquationEquation 10(10)
(10) ) with four variables, 2 lags, rank of three, one stochastic trend, and one deterministic shift dummy for August 2019, as a contrast to the ECM, is estimated. Based on the in-sample results, the pair-wise ECM seems to have inside country explanatory power and the VAR model has spatial power on three cointegrated vectors. Nevertheless, testing the VAR the whole vector ECM (VECM) output is performed in cointegration relations, restrictions on beta and
values, which are in parenthesis:
(12)
(12)
(13)
(13)
(14)
(14)
where eigenvalue of lag reduction test (LR) for cointegration rank (trace test statistics) is 51.93. The rank of three
has
-value 0.000 (trace test statistic is 16.22), while one unit root is clearly accepted. This result confirms three cointegration relations at 1% significance level as well as that there is no autocorrelation. Three cointegrated vectors confirm spatial development between Croatia and Slovenia, whereas there is no significant determination to national real gross wages from the neighbour countries on PROD (14).
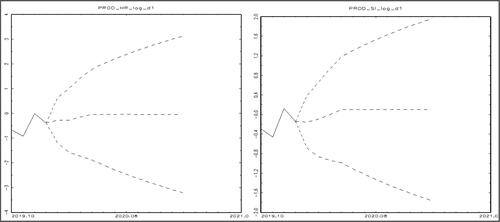
The one-year forecast, that includes health COVID-19 crisis as two and half month lockdown (0.5 of March, April, May), based on VECM model for PROD presented in , seems to be negative for Croatia for next 12 months. Slovenia would start a slow recovery in May 2020.
Figure 7. Prediction of labour productivity (PROD) for Croatia and Slovenia.
Notes: PROD_HR_lpg_d1 – forecast for Croatia; PROD_SI_lpg_d1 – forecast for Slovenia.
Source: author's calculation.
5. Conclusion
Econometric modelling refers to the relevant macroeconomic time series and developments in the tourism market of the two neighbouring EU Member States, Croatia and Slovenia. The specific focus is on tourist arrivals, gross wage in tourism sub-industries, and employment in lodging industry. Inflation is applied as external variable. Selection of specific variables is made based on the set hypothesis and previous empirical research (e.g., Dimitrić et al., Citation2019).
This research is relevant for tourism facing missing strong links between labour productivity and real gross wages. Findings of the paper are three-fold. First, the data vector includes long-term and promote several transitory shocks, e.g., EU accession, and economic crisis period. Second, analysis proposes possible scenario to tourism after pandemic crisis. Third, this research prompts the calculus for real gross wages and productivity, without producing autocorrelation in the econometric modelling.
Croatia and Slovenia tend to increase the level of tourism output outside the summer season. The tourism managers should be aware that low paid employees could not be sufficient for high demand and tourist output with a high quality of services. Increase in a labour productivity with higher quality of services could improve customer satisfaction and the whole year employment. Policy makers tend to increase the aberrance for tourist destinations in Slovenia and Croatia for the whole year as a part of strategies of sustainable tourism development.
The results show that labour productivity in Croatian and Slovenian tourism sub-industries have uni-directional causal relationship on real gross wage in tourism sub-industries. Labour productivity drives real gross wage, consistent with alternative hypothesis. The ECM predicts a decrease in labour productivity in Slovenia and decline in real gross wages in a next one-month period. Due to the COVID-19 crisis the prediction of VECM model confirms a decline in labour productivity for Slovenia up to May 2020.
On the other hand, ECM does not suggest any statistically significant change in labour productivity for Croatia. The change in labour productivity, if occurs in a short-term as proposed by Granger causality results, dissipates in a half of month. Due to the COVID-19 crisis, the prediction of VECM confirms decline in labour productivity for Croatia, mostly to its ARR and it lasts up to at least a year.
Tourism industry comprises of a wide variety of products, services and destinations involving various stakeholders, external and internal. These activities are sensitive to numerous shocks. In the last decades the tourism industry generated self-managing services based on information-communication technology which also enabled employees to generate new knowledge and skills.
5.1. Limitations and practical applicability
Among study limitations, the empirical analysis was conducted at aggregated tourism level and would be useful to apply at disaggregated levels such as transportation, and for new developments in the tourism and sharing economy markets (Airbnb, Booking.com and other possible tourist accommodation providers). The analysis is based on linear cointegration methods and in the future research would be useful to apply panel cointegration. Moreover, the transitory, permanent and blip shocks could be specified in the model to avoid non-normality.
The empirical approach has defined practical applicability to study various shocks, particularly the COVID-19 crisis in 2020s. Tourism labour market in both countries is less developed and under researched. Moreover, labour productivity in tourism service sector is challenged by application of new digital technologies, including robots and artificial intelligence. However, employees still play a crucial role in supply of tourism services. The new technologies could be issues for the future research, i.e. self-moving chair to avoid transmission of bacteria by chair.
To sum up, the research provides in-depth analysis and gives information and knowledge to managers for better understanding the causalities between real gross wage and labour productivity in tourism sub-industry. A spatial analysis between the two neighbouring countries offers answer to the question why policy makers and managerial decisions could be important for management of labour productivity and wage formation.
Disclosure statement
No potential conflict of interest was reported by the author(s).
Correction Statement
This article has been republished with minor changes. These changes do not impact the academic content of the article.
References
- Arandarenko, M., & Vukojevic, V. (2008). Labor costs and labor taxes in the Western Balkans. World Bank.
- Assaf, A. G., & Tsionas, M. (2018). The estimation and decomposition of tourism productivity. Tourism Management, 65, 131–142. https://doi.org/https://doi.org/10.1016/j.tourman.2017.09.004
- Badshah, W., & Bulut, M. (2020). Cointegration: Theoretical comparison and empirical evidence. Economies, 8(2), 49. https://doi.org/https://doi.org/10.3390/economies8020049
- Baležentis, T., & Baležentis, A. (2016). Dynamics of the total factor productivity in Lithuanian family farms with a statistical inference: the bootstrapped Malmquist indices and multiple correspondence analysis. Economic Research-Ekonomska Istraživanja, 29(1), 643–664. https://doi.org/https://doi.org/10.1080/1331677X.2016.1193946
- Bojnec, Š. (2003). Wage formation during economic transformation: Macroeconomic facts and firm survey evidence from Slovenia. Post-Communist Economies, 15(4), 571–593. https://doi.org/https://doi.org/10.1080/1463137032000189381
- Bojnec, Š. (2004). Labor market flows, labor productivity, and wages in Slovenia. Eastern European Economics, 42(3), 23–43. https://doi.org/https://doi.org/10.1080/00128775.2004.11041076
- Brooks, C. (2019). Introductory econometrics for finance (4th ed.) Cambridge University Press.
- CBS. (2020, March 1). CBS databases. https://www.dzs.hr/default_e.htm.
- Chatzimichael, K., & Liasidou, S. (2019). A parametric decomposition of hotel-sector productivity growth. International Journal of Hospitality Management, 76(Part A), 206–215. https://doi.org/https://doi.org/10.1016/j.ijhm.2018.05.010
- Dimitrić, M., Žiković, I. T., & Blecich, A. A. (2019). Profitability determinants of hotel companies in selected Mediterranean countries. Economic Research-Ekonomska Istraživanja, 32(1), 1977–1993. https://doi.org/https://doi.org/10.1080/1331677X.2019.1642785
- Dimitriou, J. D., & Aparicio, S. (2018). Comparative evaluation of airports productivity towards tourism development. Cogent Business & Management, 5(1), 1464378. https://doi.org/https://doi.org/10.1080/23311975.2018.1464378
- Dogru, T., & Bulut, U. (2018). Is tourism an engine for economic recovery?: Theory and empirical evidence. Tourism Management, 67(8), 425–434. https://doi.org/https://doi.org/10.1016/j.tourman.2017.06.014
- Dragos, C. M., Dinu, V., Marcel, P. C., & Dabija, D.-C. (2014). Scientometric approach of productivity in scholarly economics and business. Economic Research-Ekonomska Istraživanja, 27(1), 496–507. https://doi.org/https://doi.org/10.1080/1331677X.2014.974337
- Dua, P., & Garg, N. K. (2019). Determinants of labour productivity: Comparison between developing and developed countries of Asia‐Pacific. Pacific Economic Review, 24(5), 686–704. https://doi.org/https://doi.org/10.1111/1468-0106.12294
- ECB. (2020, March 1). Euro foreign exchange reference rates. https://www.ecb.europa.eu/stats/policy_and_exchange_rates/euro_reference_exchange_rates/html/eurofxref-graph-hrk.en.html.
- Eurostat. (2020, March 1). Database. https://ec.europa.eu/eurostat/data/database.
- Fonseca, N., & Sánchez-Rivero, M. (2020). Publication bias and genuine effects: the case of Granger causality between tourism and income. Current Issues in Tourism, 23(9), 1084–1108. https://doi.org/https://doi.org/10.1080/13683500.2019.1585419
- Gabrielczak, P., & Serwach, T. (2018). The links between firm-level productivity and modes of international expansion of firms from the Lodz Voivodeship. Economic Research-Ekonomska Istraživanja, 31(1), 1307–1329. https://doi.org/https://doi.org/10.1080/1331677X.2018.1477612
- Gholipour, H. F., Tajaddini, R., & Andargoli, A. E. (2020). The long run and short run impact of international tourists’ retail shopping on domestic retail sale. Current Issues in Tourism, 1–7. https://doi.org/https://doi.org/10.1080/13683500.2020.1732882
- Gligorov, V., Iara, A., Landesmann, M., Stehrer, R., & Vidovic, H. (2008). Western Balkan countries: Adjustment capacity to external shocks, with a focus on labour markets. The Vienna Institute for International Economic Studies.
- Gričar, S. (2019). Tourist as a patient. In N. Kregar-Velikonja, & L. Leskovic (Eds.), Holistic approach to the patient: International Scientific Conference (p. 23). University of Novo mesto, Faculty of Health Sciences. https://plus.si.cobiss.net/opac7/bib/COBIB/302429952
- Gričar, S., & Bojnec, Š. (2019). Prices of short-stay accommodation: time series of a eurozone country. International Journal of Contemporary Hospitality Management, 31(12), 4500–4519. https://doi.org/https://doi.org/10.1108/IJCHM-01-2019-0091
- Gričar, S., Šugar, V., & Bojnec, Š. (2019). Small and medium enterprises led-growth in two Adriatic countries: Granger causality approach. Economic Research-Ekonomska Istraživanja, 32(1), 2161–2179. https://doi.org/https://doi.org/10.1080/1331677X.2019.1645711
- Grulja, M. A., Turk, T., & Verbič, M. (2013). Taxation of wages in the Alps-Adriatic region. Financial Theory and Practice, 37(3), 259–277. https://doi.org/https://doi.org/10.3326/fintp.37.3.2
- Gulić, S. (2018). Tourism in figures 2017. Republic of Croatia, Ministry of Tourism.
- Hall, D. (2002). Brand development, tourism and national identity: The re-imaging of former Yugoslavia. Journal of Brand Management, 9(4), 323–334. https://doi.org/https://doi.org/10.1057/palgrave.bm.2540081
- Harvey, A., & Ito, R. (2020). Modeling time series when some observations are zero. Journal of Econometrics, 214(1), 33–45. https://doi.org/https://doi.org/10.1016/j.jeconom.2019.05.003
- Ilić, I., & Petrevska, I. (2018). Using DEA method for determining tourism efficiency of Serbia and the surrounding countries. Menadzment u Hotelijerstvu i Turizmu, 6(1), 73–80. https://doi.org/https://doi.org/10.5937/menhottur1801073I
- Jaržemskis, A., & Jaržemskienė, I. (2018). Upgraded data envelopment analysis model application for total productivity comparison in major airports of the European Union. Economic Research-Ekonomska Istraživanja, 31(1), 1273–1288. https://doi.org/https://doi.org/10.1080/1331677X.2018.1456349
- Juselius, K., & Drehmann, M. (2020). Leverage dynamics and the burden of debt. Oxford Bulletin of Economics and Statistics, 82(2), 347–364. https://doi.org/https://doi.org/10.1111/obes.12330
- Kersan-Škabić, I. (2015). The rationale and implications of internal devaluation in the EU new member states. International Journal of Economic Perspectives, 9(4), 77–93.
- Kim, H. S., & Jang, S. (2019). Minimum wage increase and firm productivity: Evidence from the restaurant industry. Tourism Management, 71, 378–388. https://doi.org/https://doi.org/10.1016/j.tourman.2018.10.029
- Kotarski, K., & Petak, Z. (2019). Croatia’s post-communist transition experience: the paradox of initial advantage turning into a middle-income trap. In Z. Petak & K. Kotarski (Eds.), Policy-making at the European periphery. New perspectives on South-East Europe (pp. 1–25). Palgrave Macmillan.
- Kump, N., Novokmet, F. (2018). Top incomes in Croatia and Slovenia, from 1960s until today. World Inequality Lab Working Papers Series, Working Papers Series (8), 1–60.
- Lahovnik, M. (2019). Corporate governance following the Slovenian transition: from success story to failed case. Journal of Balkan and near Eastern Studies, 21(5), 613–623. https://doi.org/https://doi.org/10.1080/19448953.2018.1506290
- Li, X. (2014). An analysis of labour productivity growth in the Canadian tourism/hospitality industry. Anatolia, 25(3), 374–386. https://doi.org/https://doi.org/10.1080/13032917.2014.882850
- Lin, S.-H., & Weng, Y. (2019). Market size, productivity and product quality regarding firm heterogeneity. Economic Research-Ekonomska Istraživanja, 32(1), 2924–2934. https://doi.org/https://doi.org/10.1080/1331677X.2019.1653781
- Liu, A., & Wu, D. C. (2019). Tourism productivity and economic growth. Annals of Tourism Research, 76, 253–265. https://doi.org/https://doi.org/10.1016/j.annals.2019.04.005
- Mody, M., Hugo Tang, C.-H., Gaulke, C., & Gordon, S. (2018). Examining the personal and institutional determinants of research productivity in hospitality and tourism management. Journal of Hospitality & Tourism Education, 30(1), 36–51. https://doi.org/https://doi.org/10.1080/10963758.2017.1413378
- Nastav, B., & Bojnec, Š. (2007). The shadow economy in Bosnia and Herzegovina, Croatia and Slovenia: The labor approach. Eastern European Economics, 45(1), 29–58. https://doi.org/https://doi.org/10.2753/EEE0012-8775450102
- Noja, G. G. (2018). Flexicurity models and productivity interference in C.E.E. countries: a new approach based on cluster and spatial analysis. Economic Research-Ekonomska Istraživanja, 31(1), 1111–1136. https://doi.org/https://doi.org/10.1080/1331677X.2018.1456356
- Peypoch, N. (2007). On measuring tourism productivity. Asia Pacific Journal of Tourism Research, 12(3), 237–244. https://doi.org/https://doi.org/10.1080/10941660701416812
- Pham, T. D. (2020). Tourism productivity theory and measurement for policy implications: The case of Australia. Journal of Travel Research, 59(2), 247–266. https://doi.org/https://doi.org/10.1177/0047287519835972
- Provenzano, D., & Baggio, R. (2019). Quantitative methods in tourism and hospitality: A perspective article. Tourism Review, 75(1), 24–28. https://doi.org/https://doi.org/10.1108/TR-07-2019-0281
- Silva, J. R., & Guimarães, C. R. F. F. (2017). Wage differentials in Brazil: Tourism vs. other service sectors. Cogent Economics & Finance, 5(1), 1319606. https://doi.org/https://doi.org/10.1080/23322039.2017.1319606
- SORS. (2020, March 1). SISTAT. https://pxweb.stat.si/SiStatDb/pxweb/sl/20_Ekonomsko/20_Ekonomsko__03_nacionalni_racuni__35_03808_ekonom_rac_turizem/0380845S.px/table/tableViewLayout2/
- Stundziene, A., & Saboniene, A. (2019). Tangible investment and labour productivity: Evidence from European manufacturing. Economic Research-Ekonomska Istraživanja, 32(1), 3519–3537. https://doi.org/https://doi.org/10.1080/1331677X.2019.1666024
- Sunanda, J., & Dinabandhu, B. (2019). The service sector: migration, technology and productivity. International Journal of Sociology and Social Policy, 39(1/2), 2–21.
- Škuflić, L., & Družić, M. (2016). Deindustrialisation and productivity in the EU. Economic Research-Ekonomska Istraživanja, 29(1), 991–1002. https://doi.org/https://doi.org/10.1080/1331677X.2016.1235505
- Tang, C. F. (2010). The money-prices nexus for Malaysia: New empirical evidence from the time-varying cointegration and causality tests. Global Economic Review, 39(4), 383–403. https://doi.org/https://doi.org/10.1080/1226508X.2010.533849
- Tang, C. F. (2012). The non‐monotonic effect of real wages on labour productivity: New evidence from the manufacturing sector in Malaysia. International Journal of Social Economics, 39(6), 391–399.
- Tang, C. F. (2014). The effect of real wages and inflation on labour productivity in Malaysia. International Review of Applied Economics, 28(3), 311–322. https://doi.org/https://doi.org/10.1080/02692171.2013.872084
- Tkalec, M., & Vizek, M. (2016). The price tag of tourism: Does tourism activity increase the prices of goods and services? Tourism Economics, 22(1), 93–109. https://doi.org/https://doi.org/10.5367/te.2014.0415
- Uruena, A., Arenas, A. E., & Hidalgo, A. (2018). Understanding workers’ adoption of productivity mobile applications: A fuzzy set qualitative comparative analysis (fsQCA). Economic Research-Ekonomska Istraživanja, 31(1), 967–981.
- Veselinović, L., Mangafić, J., & Turulja, L. (2020). The effect of education-job mismatch on net income: evidence from a developing country. Economic Research-Ekonomska Istraživanja, 1–22. https://doi.org/https://doi.org/10.1080/1331677X.2020.1723427
- Vinogradov, E., Leick, B., & Kivedal, B. K. (2020). An agent-based modelling approach to housing market regulations and Airbnb-induced tourism. Tourism Management, 77, 104004. https://doi.org/https://doi.org/10.1016/j.tourman.2019.104004
- Walmsley, A., Partington, S., Armstrong, R., & Goodwin, H. (2019). Reactions to the national living wage in hospitality. Employee Relations, 41(1), 253–268. https://doi.org/https://doi.org/10.1108/ER-02-2018-0044
- Warren, K. (2019). A luxury travel company exec says Japan, Slovenia, and Antarctica will be the hottest travel destinations of 2020. Business Insider. https://www.businessinsider.com/japan-slovenia-antarctica-will-be-hot-2020-destinations-2019-12
- Weinschenck, G. (1979). Development problems of the agricultural sector in labour-managed market economies: The case of Yugoslavia. European Review of Agricultural Economics, 6(4), 399–433. https://doi.org/https://doi.org/10.1093/erae/6.4.399-a
- World Bank. (2020, March 1). World Bank open data. https://data.worldbank.org.
- World Tourism Organisation. (2020, March 30). International tourism to plunge up to 30% due to virus. UNWTO https://international-tourism-to-plunge-up-to-30-due-to-virus-unwto/articleshow/74849024.cms?from=mdr
- Yalçinkaya, Ö., Daştan, M., & Karabulut, K. (2018). The effects of international tourism receipts on economic growth: Evidence from the first 20 highest income earning countries from tourism in the World (1996–2016). Montenegrin Journal of Economics, 14(3), 55–71. https://doi.org/https://doi.org/10.14254/1800-5845/2018.14-3.4
- Yian, C. (2019). Misallocation of human capital and productivity: evidence from China. Economic Research-Ekonomska Istraživanja, 32(1), 3348–3359. https://doi.org/https://doi.org/10.1080/1331677X.2019.1663546
- Yildirim, Z. (2015). Relationships among labour productivity, real wages and inflation in Turkey. Economic Research-Ekonomska Istraživanja, 28(1), 85–103. https://doi.org/https://doi.org/10.1080/1331677X.2015.1022401
- Yu, M., Li, Z., Yu, Z., He, J., & Zhou, J. (2020). Communication related health crisis on social media: a case of COVID-19 outbreak. Current Issues in Tourism, 1–7. https://doi.org/https://doi.org/10.1080/13683500.2020.1752632
- Zanini Gavranić, T., & Šugar, V. (2019, March). Doprinos FMEA metode poboljšanju kvalitete usluga za VIP goste u hotelijerstvu [Contribution of FMEA method to improving the quality of service for VIP guests in the hotel industry]. In M. Drljača (Ed.), International Symposium on quality; Quality - yesterday, today, tomorrow (pp. 321–331). Hrvatsko društvo menadžera kvalitete.
- Zuo, B., & Li, L. (2018). Resource reallocation and heterogeneous productivity growth in the tourism industry. Journal of China Tourism Research, 14(3), 370–391. https://doi.org/https://doi.org/10.1080/19388160.2018.1510352
- Žigo, A., Gabruč, J., & Juvan, E. (2017). Employment experience of immigrant workers in tourism. Academica Turistica, 10(2), 151–165. https://doi.org/https://doi.org/10.26493/2335-4194.10.151-165