
 ?Mathematical formulae have been encoded as MathML and are displayed in this HTML version using MathJax in order to improve their display. Uncheck the box to turn MathJax off. This feature requires Javascript. Click on a formula to zoom.
Abstract
The performance farming is a new bet for the EU in the context of the present's major climate and economic challenges. This paper aims at defining a model of agricultural competitiveness for the EU and its application for the evaluation of regional agricultural performance, in relation to the global competitiveness index, using the theory of catastrophes. The objectives of the analysis are: to evaluate the current growth theories in agriculture, to conceptualize a new model of agricultural performance improvement (RAP), to test the model and to obtain the relevant working tools after its application. The used methods are: the study of the general models of growth in agriculture; the dynamic analysis of the Eurostat data on agricultural performance and Member States’ data published in the National Accounts System; the conceptualization of the RAP (Regional Agricultural Performance) growth model; the statistical testing of the model, its connectivity with global competitiveness indexes and climate change; the hypotheses’ building in order to eliminate the climate transformations influences according to the catastrophe theorem’s results; and providing a viable and sustainable tool for the national strategy for agriculture’s forecasting changes to the Member States. The novelty element brought by the present proposed model is that of quantification in a broader and special way of the impact of environmental changes on the performing agricultural output in terms of National Accounting System.
1. Introduction
The current global context is dominated by the strong population growth, which reached 7.7 billion inhabitants in 2019, compared with 3 billion in the 1960s. The challenges to agriculture, which sustains the population's food needs, become multiple by enhancing the demand in relation to food security requirements. The function of agricultural supply dissociates from the demand function due to the influences of the catastrophes and the intensification of these influences.
Another challenge for the supply function is the decline in soil quality due to the extensive use of the agricultural fertilizers and the food production with a high environmental risk. This general picture assesses the imbalance in global demand-supply, an imbalance that is known by national and regional decision-makers and counterbalanced by the investment process, refining the human resource, importing technologies and mechanisms for the agricultural output storing and redistributing surplus.
This research aims to evaluate the current models and theories of the regional agriculture growth and to define a revelatory and easy to implement tool, namely the RAP model.
The authors’ motivation regarding the present scientific approach lies in their preoccupation for the significant improvement of the agricultural performance, which in Romania is much diminished compared to the other branches of the economy. Thus, compared to an occupational employment process in agriculture of 30%, the agricultural economic efficiency rate in recent years has not exceeded 5% of GDP. Moreover, the organization of the agricultural entities and the climate disturbances are other challenges for agriculture, which hinders the process of its sustainable growth.
In relation to the significant research directions identified by the authors during the literature review (presented below), the authors found that there are multiple performance concerns in the current research, but which do not reach all the necessary aspects to identify the national performance in the European context. From our point of view, it is necessary to implement a new model for the analysis of development in the branch, a model that takes into account competitiveness for the EU and its application for the evaluation of regional agricultural performance, in relation to the global competitiveness index, using the theory of catastrophes. In this context, we consider that it is opportune to develop the RAP model as a means of agricultural performance improvement.
2. Literature review
Against the background of the growing and intensifying challenges of increasing regional disparities in agricultural systems, there is an intense concern of the researchers in the field of providing viable models of industry growth and protection against uncertainty factors. A synthesis of representative contributions in the field is presented in , which quantifies the impact on regional agricultural performance, as well as the differences from the integrated approach proposed by the RAP model.
Table 1. Summary of economic regional models vs RAP model.
All the above challenges are solved by RAP model proposed in this paper.
On a global scale, a variety of performance improvement models are used in agriculture, but these models are not correlated with the new socio-economic and climatic challenges. The RAP model proposes an integrated vision of socio-economic and climatic factors and contributes to the improving predictability of the agricultural performance.
The analysis of the specialized literature shows several strategic directions on which the researchers focused mainly on the concept of agricultural performance. Thus, the use of the sustainable sources in order to achieve performance is a significant pillar which is transposed into current practice through the efforts of the international bodies to develop the sustainable economy.
Other directions aim at the interaction with the high-tech segments and the added value of research-innovation in the branch, spatial models for sustainable agriculture development, greening campaigns and investments in clean technologies, identification of Input-Output type performance models to substantiate agricultural performance, the use of the predictive capacities to compare the European framework with different development peaks in order to identify the impact of the performance enhancing factors, including the environmental factors, transposition into practice of composite environmental indices to mitigate regional disparities and create conditions for performance, etc.
3. Research methodology
The authors identified four topics of interest in conceptualizing their new model. These are aimed at: the dynamics of agricultural exploitation in the EU and on Member States; the agricultural output, labour productivity in agriculture and occupational structure; the economic performance in agriculture, taken on the basis of National Accounting System; and the agricultural production structure by types of products.
In order to adjust the model, the global competitiveness indices were used. The climate change dynamics and the adaptive factors support the agricultural producers behaviour in a climate crisis situation based on accumulated over time experience (know-how). Starting from these aspects, the authors have established the following working hypotheses:
H1: the regional economic performance in agriculture is directly proportional to regional managerial goodwill in terms of sustainable economic growth and maximizing the beneficial effects of investment in line with the national strategy in agriculture;
H2: the diversity of the agricultural production structure and the homogeneity of the distribution in the territory are directly related to the economic performance, creating the premises of sustainability in agriculture;
H3: the climate change evolution generates adaptive behaviour in the context of the competitiveness constraints increasing, which eliminates through causal relationships the economic failure in the branch;
H4: the economic performance in the agricultural sector is even higher as the percentage of use of agricultural land is higher and the degree of concentration of the agricultural producers is higher, too;
H5: the optimization of economic performance in agriculture follows the cyclic process of the Markov chains, in which the optimal area is defined on the basis of the previous critical area, adjusted with the adaptive factor and the core of the policy adapted to global trade.
We define the model of agricultural performance improvement (RAP) as follows:
• (Ǝ) the regionally defined vector F that expresses the dynamics of agricultural holdings in the region:
(1)
(1)
where: i ϵ (1, 5), respectively: EU28, Germany, France, Poland and Romania; Aa – the use of agricultural areas in the region; Ah – agricultural holdings in the region at a moment; Sf – small farms from an economic point of view (turnover
euros); Ff – family farms that cover more than 50% of employees from family members.
We can define the vectors’ components in relation to the climatic transformations and the adaptive factor as follows:
(2)
(2)
where: AaEU –EU farming area;
the adaptive factor;
– the climate change.
(3)
(3)
where: AhEU – agricultural holdings across the EU; Ii - the beneficial effects of investment in line with the national strategy in agriculture; IEU - the beneficial effects of investment in line with the European agriculture strategy.
(4)
(4)
where: SfEU – small farms across the EU.
(5)
(5)
where: FfEU – family farms across the EU.
• (Ǝ) the regional Lf vector defined as expressing the dynamics of regional labour productivity in the agricultural holdings:
(6)
(6)
where: Ea – the absorption rate of the regional agricultural labour; Ei - the absorption rate of the national agricultural labour; Eaq - the rate of absorption of the regional qualified labour in agriculture; Eay - the absorption rate of the regional youth employment factor (below 40) in agriculture; Eam - the absorption rate of the regional male labour factor in agriculture.
• (Ǝ) Ec regional vector defined as expressing the regional economic performance in the agricultural holdings:
(7)
(7)
where: GDPa – agriculture's contribution to the regional GDP; GVA – gross added value in basic agricultural prices; NGDPa - the contribution of agriculture to the net regional GDP; A –A factor (the agricultural income factor/annual labour unit); GDP – regional GDP.
• (Ǝ) the AS regional vector defined as expressing the regional structure of agricultural production on the seven basic components: cereals, root crops, permanent crops, fresh vegetables, raw milk, bovine meat, pig meat and poultry meat:
(8)
(8)
where: ASEU – the structure of European agricultural production.
We define the model of agricultural performance improvement (RAP) according to the vector relation equation as follows:
(9)
(9)
where: IC – Global Competitiveness Index, ie components: Pillar 4 - Macroeconomic stability, Pillar 5 - Health, Pillar 6 - Skills, Pillar 7 - Product market and Pillar 8 - Labour market Footnote1.
According to the Global Competitiveness Index, at the level of the analysed sample, there is a performance rating in favour of Germany and France, which manage to reach and even exceed the European average on pillars 5, 6 and 8 ().
Table 2. Global Competitiveness Index’s structure on specific pillars (%).
RAP model operates according to the catastrophe theorem, quantifying the negative amplitude of climate adjustments optimized by the adaptive factor according to the substitution position and offsetting the negative impact of these climate transformations by increasing the restrictions on global competitiveness indices. The model ensures a net growth of the vectors between two successive climatic events, thus optimizing agriculture’s outputs by applying sustainable policies in line with the national strategy.
4. Results and discussion
For the RAP model’s testing/implementation, the authors analysed the statistical data provided by Eurostat during 2010-2018Footnote2. The authors collected the official final data at the time of writing. For 2019, the data were provisional.
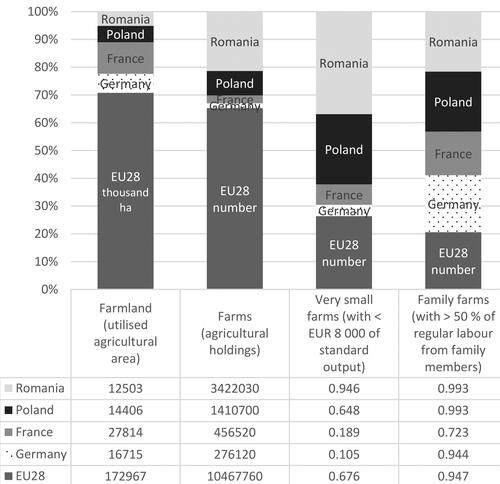
The collected data were analysed for EU28 and four Member States: France, Germany, Poland and Romania, in order to create a generally confirmed/infirmed profile at Member States’ level. Thus, there are over 10.5 million agricultural holdings across the EU28, of which the most (2/3) have less than 5 ha land.
The total EU28 agricultural area used for productive purposes is 173 million haFootnote3.
From the farm dynamics point of view, France (16.1% of all EU28 agricultural land) has the highest land use rate, being far removed from the other analysed countries, which do not exceed 10%. The lowest share of agricultural used land is held by Romania, which, although having the most agricultural holdings, does not resolve the good the natural soil advantage of the good quality due to the deficiencies of the regional administrative system and the lack of technology in agriculture.
A special case is represented by Germany, the country where agricultural holdings are minimally represented by the EU average, but they are grouped on small and very small farms with the aim of using the agricultural area within the upper 10% range. Thus, a regional profile for the dynamics of agricultural exploitation is outlined in the sense that European agriculture is concentrated in agricultural holdings whose economic performance depends to a large extent on the capacity and autonomy of the regional authorities to support the agricultural branch in regions. The agricultural productivity is dependent on managerial and financial tools available to farmers ().
Figure 1. Dynamics of agricultural exploitation in the EU and on Member States. Source: author's contribution.
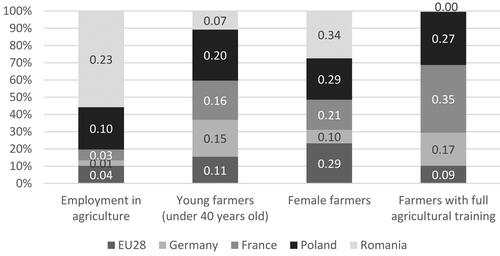
The aggregate indicator of labour productivity in agriculture and occupational structure by age and gender, captures the complexity of agricultural supply through the input of human resources segregated according to several structural criteria (vocational training, age and sex of agricultural workers). There is an occupational asymmetry within the agricultural branch.
Across the EU and each Member State, meaning that at most 4.2% of the EU population is working in agriculture, but the disparities between Member States in relation to this indicator are very high. The differences related to the labour employed in agriculture are “in favour” of Romania, which held the largest number of farmers from the four analysed Member States (1.96 million farmers) in 2016. Poland ranks second, followed by France and Germany ().
Figure 2. Labour productivity in agriculture and occupational structure by age and gender. Source: author's contribution.
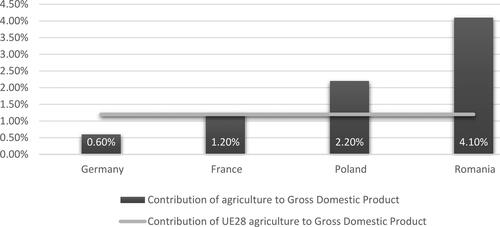
The agricultural output is quantified in terms of the branch's contribution to GDP. EU-level representativeness is 1.2% of GDP, which means a minimal contribution of the branch to the total EU economy, including the orientation towards high value-added commerce, perceived as a generator of economic welfare in the EU. The dissemination of national results on quartile representation intervals indicates that France transposed the CAP most faithfully. The countries where economic development is clearly inferior to France and Germany (Poland and Romania), have an agricultural sector’s contribution to the GDP of 2 and 4 times greater than the EU average. Germany has the lowest contribution of agriculture to GDP (0.6%), reflecting the top position from the economic point of view, on the principle of supplying goods and services with high added value. The agricultural output brings to EU an annual plus of 188460 million euros at basic prices. The highest agricultural output (29526 million euros) is held by France, namely 15.7% of gross value added at basic prices. France is followed in the ranking of the analysed countries by Germany (20882 million euros gross value added of the agricultural sector), the last place being ranked by Romania with a contribution of three times lower than that of France (7845 million euros), ().
Figure 3. Contribution of agriculture to GDP (%). Source: author's contribution.
We define the economic performance in agriculture, taken on the basis of the National Accounting System (NAS), as the cumulative positive effects of the branch in relation to the national economy, quantifiable at the NAS level by the gross amounts contributed to the national/European GDP and by the direct influence of the branch to the sustained growth of the economy, namely to obtain an annual budget surplus and to keep the GDP growth synergy constant after harmonization with the inflationist phenomenon. For the reporting unit, the authors analysed the performance dynamics values using the basic price system to keep the proportions and increase the degree of similarity between the data of the various national economies.
The Performance Scoreboard is achieved by quantifying six indicators and calculating national representativeness in relation to the EU agricultural performance. The six indicators included in the calculation are: Contribution of agriculture to GDP (CA_GDP); Value of agricultural output (OUTPUT); Value of animal output (ANIMAL_OUTPUT); Value of crop output CROP_OUTPUT); Gross value added (GVA); Agricultural factor income per annual work unit (A). The values obtained from the analysis of the indicators are compared on the basis of the impact weights in relation to the European performance and allow to build a performance ranking ().
Figure 4. Agricultural performance ranking. Source: author's contribution.
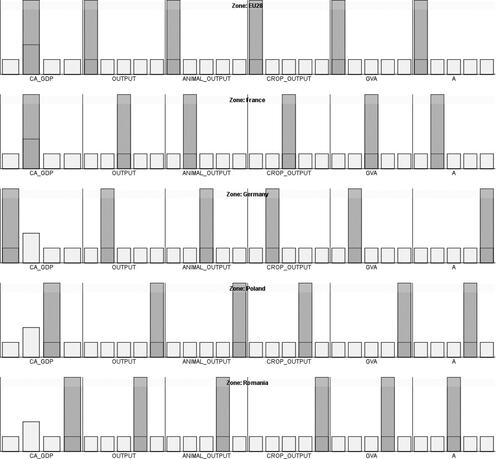
represents a diagram made by IBM-SPSS 25 software, which reflects horizontally and vertically the ranking of the analysed items according to the segregation criterion (zoning). In , CA_GDP is represented vertically for the five analysed economic entities (EU, France, Germany, Poland and Romania). It is found that France occupies a significant share and holds the first position in the ranking, its performance influencing the overall EU score. On second place is Germany, followed by Poland and Romania.
In terms of agricultural output, Germany is the country closest to the EU average, followed by France, Romania and Poland. The animal output has a similar structure in terms of ranking as the agricultural output, excepting the change of positions between Germany and France.
The CROP_OUTPUT value places Germany in first place in the European ranking, followed by France, Poland and Romania (the analysis was performed for the sample established in this research).
GVA confirms the GDP trend for France and Germany, but ranks Romania on 3rd, followed by Poland. Finally, A identifies vulnerabilities for Germany and an improved position for Romania due to the fact that in Romania, a large part of the rural labour factor works in agriculture.
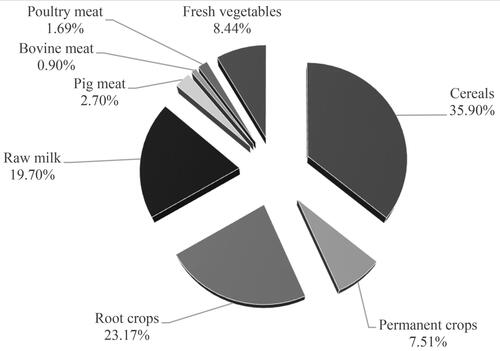
The agricultural production structure by types of products covers: Cereals, Permanent crops, Root crops, Raw milk, Pig meat, Bovine meat, Poultry meat and Fresh vegetables. Across the EU, the main category of agricultural inputs to GDP is Cereals, followed by Root crops and Raw milk ().
Figure 5. EU agricultural production structure (%). Source: author's contribution.
France and Germany have the highest shares in European production of agricultural products, compared to Romania, where the representativeness does not exceed an average of 22% of the potential of these two. This aspect is primarily due to the poor economic performance of the branch, amid the scarcity of investment programs and cataclysms produced lately in Romania, cataclysms that, in addition to climate change, are generated by systematic forest eradication ().
Figure 6. Ranking of agricultural performance by representative products. Source: author's contribution.
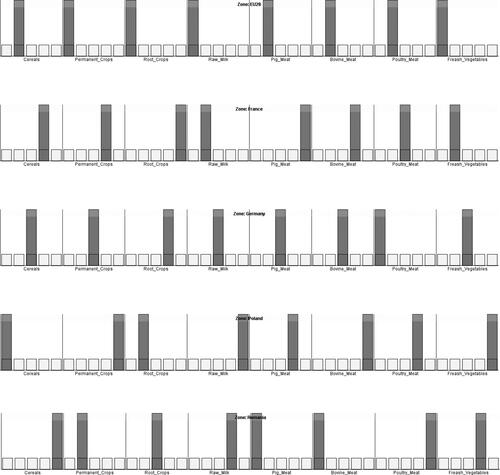
There is a balance of agricultural production as a national representatively towards the EU between Germany and France on Root crops and Raw milk. In terms of grain production, France is the leader (21.8% representative), while in pork production, Germany holds the first position (23.3%). Fresh vegetables are harvested by France (11.4%) while Germany keeps a low interest (2.5% of EU production). Raw milk products are exploited and marketed more heavily in Germany (19.2%), while these products reach a representation of 15.3% in France. Poland holds the leading position in poultry meat, while Romania is constantly on the last place at all chapters. The most serious situation is recorded in the production of bovine meat for which Romania owns only 0.8% of the EU production.
The average ranking of all categories of agricultural products is dominated by France (15.51%), Germany (14.21%), followed by Poland (9.46%) and Romania (3.19%).
According to , it is observed that on the main agricultural products, the representation of the country's advantage ranks France on the 2nd place for fresh vegetables, raw milk and permanent crops, on the 3rd place for poultry meat and on the 4th place for cereals, pig meat and bovine meat. Germany ranks 1st place in poultry meat, 3rd in cereals, raw milk and permanent crops, pork and bovine meat and fresh vegetables. Poland ranks 1st place in cereals, 2nd in root crops and the last place in the other analysed productions. Romania ranks 2nd place in permanent crops, 1st in pork and bovine meat, 3rd in root crops and the last place for other productions.
From the climatic point of view, several databases have been investigated [www.metnet.eu, www.aemet.ro, regional climate center (www.ecad.eu), global framework for climate services (www.wmo.int)], which allowed the structuring of a current climate profile for the analysed countries and the EU28 ().
Table 3. Current climate profile.
The influence factors were defined on a scale of 1 to 5, in which 1 - low influence and 5 - maximum influence. For the risk indicators whose impact was highlighted in the above table, the frequency coefficients of influencing the model variables were evaluated (under probabilities’ approach), resulting in a matrix distribution of environmental risk over the model ().
Table 4. The impact of the climatic factors on agriculture in EU and analysed countries.
The probable matrix allocation on each variable of the risk factor model allowed the calculation of the risk representativeness averages for each variable, weighted averages for each analysed state in part according to the existing climate (IPCC classification at European level), and the effective risk-protection measures adopted by each country. This resulted in a classification of vulnerability to climate change applicable on the 1-4 scale, in which value 1 was allocated to Germany (the best defence system against climate change), value 2 was allocated to France (opening to the Atlantic Ocean and being more vulnerable to climate change than Germany), the value 3 was allocated to Poland (the country that managed to create certain functional mechanisms against natural calamities), and the value 4 was allocated to Romania, the country that is currently very affected by the calamities that occur with an increasing frequency (extreme temperature, floods).
The obtained data were introduced in a forecast procedure, with an average increase in the branch in line with the achievements reported by Eurostat for each of the four countries and EU28 during 2009-2018, as follows:
EU28’s branch (industry) growth: 33.82%;
Germany’s branch (industry) growth: 9.87%;
France’s branch (industry) growth: 20.11%;
Poland’s branch (industry) growth: 18.72%;
Romania’s branch (industry) growth: 143.8% (Eurostat, 2019).
The forecasted values for the 5 economic entities were rounded up for the first 4, and in the case of Romania, the actual growth opportunities of the agricultural branch were taken into account.
The investment impact on agricultural performance was quantified using the Eurostat database for the value of national accounts in agriculture during 2009–2018 (Economic Accounts for Agriculture ‐ Values at Constant Prices” and European Commission Citation2018).Footnote4
According to these data, positive growth trends of investments in agriculture have resulted for 4 of the 5 economic entities: EU 0.5% annual net investment growth (30.4% of GVA in 2017), Germany 2.5% (a net investment of 92.7 billion euros), Romania 2.5% (17.5% of national GVA) and Poland 2% (15.5% of national GVA). The case of France is atypical because it shows a 0.1% reduction in investment in agriculture calculated over the period 2009–2018 (36% of the national GVA).
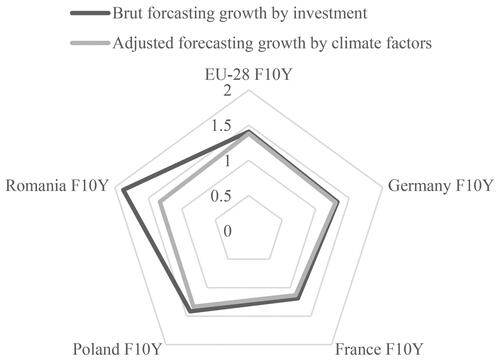
In order to determine the projected values for the next 10 years, a forecasting function based on the current data adjustment with the direct investment values in agriculture for each variable of the model was used, thus obtaining the crude prognostic growth by investment unitary series for each of the 23 variables of the model, which have entered in an adjustment mechanism according to the climate impact assessment of the model indicators (). Data in absolute figures were compared by the average method with the current values, resulting in trending model indicators for each entity in gross and adjusted predicted values. The statistical calculation method of the representative statistical media for each analysed economy was applied and the impact plot of the forecasting model based on the use of the investments and the impact of the climatic factors on the indicators from the national accounts and on the structural indicators of the model defined in the methodology ().
Figure 7. Cumulative effect of climatic factors and investments on agricultural performance. Source: author's contribution.
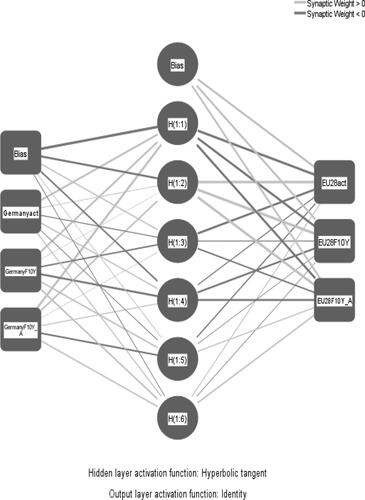
The current data, crude/brut forecasting and net forecasting, allow the construction of neural networks capable of highlighting the validation of the six hypotheses (H1-H6) in the comparative analysis between the EU28 and each of the four Member States under review. Using the multilayer perceptron model for Germany, the hyperbolic tangent for 22 layers of the dependent variables in connection to EU28 are forecasted and predict brut values based on investment allocation coefficients and values adjusted based on climatic impact in relation to the current and predicted covariates in the two options (brut and net) with an error for the scale of the 0.054 add-on variable at 0.106 in relation to the statistical error test on the covariance variables between 1.174 and 1.176, depending on the type of data series (current, adjusted) ().
Table 5. Test statistic model multilayer perceptron for Germany.
The configuration of the neural network for the case study was generated by SPSS 25 ().
Figure 8. Neural Network: The case of German agriculture. Source: author's contribution.
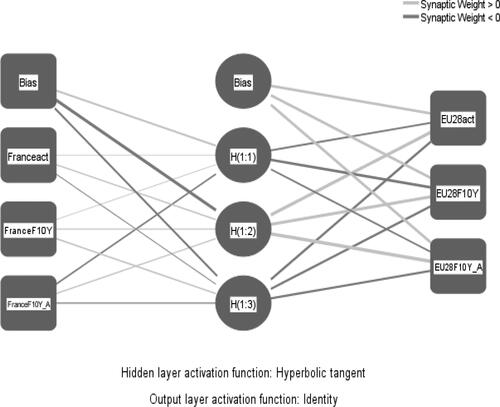
France faces to a 0 error for the scale of the dependent variable in relation to the statistical error test on the covariance variables between 0.764 and 2.073, depending on the data series (current, adjusted) ().
Table 6. Test statistic model multilayer perceptron for France.
The configuration of the neural network for the studied case is presented in , the degree of network dependence from the general model being smaller (the number of neural nodes being reduced by 4.5% compared to Germany).
Figure 9. Neural Network: The case of French agriculture. Source: author's contribution.
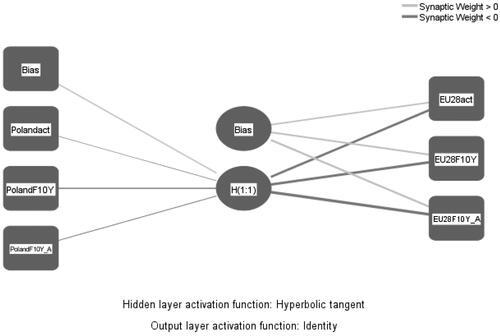
Poland benefits of 0 error for scale of the dependent variable in relation to the statistic error test on the covariance variables between 0.195 and 0.207, depending on the data series type (current, adjusted) ().
Table 7. Test statistic model multilayer perceptron for Poland.
The neuronal network configuration is shown in , the degree of network dependence from the general model being smaller (the number of neural nodes being reduced by 9.1% compared to France).
Figure 10. Neural Network: The case of Polish agriculture. Source: author's contribution.
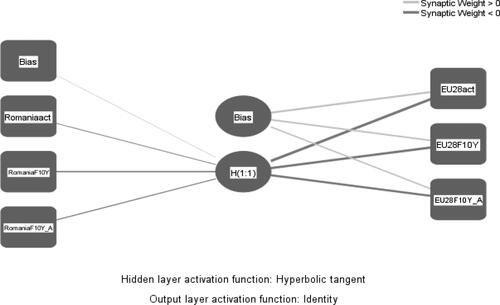
For Romania, the analysis leads to 0.001 error for the scale of the dependent variable in relation to the statistic error test on the covariance variables between 0.523 and 0.527, depending on the data series (current, adjusted) ().
Table 8. Test statistic model multilayer perceptron for Romania.
The degree of network dependence on the general model is lower (the number of neural nodes being reduced by 4.6% compared to Poland).
The working hypothesis regarding the relationship between the regional economic performance and the additional good management to sustainable economic growth (H1), demonstrated by the authors for the four individual cases in relation to the EU average, reflects the fact that, both in terms of the current situation and 10-year representative statistical series obtained by the authors through the statistical forecasting procedure IBM-SPSS 25, the development poles France and Germany have and will maintain a superior position compared to those of Poland and Romania. There is an unfavourable difference on the forecast series in all situations involving Romania (sustainable performance management maximized by strategic investments in agriculture) while Germany mainly benefits from the forecast line by improving the situation by using the same investment lever. In the case of France, the authors assessed vulnerabilities only in terms of the interaction between strategic investment, sustainable growth and climate change for the 10-year forecast horizon compared to the EU average.
Hypothesis 2 (H2), which was demonstrated by the authors, aims at the fact that economic performance is directly influenced by diversified agricultural production and higher distribution capacities in the territory. They are maximized in the cases of Germany and France, containing a significant share (synaptic weigh> 0) on the predicted trend series both in relation to the EU average and in relation to the analysed sample treated homogeneously. On the other hand, for Romania, the deficiencies regarding the logistics chain and the rhythmic distribution capacity requested by the big traders reside in a major structural difficulty that slows down the economic performance and significantly diminishes the sustainability of the agricultural branch.
From the H3 point of view of, the authors analysed the possibility of improving economic performance by creating the adaptive behaviour of agricultural entities in relation to climate change. This aspect is highlighted in , as a vulnerability for all 4 analysed states, finding at most a link with a low synaptic weight (in the cases of Germany and France) or lack of connection (in the cases of Romania and Poland). We consider that the approach of some European models of productive behaviour adapted to climate change can be a safety element to avoid the significant economic losses that Romania faces in 2020.
Figure 11. Neural Network: The case of Romanian agriculture. Source: author's contribution.
The percentage of the land use and the concentration of the producer associations/holdings (H4) can be an engine for improving the economic performance of the agriculture. This is seen in as a significant advantage for Germany and France and as a potential advantage for Poland. At this moment, Romania does not benefit from agricultural performance by increasing the degree of concentration of agricultural entities. In addition, their economic performance is well below the European average.
The last hypothesis demonstrated by the authors aims at optimizing the economic performance based on Markov chains of economic growth (H5) and brings to the fore the importance of the management through advanced management of critical vulnerabilities affecting agriculture and the use of levers to eliminate these vulnerabilities cyclical recurrence in the future. Once again, the analysis shows that Germany has higher synapse values on the forecast series than the European average, with France also having an advantage in terms of cyclical process management. Romania, due to structural deficiencies, is at a minimum level of performance and needs to change the managerial mentality and the strategies adopted for medium and long term agricultural development for the repositioning of agriculture as a basic branch of the national economy.
5. Conclusions
The model proposed by the authors is a novel one with immediate and wide applicability through the dimensioning of agricultural flows to investment realities and climate change with impact on agricultural development policies.
In the analysis, the working hypotheses were tested and validated, the direct and indirect connections of the agricultural development under the unfavourable climatic evolution were assessed objectively, the potential being determined over a 10-year forecast of the branch development.
The proposed model in this paper combines the financial, economic, social, structural elements of investing in the configuration of the branch in the EU economy. The model can be adopted by decision-making bodies to develop a sustainable agriculture strategy because it is based on concrete data, analysed over a representative period and uses financial projections of data over the next decade interval.
We believe that for the next 10 years, a new regional approach to sustainable agricultural development is required, which provides for the improvement of agricultural infrastructure for countries with highly productive land, professional training of top agricultural managers through exchanges of experience and practical guides available to local communities. All these will be able to dilute regional disparity and increase the average agricultural performance in Europe. On the other hand, the creation of climate change forecasting models and adaptive behaviour models can be a medium-term solution for improving the performance of all EU states in agriculture and implicitly for increasing the medium-term sustainable agricultural performance in the EU.
Disclosure statement
No potential conflict of interest was reported by the authors.
Additional information
Funding
Notes
1 Klaus Schwab, The Global Competitiveness Report 2018, World Economic Forum Reports 2018, 2018, https://doi.org/ISBN-13: 978-92-95044-73-9.
2 eurostat, “Agri-Environmental Indicators,” eurostat datbase, 2019, https://ec.europa.eu/eurostat/statistics-explained/index.php/Agri-environmental_indicators.
3 European Commission, Eurostat 2018 - Agriculture, Forestry and Fishery Statistics 2018 Edition, ed. Edward Cook, 2018th ed. (Luxembourg: Luxembourg: Publications Office of the European Union, 2018), https://doi.org/doi:10.2785/668439.
4 eurostat, “Economic Accounts for Agriculture - Values at Constant Prices,” 3.4.11b-20190314-e2667-ESTAT_LINUX_PROD DATA-EXPLORER_PRODmanaged23, 2019, https://appsso.eurostat.ec.europa.eu/nui/show.do?dataset=aact_eaa07&lang=en; European Commission, Eurostat 2018 - Agriculture, Forestry and Fishery Statistics 2018 Edition; eurostat, “Agri-Environmental Indicators.”
5 G. Lemaire, A. Franzluebbers, P. C. d F. Carvalho, and B. Dedieu, 2014. “Integrated crop–livestock systems: Strategies to achieve synergy between agricultural production and environmental quality.” Agriculture, Ecosystems & Environment 190 (2014): 4–8. https://doi.org/https://doi.org/10.1016/j.agee.2013.08.009.
6 Thomas Berger and Christian Troost, “Agent-Based Modelling of Climate Adaptation and Mitigation Options in Agriculture,” Journal of Agricultural Economics 65 (2013), https://doi.org/10.1111/1477-9552.12045.
7 Jeroen J L Candel et al., “Disentangling the Consensus Frame of Food Security: The Case of the EU Common Agricultural Policy Reform Debate,” Food Policy 44 (2014): 47–58, https://doi.org/https://doi.org/10.1016/j.foodpol.2013.10.005.
8 Stefano Balbi et al., “Modeling Trade-Offs among Ecosystem Services in Agricultural Production Systems,” Environmental Modelling & Software 72 (2015): 314–26, https://doi.org/https://doi.org/10.1016/j.envsoft.2014.12.017.
9 Marta Antonelli et al., “Global Investments in Agricultural Land and the Role of the EU: Drivers, Scope and Potential Impacts,” Land Use Policy 47 (2015): 98–111, https://doi.org/https://doi.org/10.1016/j.landusepol.2015.04.007.
10 Constantin Ciutacu, Luminiţa Chivu, and Jean Vasile Andrei, “Similarities and Dissimilarities between the EU Agricultural and Rural Development Model and Romanian Agriculture. Challenges and Perspectives,” Land Use Policy 44 (2015): 169–76, https://doi.org/https://doi.org/10.1016/j.landusepol.2014.08.009.
11 Clyde Fraisse et al., “AgroClimate - Tools for Managing Climate Risk in Agriculture,” Agrometeoros 24 (2015): 121–29.
12 Czyżewski A. and Smędzik-Ambroży K.,“The efficiency of the agricultural sector in Poland in the light output-input model”, Management, 19 (2015): 112-25.
13 A. Popescu et al., “Farm Structure and Land Concentration in Romania and the European Union’s Agriculture,” Agriculture and Agricultural Science Procedia 10 (2016): 566–77.
14 M. Clark and D Tilman, “Comparative Analysis of Environmental Impacts of Agricultural Production Systems, Agricultural Input Efficiency, and Food Choice,” Environmental Research Letters 12, no. 6 (2017): 1–11.
15 G Vlontzos and P M Pardalos, “Assess and Prognosticate Green House Gas Emissions from Agricultural Production of EU Countries, by Implementing, DEA Window Analysis and Artificial Neural Networks,” Renewable and Sustainable Energy Reviews 76 (2017): 155–62, https://doi.org/https://doi.org/10.1016/j.rser.2017.03.054.
16 Andrea Feher et al., “Convergence of Romanian and Europe Union Agriculture – Evolution and Prospective Assessment,” Land Use Policy 67 (2017): 670–78, https://doi.org/https://doi.org/10.1016/j.landusepol.2017.06.016.
17 Gheorghe H Popescu et al., “The Influence of Land-Use Change Paradigm on Romania’s Agro-Food Trade Competitiveness—An Overview,” Land Use Policy 61 (2017): 293–301, https://doi.org/10.1016/j.landusepol.2016.10.032.
18 Sandija Zeverte-Rivza, Aleksejs Nipers, and Irina Pilvere, “AGRICULTURAL PRODUCTION AND MARKET MODELLING APPROACHES,” in Roceedings of the 2017 International Conference “ECONOMIC SCIENCE FOR RURAL DEVELOPMENT,” 2017, 267–74.
19 John M Antle, James W Jones, and Cynthia E Rosenzweig, “Next Generation Agricultural System Data, Models and Knowledge Products: Introduction,” Agricultural Systems 155 (2017): 186–90, https://doi.org/https://doi.org/10.1016/j.agsy.2016.09.003.
20 Bruno Lanz, Simon Dietz, and Tim Swanson, “Global Economic Growth and Agricultural Land Conversion under Uncertain Productivity Improvements in Agriculture,” American Journal of Agricultural Economics 100, no. 2 (2017): 545–69, https://doi.org/10.1093/ajae/aax078.
21 Czyżewski A., Grzelak A., “Application of the input-output model for structural analysis on the example of the agricultural sector in Poland”, Management 22 (2018) pp. 285- 98.
22 Steffen Fritz et al., “A Comparison of Global Agricultural Monitoring Systems and Current Gaps,” Agricultural Systems 168 (2019): 258–72, https://doi.org/https://doi.org/10.1016/j.agsy.2018.05.010.
23 Czyżewski B., et.al., “Deadweight loss in environmental policy: the case of the European Union member states”, Journal of Cleaner Production 260 (2020) pp. 1-13.
References
- Antle, J. M., Jones, J. W., & Rosenzweig, C. E. (2017). Next generation agricultural system data, models and knowledge products: Introduction. Agricultural Systems, 155, 186–190. https://doi.org/https://doi.org/10.1016/j.agsy.2016.09.003
- Antonelli, M., Siciliano, G., Turvani, M. E., & Rulli, M. C. (2015). Global investments in agricultural land and the role of the EU: Drivers, scope and potential impacts. Land Use Policy, 47, 98–111. https://doi.org/https://doi.org/10.1016/j.landusepol.2015.04.007
- Balbi, S., Prado, A. d., Gallejones, P., Geevan, C. P., Pardo, G., Pérez-Miñana, E., Manrique, R., Hernandez-Santiago, C., & Villa, F. (2015). Modeling trade-offs among ecosystem services in agricultural production systems. Environmental Modelling & Software, 72, 314–326. https://doi.org/https://doi.org/10.1016/j.envsoft.2014.12.017
- Berger, T., & Troost, C. (2014). Agent-based modelling of climate adaptation and mitigation options in agriculture. Journal of Agricultural Economics, 65(2), 323–348. https://doi.org/https://doi.org/10.1111/1477-9552.12045
- Candel, J. J. L., Breeman, G. E., Stiller, S. J., & Termeer, C. J. A. M. (2014). Disentangling the consensus frame of food security: The case of the EU common agricultural policy reform debate. Food Policy, 44, 47–58. https://doi.org/https://doi.org/10.1016/j.foodpol.2013.10.005
- Ciutacu, C., Chivu, L., & Andrei, J. V. (2015). Similarities and dissimilarities between the EU agricultural and rural development model and romanian agriculture. Challenges and perspectives. Land Use Policy, 44, 169–176. https://doi.org/https://doi.org/10.1016/j.landusepol.2014.08.009
- Clark, M., & Tilman, D. (2017). Comparative analysis of environmental impacts of agricultural production systems, agricultural input efficiency, and food choice. Environmental Research Letters, 12(6), 064016–064011. https://doi.org/https://doi.org/10.1088/1748-9326/aa6cd5
- Czyżewski, A., & Smędzik-Ambroży, K. (2015). The efficiency of the agricultural sector in Poland in the light output-input model. Management, 19(1), 113–125. https://doi.org/https://doi.org/10.1515/manment-2015-0009
- Czyżewski, A., & Grzelak, A. (2018). Application of the input-output model for structural analysis on the example of the agricultural sector in Poland. Management, 22(2), 285–298. https://doi.org/https://doi.org/10.2478/manment-2018-0037
- Czyżewski, B., Matuszczak, A., Polcyn, J., Smędzik-Ambroży, K., Staniszewski, J., et.al. (2020). Deadweight loss in environmental policy: The case of the European Union member states. Journal of Cleaner Production, 260, 121064–121013., https://doi.org/https://doi.org/10.1016/j.jclepro.2020.121064
- European Commission. (2018). Eurostat 2018 - Agriculture, Forestry and Fishery Statistics 2018 Edition. edited by Edward Cook. 2018th ed. Luxembourg: Publications Office of the European Union. https://doi.org/https://doi.org/10.2785/668439.
- Eurostat. (2019). “Agri-Environmental Indicators.” eurostat datbase, https://ec.europa.eu/eurostat/statistics-explained/index.php/Agri-environmental_indicators.
- “Economic Accounts for Agriculture - Values at Constant Prices.” 3.4.11b-20190314-e2667-ESTAT_LINUX_PRODDATA-EXPLORER_PRODmanaged23, 2019. https://appsso.eurostat.ec.europa.eu/nui/show.do?dataset=aact_eaa07&lang=en.
- Feher, A., Goșa, V., Raicov, M., Haranguș, D., & Condea, B. V. (2017). Convergence of Romanian and Europe Union Agriculture – Evolution and prospective assessment. Land Use Policy, 67, 670–678. https://doi.org/https://doi.org/10.1016/j.landusepol.2017.06.016
- Fraisse, C., Andreis, J. H., Borba, T., Cerbar, V., Gelcer, E., Pavan, W., Pequeno, D., Perondi, D., Shen, X., Staub, C., Uryasev, O., & Wagner, A. P. (2016). AgroClimate - Tools for managing climate risk in agriculture. Agrometeoros, 24(1), 121–129. https://doi.org/https://doi.org/10.31062/agrom.v24i1.24887
- Fritz, S., See, L., Bayas, J. C. L., Waldner, F., Jacques, D., Becker-Reshef, I., Whitcraft, A., Baruth, B., Bonifacio, R., Crutchfield, J., Rembold, F., Rojas, O., Schucknecht, A., Van der Velde, M., Verdin, J., Wu, B., Yan, N., You, L., Gilliams, S., … McCallum, I., et al. (2019). A comparison of global agricultural monitoring systems and current gaps. Agricultural Systems, 168, 258–272. https://doi.org/https://doi.org/10.1016/j.agsy.2018.05.010
- Lanz, B., Dietz, S., & Swanson, T. (2018). Global economic growth and agricultural land conversion under uncertain productivity improvements in agriculture. American Journal of Agricultural Economics, 100(2), 545–569. https://doi.org/https://doi.org/10.1093/ajae/aax078
- Lemaire, G., Franzluebbers, A., Carvalho, P. C. d F., & Dedieu, B. (2014). Integrated crop–livestock systems: Strategies to achieve synergy between agricultural production and environmental quality. Agriculture, Ecosystems & Environment, 190, 4–8. https://doi.org/https://doi.org/10.1016/j.agee.2013.08.009.
- Popescu, A., Alecu, I. N., Dinu, T. A., Stoian, E., Condei, R., & Ciocan, H. (2016). Farm structure and land concentration in Romania and the European Union’s Agriculture. Agriculture and Agricultural Science Procedia, 10, 566–577. https://doi.org/https://doi.org/10.1016/j.aaspro.2016.09.036
- Popescu, G. H., Nicoale, I., Nica, E., Vasile, A. J., & Andreea, I. R. (2017). The influence of land-use change paradigm on Romania’s agro-food trade competitiveness—An overview. Land Use Policy, 61, 293–301. https://doi.org/https://doi.org/10.1016/j.landusepol.2016.10.032
- Schwab, K. (2018). The global competitiveness report 2018. World Economic Forum Reports 2018, 1, 1–671. ISBN-13:978-92-95044-73-9.
- Vlontzos, G., & Pardalos, P. M. (2017). Assess and prognosticate green house gas emissions from agricultural production of EU Countries, by implementing, DEA window analysis and artificial neural networks. Renewable and Sustainable Energy Reviews, 76, 155–162. https://doi.org/https://doi.org/10.1016/j.rser.2017.03.054
- Zeverte-Rivza, S., Nipers, A., Pilvere, I. (2017). Agricultural production and market modelling approaches. In Roceedings of the 2017 International Conference “ECONOMIC SCIENCE fOR RURAL DEVELOPMENT,” 267–274.