
 ?Mathematical formulae have been encoded as MathML and are displayed in this HTML version using MathJax in order to improve their display. Uncheck the box to turn MathJax off. This feature requires Javascript. Click on a formula to zoom.
Abstract
Tourism significantly increased in the EU-28 in recent years. In the present study, the 28 member states were analysed for the period between 2012 and 2018, depending on data availability. The authors tested empirically whether economic convergence took place from the perspective of three types of revenue from the tourism sector. The contribution of tourism revenue to economic growth varied across different countries. The analysis of β and σ-convergence showed a low-intensity and slow process based on the revenues generated by accommodation, transport, and restaurant and coffee shop services. Contrary to expectations, the factors analysed did not strongly support the EU-28 tourism sector convergence. We argue the existence of a positive and direct relationship between tourism and economic growth. The convergence did exist but its pace was sometimes slow and of low intensity, preceded by periods of divergence. The three types of services generated tourism revenue but not decisively. The paper complements the literature using indicators that strictly describe the tourism sector and brings into focus findings that contradict those from other studies. Our conclusion is that convergence was not accelerated, but slow and it was not determined by tourism factors but by related ones.
1. Introduction
Tourism is one of the major economic activities in many parts of the world (Butnaru & Haller, Citation2017; Grubor et al., Citation2019; Miandehi & Masrouri, Citation2013; Sahakyan & Ghazaryan, Citation2016; WTTC, Citation2016, Citation2019), with high potential of job creation. It is the main source of revenue for both public administrations and local residents (Osti et al., Citation2011), attracting investments and foreign capital (Cortéz-Jiménez, Citation2008). It is also a factor of destination regeneration (Aksöz & Bâc, Citation2012), characterised by positive growth rates for several consecutive years (WTTC, Citation2016, Citation2019). Unfortunately, it is difficult to regulate (Font, Citation2002). The current trend in tourism is that tourists give up the classic holidays for much more complex ways of spending their free time and the interest in this sector is growing. Each destination is unique and tourists evaluate it based on the experiences enjoyed and the services provided (Rodríguez & Rivadulla, Citation2012; Vellecco & Mancino, Citation2010). These aspects determine people’s choices (Yeoman, Citation2008).
To analyse the economic growth of the EU-28, the authors employed the method of convergence. The paper focuses on an increasingly important activity for economic growth, i.e. tourism. Tourism impact on economic growth and whether it brings about the economic convergence of European countries were studied by reference to variables such as tourists’ expenses on transport, accommodation, and restaurant and coffee shop services. All expenses incurred by tourists in the territory of the visited country are, as the case may be, direct, indirect or induced revenues, which contributes to the substantial growth of the economy. Production intended for the tourism sector is an important component of a country’s GDP. Increasing its share not only positively influences the economic growth rate but also allows for regional convergence.
Hughes and Allen (Citation2005) argue that the potential to attract tourists is an attribute needed to reduce growth gaps and to harmonise European tourism. Economic convergence implies that heritage is an essential element in increasing consumption and enhancing capital-based development complexes (Apostolakis, Citation2003), that is, all factors that allow progress and are related to the financial aspects of the economy. Convergence is important because tourism "colonizes" territories and perpetuates an order of center–periphery type within which the periphery owns the heritage that the center administers and imposes rhythm, induces meanings and gives sense to social life (Nogués-Pedregal, Citation2012). Tourist flows tend to be wider among countries located in the geographical area in which the same language is spoken and to which the access is easy.
The paper is configured as follows: the first section presents the literature review; the second section focuses on the methodological foundation and research methodology; the third section is for discussions and conclusions. The literature review targets the current state of knowledge in the field. The methodology outlines the starting point of the research. The last section presents briefly the main findings and the research limitations.
2. Literature review and research hypothesis development
2.1. Tourism and economic growth
The impact of tourism on economic growth has been examined by numerous authors: Alfaro Navarro et al. (Citation2020); Antonakakis et al. (Citation2019); Calero and Turner (Citation2020); Cheng and Zhang (Citation2020); Estol and Font (Citation2016); Ivanov and Webster (Citation2013); Neuts (Citation2020); Nunkoo et al. (Citation2020); Roudi et al. (Citation2019); Santamaria and Filis (Citation2019); Sokhanvar (Citation2019); Tang and Tan (Citation2016); Tang (Citation2020); Vergori and Arima (Citation2020) and others. Tourism contributes significantly to economic growth all over the world (Figini & Vici, Citation2010), has a strong impact on the environment (Hall, Citation2011), facilitates, when practiced responsibly, sustainable development, and has a remarkable contribution to progress, since there is an overlap between economically developed countries and those with developed tourism sector (Cárdenas-García et al., Citation2015; Kum et al., Citation2015; UNCTAD., Citation2013; UNWTO., Citation2017). Antonakakis et al. (Citation2019) note that the hypothesis of tourism as a growth factor is verified in the case of underdeveloped countries, very bureaucratic, with low tourism specialization.
Tourism development depends on numerous economic, social and infrastructural factors, like transport (Borodako & Rudnicki, Citation2014), geopolitical conditions (Santamaria & Filis, Citation2019), foreign direct investments (Sokhanvar, Citation2019), culture, peace, security, infrastructure, visa facilities, natural environment, people, tourist number, education, income level, price level (Khan et al., Citation2020), the country dimension and development (Lin et al., Citation2019), cultural heritage and natural resources (Dugulan et al., Citation2010) as well as many other factors related to economic growth and development (Nunkoo et al., Citation2020; Santamaria & Filis, Citation2019; Sokhanvar, Citation2019).
An extension of Solow’s (Citation1956) model applied to a sample of 109 countries led to the conclusion that in the absence of additional progress factors, tourism can no longer account for economic growth even in predominantly tourist countries, which means that, for a long-term contribution to economic growth, tourism is only effective when integrated into a broad development strategy (Du et al., Citation2016). Tourism positive contribution to growth is now certain and can be direct, indirect or induced. However, its effects on revenue are difficult to estimate (Lemma, Citation2014) and sometimes on economic growth (Xie & Tveterås, Citation2020).
In some countries, such as the CEEC, there is a poor ability to understand the processes of economic transformation (Urbanc et al., Citation2004). These countries have undergone profound changes that altered their landscapes, tourism and growth. However, tourism makes the labour market more efficient and helps the countries achieve real convergence with the EU average, despite the fact that in the beginning it was a mechanism of regional divergence, segregating European states into winners and losers (Aguayo, Citation2005).
As we have already seen, tourism plays an important part in economic development. In addition, research has shown that it positively impacts economic growth by reducing development gaps. Because of the above, the following research hypothesis was formulated:
H1: There is a direct and positive relationship between tourism, measured by the income attracted from accommodation, transport and restaurant services, and the EU-28 economic growth
2.2. Convergence and economic growth models
Convergence theory provides a real and versatile framework for analysis (Dolecki, Citation2009). Convergence has a strong impact on growth models (Cartone et al., Citationin press; Kashnitsky et al., Citation2020; Kvedaras & Cseres-Gergely, Citation2020; Lee, Citation2020) and is obvious on many levels of economic analysis (Kong et al., Citation2017). As economic convergence deepens, risks decrease (Cincibuch et al., Citation2008). The concept of convergence was coined by Solow (Citation1956) and was further tested and developed by Baumol (Citation1986), Barro & Sala-I-Martin (Citation1992), Levine and Renelt (Citation1992), and others. Convergence, closely related to economic growth, occurs especially among homogeneous groups of countries, whereas divergence manifests itself among heterogeneous ones (Gáspár, Citation2010). Growth and convergence are interdependent and mutually influential because they require harmonisation as a sine qua non condition for future progress (growth).
The results from research on convergence are highly dependent on the methods employed. Neo-classical theory postulates convergence and theoretical models support the idea of unconditional convergence among the EU member states. Soukiazis (Citation2000) and Geppert and Stephan (Citation2008) consider that only β and σ-convergence cumulative analysis can capture convergence and divergence. Sigma-convergence originates from neo-classical theory and was first used in relation to β-convergence by Sala-i-Martin (Dvoroková, Citation2014).
Barro & Sala-I-Martin (Citation1995) findings show that absolute or unconditional convergence is possible. Conditional convergence means that economies reach their own equilibrium state during the development process (Drabo, Citation2011) by reducing the gaps, that is, poor countries will catch up with the rich if and only if the former grow at a higher rate. The conditional convergence is not possible only when the accelerate growth is not sustainable (Nell, Citation2020). This is the relative convergence, a concept coined by Phillips and Sul (Citation2007). Poor countries have certain advantages over the rich in terms of economic growth and convergence is possible, but it is not automatically achieved because the pace of bridging the gaps varies greatly from country to country (Ville, Citation2004). Given the relevance of the studies using convergence as the method of analysis, the following research hypothesis is formulated:
H2: Economic convergence stimulates economic growth in the EU-28 by the expansion of tourism revenues
2.3. The relationship between tourism, convergence and growth in economic literature
Economic growth is directly related to convergence (Coccia, Citation2017; Quah, Citation1996) and perceived as a return to normality.
The way in which relative economic growth is measured is indicated, for example in the case of Italy, by a simple, linear model that shows how an economic system evolves compared to others. This approach can detect whether the economic system goes through an upward process, i.e. economic growth, development, or, conversely, a downward process, i.e. underdevelopment (Coccia, Citation2017).
Growth is accounted for by many influencing factors intensely studied. Technological progress, structural economic policies, institutions, human capital, R&D activities, commercial policies, financial framework, they all have an impact on economic growth through conditional convergence (Bassanini & Scarpetta, Citation2003). Cohesion policies play an important part to the European growth model, but their benefits are not equally distributed among the member states; it is convergence that determines homogenisation (Sîrghi, Citation2010). Economic growth influences revenue distribution gaps, and vice versa (Kvedaras & Cseres-Gergely, Citation2020; Lee, Citation2020). Using the data for the period between 1960 and 1995 and calculating β and σ-convergence, Yin et al. (Citation2003) show that, except for the 1980–1985 interval of slight divergence, convergence was predominant and uninterrupted in the European Union. However, the EU failed to absorb disparities. Beta and sigma-convergence confirmed that the poor European states had higher growth and convergence rates than the rich and their economies became more homogeneous after the 2007 financial crisis (Dvoroková, Citation2014; Siljak, Citation2015). As in the case of the United States, β and σ-convergence show that economic growth rates are higher and more balanced in rich countries compared to poor ones (Barro & Sala-I-Martin, Citation1992; Young et al., Citation2008). That is also true for Europe. Conventional theory of convergence polarises countries into poor and rich (Simionescu, Citation2014) and unconditional β-convergence shows that poor regions grow economically faster than the rich (Lundberg, Citation2017; Petrakos & Artelaris, Citation2009). The growth rates of neighbouring regions are also important (Le Gallo et al., Citation2003).
Tourism convergence study using β and σ-convergence shows that neither the number of tourists nor the number of nights had any influence on the economic growth rate between 2003 and 2011 (Vojinović et al., Citation2016).
The opposite of convergence is divergence. It manifests itself similarly to convergence (Marzo, Citation1998). Barro and Sala-i-Martin’s model shows that divergence precedes convergence. When Barro and Sala-i-Martin’s model was applied to the Greek post-crisis economy, the absolute convergence results indicated that convergence trend had been decreasing, inequalities subsisted and regional disparities increased (Koudoumakis et al., Citation2019).
Taking into account the importance of convergence in analysing economic growth, we set out to test the following research hypothesis:
H3: Tourism revenues are a convergence factor for the EU-28
3. Methodology
3.1. Materials
We decided to study tourism convergence with the help of tourism revenues because previous research had led us to the conclusion that the convergence process is supported by revenues and not by the size of tourism activities. The main sources of tourism revenues are: accommodation services, transport services for tourist purposes and services provided by restaurants and coffee shops. These revenues have been recently estimated, and the estimation has been relatively difficult, hence the short time series and lack of data in some member states (the data source is Eurostat, and the research is EU28-oriented). In the literature, convergence analysis according to tourism revenues by source of origin is poor, almost non-existent. Consequently, our analysis fills the gap in the literature. In the case of the first two indicators analysed (the revenues from accommodation and transport services), the lack of data for the UK does not influence the research, instead it brings it closer to the post-Brexit reality. The lack of data for Poland, Romania and Sweden does not have a major impact on the research result, because these countries are similar from a tourist point of view to other EU-28 member states. A major difference between their tourism sectors and those of the states for which we analysed the convergence would have significantly distorted the result obtained.
In the case of the third indicator, revenues from restaurant and coffee shop services, there are many missing data, and this would induce some influence on the research result only if it deviated far from the average, which is unlikely. In addition, the added value of these services is much lower compared to the other two, and the values themselves are interpretable, being difficult to estimate how much of this value is tourists’ contribution. In order to avoid major errors in the analysis, we grouped the European countries and worked with models, and we included in each model certain sets of countries.
The indicators we considered relevant generated varied and wide-ranging economic consequences. The money spent by tourists on accommodation and, implicitly, the number of nights spent in a certain territory became direct revenue from tourism. Tourists’ transport expenses in the territory of the visited country also became revenue, but indirectly, due to transport. Similarly, tourists’ expenses in restaurants and cafés represented indirect revenue. The more attractive a destination, the more tourists are motivated to spend more money, which means increasing tourism revenue. The consequence will be the stimulation of growth, directly and indirectly, once the effects have a bearing on other sectors.
This paper addresses the relationship between several types of services both specific and related to the tourism sector from the perspective of economic growth generated by per capita tourism revenue. The services are represented by three categories: accommodation, transport, and restaurants and cafés. All three of them contribute to tourism revenue.
3.2. Methods
Considering the theoretical aspects of convergence as well as the studies on economic growth based on convergence analyses, the calculation method of β-convergence took into account the equation proposed by Baumol (Eq.1). To analyse tourism phenomenon in the EU-28, one can measure β-convergence based on the amount of per capita tourism revenue and calculate it by means of the following equation:
(Eq. 1)
(Eq. 1)
where:
T is the studied time interval,
is per capita tourism revenue at the end of the time period,
is the initial time period,
is per capita tourism revenue at the beginning of the time period,
β is the slope parameter,
ε is the statistical error.
In a study by Dvoroková (Citation2014), some changes were made to the equation proposed by Baumol (Citation1986). The new model is the following (Eq.2):
(Eq. 2)
(Eq. 2)
where α is a constant level.
When measuring convergence, it is necessary to calculate σ-convergence (first used by Barro & Sala-I-Martin, Citation1992, along with β-convergence). It highlights the dispersion with respect to the average or the gradual reduction of differences between two or more chronological series (Iancu, Citation2009). Sigma-convergence uses as indicator the coefficient of variation for per capita revenue from tourism (see Iancu, Citation2009) based on the following model (Eq.3)
(Eq. 3)
(Eq. 3)
where N is the number of the 28 member states.
The model proposed in Equation 3 characterises the level of convergence by measuring the dispersion of per capita tourism revenue for one year by means of cross-sectional series. In this paper, the EU-28 member states are considered cross-sectional series. Therefore, in agreement with Iancu (Citation2009), σ-convergence is relevant when comparison is made between countries with similar degree of economic development. To this end, chronological series (discrete time interval t and t + T) are used to characterise convergence evolution (trend). When dispersion decreases over a period of time (that is, the value of the indicator diminishes over time), convergence takes place, σt+T < σt. When dispersion increases, divergence takes place, σt+T > σt.
4. Results and discussions
4.1. The estimation of econometric model for β and σ-convergence
Mathematically, β-convergence model presented above can be expressed by Eq.4:
(Eq.4)
(Eq.4)
where α is a constant, β is the slope, ε is the error, T = 7 years (the number of years corresponding to the 2012–2018 time series, period for which statistical data are available from Eurostat (Citation2019)).
In our study, we used data on tourism revenue from three categories of services:
accommodation services in tourist accommodation units for 24 member states. Statistical data are missing for Poland (2018), Romania (2018), Sweden (2012, 2013, 2017, 2018), and the United Kingdom (2012 and 2014–2018). The four countries were excluded from the analysis;
tourist transport services for 24 member states. Statistical data are missing for Poland (2018), Romania (2017), Sweden (2013, 2013, 2017, 2018), and the United Kingdom (2012 and 2014-2018);
restaurant and coffee shop services for 14 member states. Statistical data are missing for Austria (2012-2018), Belgium (2012-2015), Cyprus (2012), Denmark (2012-2018), Germany (2012-2017), Ireland (2012-2018), Italy (2012-2018), Luxembourg (2017, 2018), Malta (2012-2018), Poland (2018), Romania (2018), Slovakia (2012), Sweden (2012-2018), and the United Kingdom (2012 and 2014-2018).
In Equation 4 we used per capita values of tourism revenue for the targeted period using the data on population for the EU-28. The results for the values of natural logarithms are summarized in .
Table 1. β-convergence of tourism services in the EU-28 from 2012 to 2018.
As can be seen from , the linear equations are of the form y = α + β x (where y is the dependent variable, and x are the independent variables).
Figure 1. Graphical representation of β-convergence of revenue from tourist accommodation services.
Source: Authors’ calculations
Primary data: https://ec.europa.eu/eurostat/data/database
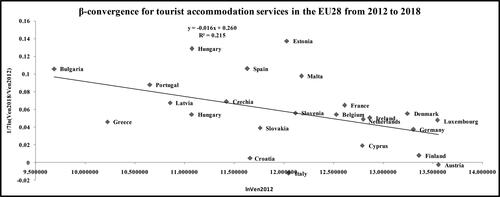
Figure 2. Graphical representation of β-convergence of revenue from tourist transport services.
Source: Authors’ calculations
Primary data: https://ec.europa.eu/eurostat/data/database
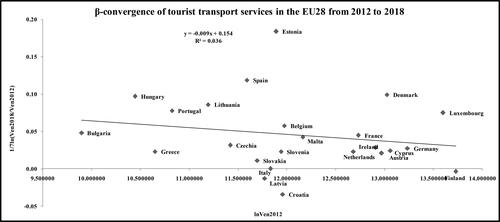
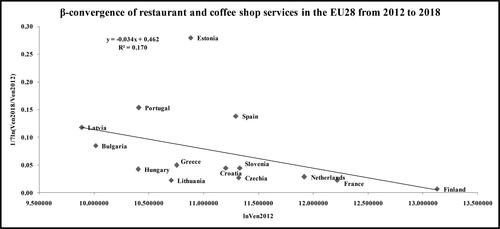
Figure 3. Graphical representation of β-convergence of revenue from restaurants and cafés.
Source: Authors’ calculations
Primary data: https://ec.europa.eu/eurostat/data/database
shows the following: R, R2, F-test sig., Durbin–Watson test, β, α and Sig. t-test (p-value) for tourism services in the EU-28 corresponding to the 2012–2018 time series.
Table 2. Results of the econometric model for β-convergence for tourism services in the EU-28 from 2012 to 2018.
As can be seen, the correlation coefficient (R) indicates how strongly the variables in the model are correlated. The R value ranges between 0.166 and 0.464, which denotes a moderate positive correlation. The value of the coefficient R2 (0.215, 0.036 and 0.170) shows that 21.5% of the tourism sector growth is attributed to the increase of revenues from accommodation services, 3.6% to the increase of transport revenues, and 17% to the increase of the revenues from restaurant and coffee shop services. Together, the variables analysed have a contribution of 42.1% to tourism sector growth. These are direct effects, without being complete. The remaining 57.9% is the contribution of indirect and induced effects, also of revenues generated by domestic tourism.
The Durbin–Watson test is a measure of autocorrelation (also called serial correlation) in residuals from regression analysis. The calculation formula for the Durbin–Watson test is given in Eq.5:
(Eq. 5)
(Eq. 5)
where T is the number of observations and et is the error term.
For tourist accommodation services the linear regression analysis indicates a significant negative correlation between the two variables (r = −0.016, p = 0.022). Therefore, a one-unit change in the value of independent variable x will result in a value change of dependent variable y by −0.016. Sig. F. is also 0.022, which means that the model is statistically significant and more efficient than a model without predictor. A no-predictor model is one without independent variables, an intercept-only model.
For tourist transport services the linear regression analysis indicates an insignificant negative correlation between the two variables (r = −0.009, p = 0.438). This, together with the significance level of F-test (0.438), higher than 0.05, shows that null hypothesis H0 cannot be rejected. (Null hypothesis H0 means that there is no association between the independent variable and the dependent one. When the significance value of t-test, also called p-value, is higher than 0.05, we cannot be 95% sure that the independent variable has an effect on the dependent one). So, unfortunately, the hypothesis that there is a relationship between the independent variable and the dependent one cannot be confirmed.
For restaurant and coffee shop services the linear regression analysis indicates an insignificant negative correlation between the two variables (r = −0.034, p = 0.143) and shows that null hypothesis H0 cannot be rejected. The hypothesis of a relationship between the two variables cannot be confirmed.
The mathematical models for β-convergence of tourism revenue by categories of tourism revenue are shown in :
Table 3. Presentation of mathematical models for Eq.4.
Because of the negative values of slope β (−0.016; −0.009; −0.034; −0.061), for the 24 member states’ accommodation and tourist transport services as well as for the 14 member states’ restaurant and coffee shop services analysed from the perspective of the 2012–2018 time series, the negative sign of parameter β indicates the inverse relationship between the average annual growth rate of per capita tourism revenue for the time period T = 7 years and the initial level of per capita tourism revenue in the year t0 = 2012. The β-convergence model can only be used retrospectively to analyse the evolution of economies due to tourism for the above-mentioned categories of tourism services. The model does not include explanatory analyses for future revenue from tourism. The tendency of poor economies to catch up with the rich is mirrored by both the decrease in per capita tourism revenue dispersion across countries and the negative sign of the β-convergence annual rate of per capita tourism revenue of the sample countries. They reach equilibrium simultaneously, that is, there is a tendency towards convergence (see Iancu, Citation2009). In and yi has negative values for certain countries (Austria and Italy for tourist accommodation services; Croatia, Finland and Latvia for tourist transport services), i.e. they do not experience β-convergence of tourism revenue by categories of tourism revenue. Some countries have a top convergence because the values of the points corresponding to the model are above the curve that corresponds to linear correlation. The points below the curve correspond to the countries for which bottom convergence took place.
In the following, we present the σ-convergence model using variation coefficient σt, a value indicating the level of convergence by measuring tourism revenue dispersion.
The mathematical model is that in Equation 3 (see Iancu, Citation2009) and can be expressed as follows (Eq.6):
(Eq. 6)
(Eq. 6)
shows the values of σt estimated for the three categories of tourism services in the EU-28 from 2012 to 2018:
Table 4. Values of σt estimated between 2012 and 2018.
The high values of σ-convergence mean that tourism revenue dispersion for the EU-28 was high between 2012 and 2018. Given the above, a more detailed analysis is needed in order to measure convergence or divergence depending on the values obtained for σt for the following pairs of time intervals: (2012-2013); (2013-2014); (2014-2015); (2015-2016); (2016-2017); (2017-2018); (2012-2018).
As a result of solving the linear equations of the form y = α + β x, negative values were obtained for Austria and Italy (tourist accommodation services), Croatia, Finland, and Latvia (tourist transport services). These countries had a very slow and negative growth rate. Thus, in order to calculate σ-convergence for the pairs of time intervals mentioned above, some countries were excluded from the analysis. In the first stage, for tourist accommodation services the number of countries was reduced from 24 to 18 (because the values were negative for Austria, Denmark, and Germany in 2012 and 2013, for Luxembourg in 2012, 2013, and 2014, and for Finland and Ireland in 2012). For tourist transport services the number of countries was reduced from 24 to 22 (negative values for Finland and Luxembourg in 2013 and 2014). For restaurant and coffee shops services the number of countries was reduced from 14 to 11 (negative values for Finland in 2012, 2013, 2015 and 2016, and for France and Netherlands in 2012).
indicates the total values of σt in stage 1. represents the curves for each category of tourist services.
Figure 4. Graphical representation of total values of σt in stage 1. Source: Eurostat (Citation2019).

Table 5. Total values of σt in stage 1.
As can be seen from and , the values of σt by categories of tourism services for the interval between 2012 and 2018 and for the above pairs of time intervals are fluctuating. For tourist accommodation services the year 2016 is marked by a slight decrease, which means that the interval between 2015 and 2017 could be divided into two economically significant periods of time: the pre-crisis emigration and the post-crisis emigration. The EU countries faced the emigration crisis, which caused instability for both tourism service providers and consumers. Therefore, σt registered the highest value in 2018. We consider that convergence did take place between 2012 and 2018 and the negative value of β coefficient = (−0.016) indicates the same thing. Analysing σt by pairs of time intervals, divergence took place between 2012 and 2018, since σ2012> σ2013> σ2014 and σ2015> σ2016, but also convergence, since σ2014<σ2015 and σ2016.
In conclusion, per capita revenue from tourist accommodation services in the 18 countries influenced to a small extent the economic development of their tourism sector and convergence took place at a slower pace. For tourist transport services the year 2014 was critical, since no σ-convergence was registered between 2014 and 2015, as indicated by the negative values of y = α + β x. Thus, the interval between 2012 and 2018 could be divided into two periods of time: the 2012-2014 divergence, since σ2012>σ2013>σ2014, and the 2015-2018 period, with both divergence (σ2015>σ2016) and convergence (σ2017<σ2018). Moreover, 2018 was the year with the highest value of σt. Therefore, convergence took place between 2012 and 2018, as indicated by the negative value of β coefficient = (−0,009) as well. Per capita revenue from tourist transport services influenced to a small extent the economic development of the tourism sector and convergence was slower. For restaurant and coffee shop services the highest value of σt was registered in 2018. Thus, convergence took place between 2012 and 2018, as indicated by the negative value of β coefficient = (−0.034). Analysing σt by pairs of time intervals, convergence took place between 2012 and 2018, since σ2012<σ2013,σ2014<σ2015 and σ2016<σ2017<σ2018. However, σ2013>σ2014 and σ2015>σ2016, which shows divergence. Per capita revenue from restaurant and coffee shop services most influenced the economic development of the studied countries, even though convergence was slower.
In the second stage, the number of countries was once again reduced from 22 to 8, since no σ-convergence was registered between 2014 and 2015. That is why 14 countries were excluded from the analysis (Austria, Belgium, Croatia, Cyprus, Denmark, Estonia, France, Germany, Ireland, Latvia, Malta, Netherlands, Slovenia, and Spain). The result of the linear equation of the form y = α + β x had negative values for the year 2014.
shows the total values of σt in stage 2. represents the curves for σt by categories of tourism services.
Figure 5. Graphical representation of total values of σt in stage 2. Source: Eurostat (Citation2019).

Table 6. Total values of σt in stage 2.
As can be seen from and , for tourist transport services the values of σt for the 2012-2018 interval are slightly decreasing between 2012 and 2013 and also between 2014 and 2017, while slightly increasing from 2013 to 2014. The 2017-2018 interval is marked by an increase and the value reached the maximum level possible for the period under study. Thus, 2018 was the year with the highest value of σt. Consequently, we consider that convergence took place between 2012 and 2018, which is also indicated by the negative value of β coefficient = (−0.009), as stated above. Calculating σt by time intervals, divergence took place from 2012 to 2013 and from 2014 to 2016, since σ2012>σ2013 and σ2014>σ2015> σ2016, while convergence was registered from 2013 to 2014 and from 2016 to 2018, since σ2013<σ2014 and σ2016<σ2017<σ2018.
In conclusion, in the second stage, per capita revenue from tourist transport services influenced to a small extent the economic development of the countries under study and convergence took place at a slow pace.
4.2. Discussions, testing hypotheses and interpreting results
We have seen so far that hypothesis H1 proves to be true through both the findings of our empirical analysis and those to be found in literature. Numerous studies investigated the relationship between tourism and economic growth (Bevilacqua & Casti, Citation1989; Cárdenas-García et al., Citation2015; Ivanov & Webster, Citation2013; Kum et al., Citation2015; Tang & Tan, Citation2016) and argued the positive mutual influence between the two processes. Tourism revenue for the sample countries had an upward evolution, that is, an increase in the influence of the tourism sector on the GDP and consequently on economic growth. The direct and positive relationship between tourism revenue and economic growth in the EU-28 proves hypothesis H1 to be true, that is, tourism positively impacts economic growth.
For the tourism sector, hypothesis H2 also proves true, therefore economic convergence stimulates economic growth in the EU-28 by the expansion of tourism revenues. The general trend is towards convergence, but the process is slow in the cases here discussed. Speed varies and is low.
With regard to the three categories of tourism services, some of the 28 countries were not very well positioned compared to others that experienced an advancement. The tourism services under discussion did generate tourism revenue, but not decisively. The literature comes to supports this hypothesis. Developed countries have higher growth potential than developing ones, as also evidenced by studies conducted by Barro & Sala-I-Martin (Citation1992), Kutan and Yigit (Citation2004), and Young et al. (Citation2008). Convergence of the latter depends on a series of growth factors and tourism is one of them (see Bassanini & Sarpetta, 2003; Juselius & Ordóñez, Citation2009; Le Gallo et al., Citation2003; Longhi & Musolesi, Citation2007; Paas & Vahi, Citation2012; Rodríguez-Benavides et al., Citation2014; Yin et al., Citation2003).
Hypothesis H3 by which we tested whether tourism revenues are a convergence factor is confirmed by the values of β coefficient, a result also supported by the literature. For all three types of services the relationship between variables is negative, which is also confirmed by linear regression analyses, that is, a one-unit change in tourism revenue entails the reduction of revenues from related activities. Theoretically, the analysed services are of major importance for the development of the tourism sector. In the case of the EU-28, even though we have argued for a slow convergence process, we noticed that each increase by one unit in tourism revenue causes a revenue decrease by 0.016 for accommodation services, by 0.009 for transport services, and by 0.034 for restaurant and coffee shop services. There is an inertial resistance on the part of the EU-28 countries. The transport sector seems to react faster under the influence of tourism growth, followed by the accommodation sector. The beneficial pressure exerted by the increase in tourism revenue will result in a faster rate of convergence, a conclusion reinforced by the literature already mentioned (Borodako & Rudnicki, Citation2014; Iancu, Citation2009; Longhi & Musolesi, Citation2007; Merler, Citation2016; Petrakos & Artelaris, Citation2009; Sperlich & Sperlich, Citation2012). Hypothesis H3 is thus validated, that is, tourism revenues are a convergence factor for the EU-28.
4.3. Discussion on future research directions and limitations
Studying the EU-28 from the perspective of revenues attracted from tourism through various specific services, we noted an increase between 2012 and 2018, with few exceptions. For example, the revenue from tourist accommodation services increased, with some fluctuations, in all European states. Only Latvia recorded a decrease towards the end of the period. The revenue from tourist transport services decreased in Cyprus, Netherlands and Slovakia. The revenue from restaurant and coffee shop services decreased in Bulgaria, Cyprus, Hungary and Latvia. The last category was superior to the other two only in Bulgaria. Tourist accommodation services brought the highest amount of revenue to the Czech Republic, Hungary, Lithuania, Poland, Slovakia, and Slovenia, while tourist transport services had the most important contribution in Croatia and Estonia. These values show that the 28 member states experienced approximately the same upward trend in terms of tourism revenue, which indicates their tendency towards tourism convergence. The revenues from the three types of services were increasing, but nonetheless, they were still lower than the values in the developed European countries, which shows that the EU-28 experienced, at least towards the end of the period, a slow convergence process. The conclusion is supported by the results from β and σ-convergence calculation.
A tendency was revealed of a slight reduction in development gaps due to a series of services directly correlated with tourism activity, such as tourist accommodation, transport, and restaurant and coffee shop services, on the background of a very slow convergence. For all three categories the values of β coefficient are negative. The null hypothesis (β = 0) is invalidated, so there is a statistically significant but negative relationship between variables. This means that for a tourism revenue increase by one unit, the revenues from tourist accommodation, transport, and restaurant and coffee shop services moderately decreased. Despite the fact that there is a statistically significant relationship, we cannot say that between 2012 and 2018 the tourism sector was strongly influenced by the revenues from the three types of services. The relationship with tourism revenue is stronger in the case of transport and accommodation services and weaker in the case of services provided by restaurants and cafés.
The expansion of the tourism sector reflected by the size of revenue may suggest a quantitative and qualitative improvement of tourist accommodation and transport services. These two categories are those that attract tourists or, on the contrary, cause them to reconsider their choices. The weaker influence on restaurant and coffee shop services is explained by the fact that the economic agents who carry out these activities do not have primarily tourism purposes. An increase in the tourism sector will not lead to proportional increases in accommodation structures, restaurants and cafés or transport.
Since the β values are lower than those of R (β < R) in all cases, the convergence is slow, it is a σ-convergence (Pascariu et al., Citation2019). The values of R2 indicate that the relationship between variables is closer in the case of tourist accommodation and restaurant and coffee shop services and less close in the case of tourist transport services. High tourism revenue does not primarily come from accommodation, transport or restaurant and coffee shop services.
The analysis of σ-convergence leads to conclusions similar to those for β-convergence.
All three categories studied outlined the image of a low-intensity and slow convergence process. The contribution of the revenues generated by the three sectors to tourism revenue was not decisive for tourism growth. Even though they are important for tourism and economic growth, it seems that the engine of development is to be found elsewhere.
Convergence has been intensely studied in literature, unlike European tourism convergence. The literature on the European tourism convergence analyses the process starting from different indicators than those studied in this article. In general, existing studies analyse convergence using indicators such as: number of tourists, number of nights spent in a particular destination, number of jobs in the field of tourism. In this paper, we decided to study convergence starting from the relatively recent indicators which were available, hence the incomplete data series, but relevant for our subject. The more difficult to estimate tourism revenues by source of origin, the more relevant their impact. The gaps in the literature regarding tourism convergence starting from endogenous variables such as revenues from accommodation, transport and restaurant activities are filled by this study. We used the latest data available for the European space, given that tourism is proving to be one of the most important, dynamic and vulnerable sectors of the economy. The tourist component of the tertiary sector becomes a major link in the European convergence process, and the importance of tourist convergence will escalate as a result of the effects of the 2020 crisis. The dynamics induced by the increase of the quality of life at the end of the 20th century and the beginning of the 21st century developed the tourism sector and allowed people to visit new places, turning tourism into a way of life. The convergence of tourism is necessary for the economy of some countries which desire to join and stabilise themselves in the European tourist circuit, and for the population to widen its cultural and leisure horizon. Given the large differences among the tourism sectors in Europe, the attention paid to the convergence process is justified. The declared European interest is to reduce the gaps between members.
The existing literature, based mainly on quantitative variables, is not supplemented by the one studying convergence with the help of endogenous variables evaluated monetarily. We started from the premises, otherwise demonstrated in other studies, that the indicators used so far, number of tourists, nights spent, are less relevant. Economic growth is, in fact, stimulated by revenues and their possibility to grow. We chose the revenues from the accommodation services because they evaluate in monetary terms the number of tourists and the number of nights spent on the territory of a country. It is not the number of tourists and the time spent in a country that add value to the national product but the amount of money spent during a trip, and the main services paid for by tourists are accommodation, transport and food. These data are relatively recently accessible and justify the lack of series, the relatively short period of data series and the lack of similar studies. A major shortcoming is the lack of data on income from indirect sources such as parafiscal charges, money which tourists spend to visit tourist attractions. When these data become available, the impact of tourism on European convergence will be much clear.
The present research may be considered a continuation of the already existing ones. The results reached are varied, of accelerated convergence, slow convergence and even divergence. Time horizons are also very different. The robustness of the model is validated by the statistical results we reached. We did not introduce exogenous variables, because the period of time itself is not one in which the economy faced major shocks, which could radically change the results. The insertion in the analysis of exogenous variables with negative effect on convergence would imply the use of other methods of analysis, which do not allow us to draw conclusions about convergence as to the relationships between variables. This would be possible only if we reverse the research, i.e. to analyse how economic growth allows the convergence of tourism revenues.
The study of convergence and the validation of its manifestation shows the capacity of European states to recover the development gaps through tourism and to add value to their economy with the help of the tourism sector. Certifying the possibility of convergence through tourism helps the authorities by influencing economic policy decisions in the field of tourism and beyond. For instance, the investment decisions on the labour market are encouraged or discouraged by the manifestation or non-manifestation of convergence. The manifestation of convergence, even a slow one, justifies the placement of tourism among the priorities of economic policy, and the divergence signals deficiencies of the sector which must be eliminated to reduce the gaps in the development of tourism sector.
5. Conclusions
According to statistical data and the literature, tourism is one of the most important sectors for economic growth. Changing consumption patterns and considering travel as one of the priorities of people, including the residents of the developing countries, become possible due to progress, especially in transport and technology, and improved living conditions. Given this, we studied the possibility of European economic convergence through indicators specific to the tourism sector. In the literature, there are no similar analyses covering, for the same sample of countries and the same period, the topic of economic convergence through tourism with reference to accommodation, transport, and restaurant and coffee shop services. This led us to investigate the relationship between tourism and economic growth, dealing with the European Union economic convergence through the direct, indirect and induced effects of tourism.
Economic growth would be the result, among other things, of the expansion of the tourism sector. Tourism creates links between economic sectors and its development facilitates the propagation of economic effects that are wider than the direct ones we usually consider, ignoring the related ones. We argued this by analysing the convergence of economic growth through tourism based on the revenues from tourism by sources.
Any person, as a tourist, spends money on accommodation, transport and food. Thus, our aim was to find out the extent to which these categories influence tourism convergence in the EU-28. The analysis of β and σ-convergence revealed that convergence took place but its pace was relatively slow.
By means of β and σ-convergence analyses, macroeconomic indicators and the literature, we validated the research hypotheses and argued that the state of the tourism sector depended on the basic activities and allowed for regional economic convergence. However, we noticed a trend of increase in the revenues from accommodation services in the EU-28 except for Latvia, and of decrease in revenues from restaurant and coffee shop services. The analysis highlights a significant relationship among the variables analysed, but if the revenues from the three sources develop the tourism sector, the reciprocal is no longer demonstrated. The convergence of European tourism is slow, and its intensity is low, which shows that the process must be based mainly on other factors and on the revenues from other sources than those we focused on.
The research had two types of main limitations: lack of statistical data for a wider time frame; too large a number of relevant indicators to be analysed in one piece of research. Further analyses are needed to target other member states and other time intervals. Although this research contributes to fill some gaps in the existing literature by offering another perspective which we reached by studying convergence using endogenous monetary variables, the data series available are valid for a relatively short period of time, i.e. 7 years. In the future, as the time horizon widens, the analytical analysis of these variables may validate the hypothesis of higher convergence (we concluded that convergence is slow in the EU-28). Of course, the methodology used and the indicators selected can influence the research results. The research leaves room for further analysis, possibly comparative, when the data on other countries and regions outside Europe become available. European convergence is not a process which can be achieved in the short term, especially after the shock of the 2020 crisis. Further research may not confirm the results obtained previously, the present research included. The following years will be decisive regarding economy and society, and therefore the tourism sector.
The relationship between tourism, economic growth, and convergence through tourism can be also approached using variables other than the ones investigated in this paper. The present study allows for further deepening of the subject from different temporal, spatial and statistical perspectives. The methodology chosen as a research tool determines the results of the research. A change in methodology, starting from the same sample of countries, time periods, indicators and research hypotheses, may provide another perspective on the findings and other conclusions.
The significance of this research comes from the fact that it fills a gap in the literature, since there are no similar analyses. The study of European convergence with the help of tourism revenues based on sources of origin is the novelty element of this paper, which comes from its findings. Even though the EU-28 economic convergence has been the subject of many research studies, the novelty of the present work is that we related economic growth to the growth of the tourism sector and used as variables per capita tourism revenue in correlation with revenues from accommodation units, a sub-sector of tourism, from transport, a vector of tourism development, and from restaurants and cafés, an important element of leisure. Our findings contradict those according to which tourism sector convergence takes place at an accelerated rate. We found a low-intensity and slow convergence. Beta and sigma-convergence initially placed the 28 member states in a divergence phase, followed by one of moderate convergence.
The literature regards tourism as a convergence factor for the EU-28. We identified the main driving factors of the tourism sector and analysed the influence of three of them. The hypothesis of the EU-28 convergence through tourism, validated in the literature, was once again validated in this paper through the comparative values of the categories of revenue approached. We concluded that the amount of revenue from accommodation, transport, restaurants and cafés was not enough to strongly support convergence. It was supported by factors to be discovered.
Disclosure statement
No potential conflict of interest was reported by the authors.
Correction Statement
This article has been republished with minor changes. These changes do not impact the academic content of the article.
References
- Aguayo, E. (2005). Tourism in Central Europe: A comparison of the Regions of Poland, Hungary, Czech Republic, Slovakia and Slovenia with Other European Countries in Year 2000. Regional and Sectoral Economic Studies. http://www.usc.es/economet/reviews/eers522.pdf
- Aksöz, O. E., & Bâc, D. P. (2012). The Importance of Urban Tourism for Hotels’ Marketing Policies: The Case of Eskişehir. GeoJournal of Tourism and Geosites, 9(1), 7–16. http://gtg.webhost.uoradea.ro/PDF/GTG-1-2012/1_94_Bac_Aksoz.pdf
- Alfaro Navarro, J.-L., Andrés Martínez, M.-E., & Mondéjar Jiménez, J.-A. (2020). An approach to measuring sustainable tourism at the local level in Europe. Current Issues in Tourism, 23(4), 423–437. https://doi.org/https://doi.org/10.1080/13683500.2019.1579174
- Antonakakis, N., Dragouni, M., Eeckels, B., & Filis, G. (2019). The tourism and economic growth enigma: Examining an ambiguous relationship through multiple prisms. Journal of Travel Research, 58(1), 3–24. https://doi.org/https://doi.org/10.1177/0047287517744671
- Apostolakis, A. (2003). The convergence process in heritage tourism. Annals of Tourism Research, 30(4), 795–812. https://doi.org/https://doi.org/10.1016/S0160-7383(03)00057-4
- Barro, R. J., & Sala-I-Martin, X. (1992). Convergence. Journal of Political Economy, 100(2), 223–251. https://doi.org/https://doi.org/10.1086/261816
- Barro, R. J., & Sala-I-Martin, X. (1995). Economic growth. MIT Press.
- Bassanini, A., & Scarpetta, S. (2003). The driving forces of economic growth: panel data evidence for the OECD countries. OECD Economic Studies, 2001(2), 9–56. https://doi.org/https://doi.org/10.1787/eco_studies-v2001-art10-en
- Baumol, W. J. (1986). Productivity growth, convergence, and welfare: What the long-run data show. American Economic Review, 76(5), 1072–1085. http://piketty.pse.ens.fr/files/Baumol1986.pdf
- Bevilacqua, A. E., & Casti, E. (1989). The structure and impact of international tourism in the Veneto region. GeoJournal, 19(3), 285–287. https://doi.org/https://doi.org/10.1007/BF00454573
- Borodako, K., & Rudnicki, M. (2014). Transport accessibility in business travel – A case study of central and east European cities. International Journal of Tourism Research, 16(2), 137–145. https://doi.org/https://doi.org/10.1002/jtr.1908
- Butnaru, G. I., & Haller, A. P. (2017). Perspective of sustainable rural tourism in the United Kingdom of Great Britain and Northern Ireland (UK): Comparative study of β and σ convergence in the economic development regions. Sustainability, 9(4), 525. https://doi.org/https://doi.org/10.3390/su9040525
- Calero, C., & Turner, L. W. (2020). Regional economic development and tourism: A literature review to highlight future directions for regional tourism research. Tourism Economics, 26(1), 3–26. https://doi.org/https://doi.org/10.1177/1354816619881244
- Cárdenas-García, P. J., Sánchez-Rivero, M., & Pulido-Fernández, J. I. (2015). Does tourism growth inflence economic development? Journal of Travel Research, 54(2), 206–221. https://doi.org/https://doi.org/10.1177/0047287513514297
- Cartone, A., Postiglione, P., & Hewings, G. J. D. (in press). Does economic convergence hold? A spatial quantile analysis on European regions. Economic Modelling. https://doi.org/https://doi.org/10.1016/j.econmod.2020.03.008
- Cheng, L., & Zhang, J. (2020). Is tourism development a catalyst of economic recovery following natural disaster? An analysis of economic resilience and spatial variability. Current Issues in Tourism, 1–22. https://doi.org/https://doi.org/10.1080/13683500.2019.1711029
- Cincibuch, M., Holub, T., & Hurník, J. (2008). Central bank losses and economic convergence. Working Papers Series 3. https://www.researchgate.net/publication/226649788
- Coccia, M. (2017). New directions in measurement of economic growth, development and underdevelopment. Journal of Economics and Political Economy, 4(4), 382–395. https://www.researchgate.net/publication/322526477
- Coccia, M. (2017, April 11). Measurement of economic growth and convergence: A new approach. Available at SSRN: https://ssrn.com/abstract=2951291 or https://doi.org/https://doi.org/10.2139/ssrn.2951291
- Cortéz-Jiménez, I. (2008). Which type of tourism matters to the regional economic growth? The cases of Spain and Italy. International Journal of Tourism Research, 10(2), 127–139. https://doi.org/https://doi.org/10.1002/jtr.646
- Dolecki, S. (2009). An initiation into convergence theory. In F. Mynard & E. Pearl (Eds.), Beyond topology (pp. 115–161). American Mathematical Society.
- Drabo, A. (2011). Interrelationships between health, environment quality and economic activity: What consequences for economic convergence. CERDI Etudes & Documents - Publications. https://halshs.archives-ouvertes.fr/halshs-00552995/document
- Du, D., Lew, A. A., & Ng, P. T. (2016). Tourism and economic growth. Journal of Travel Research, 55(4), 454–464. https://doi.org/https://doi.org/10.1177/0047287514563167
- Dugulan, D., Balaure, V., Popescu, I. C., & Vegheș, C. (2010). Cultural heritage, natural resources and competitiveness of the travel and tourism industry in Central and Eastern European countries. Annales Universitatis Apulensis Series Oeconomica, 2(12), 742–748. http://oeconomica.uab.ro/upload/lucrari/1220102/26.pdf https://doi.org/https://doi.org/10.29302/oeconomica.2010.12.2.26
- Dvoroková, K. (2014). Sigma versus beta-convergence in EU28: Do they lead to different results? In R. Neck (Ed.), Mathematical methods in finance and business administration (pp. 88–94). World Scientific and Engineering Academy and Society Press. http://www.wseas.us/e-library/conferences/2014/Tenerife/ECONMATH/ECONMATH-00.pdf
- Estol, J., & Font, X. (2016). European tourism policy: Its evolution and structure. Tourism Management, 52, 230–241. https://doi.org/https://doi.org/10.1016/j.tourman.2015.06.007
- Eurostat. (2019). Expenditure by expenditure categories. https://ec.europa.eu/eurostat/data/database
- Figini, P., & Vici, L. (2010). Tourism and growth in a cross section of countries. Tourism Economics, 16(4), 789–805. https://doi.org/https://doi.org/10.5367/te.2010.0009
- Font, X. (2002). Environmental certification in tourism and hospitality: Progress, process and prospects. Tourism Management, 23(3), 197–205. https://doi.org/https://doi.org/10.1016/S0261-5177(01)00084-X
- Gáspár, A. (2010). Economic growth and convergence in the world economies: An econometric analysis. In P. Kovács, K. Szép, & T. Katona (Eds.), Challenges for analysis of the economy, the businesses, and social progress (pp. 97–110). Unidocument Kft. https://eco.u-szeged.hu/download.php?docID=40370
- Geppert, K., & Stephan, A. (2008). Regional disparities in the European Union: Convergence and agglomeration. Papers in Regional Science, 87(2), 193–217. https://doi.org/https://doi.org/10.1111/j.1435-5957.2007.00161.x
- Grubor, A., Milićević, N. M., & Đokić, N. (2019). Social-psychological determinants of Serbian tourists’ choice of green rural hotels. Sustainability, 11(23), 6691. https://doi.org/https://doi.org/10.3390/su11236691
- Hall, D. R. (2011). Tourism development in contemporary Central and Eastern Europe: Challenges for the industry and key issues for researchers. Human Geographies – Journal of Studies and Research in Human Geography, 5(2), 5–12. //www.humangeographies.org.ro/articles/52/5_2_11_1_derek.pdf https://doi.org/https://doi.org/10.5719/hgeo.2011.52.5
- Hughes, H., & Allen, D. (2005). Cultural tourism in Central and Eastern Europe: The views of ‘induced image formation agents. Tourism Management, 26(2), 173–183. https://doi.org/https://doi.org/10.1016/j.tourman.2003.08.021
- Iancu, A. (2009). Real economic convergence. Working Papers of National Institute of Economic Research 090104. http://www.workingpapers.ro/2009/wpince090104.pdf
- Ivanov, S. H., & Webster, C. (2013). Tourism’s contribution to economic growth: A global analysis for the first decade of the millennium. Tourism Economics, 19(3), 477–508. https://doi.org/https://doi.org/10.5367/te.2013.0211
- Juselius, K., & Ordóñez, J. (2009). Balassa-Samuelson and wage, price and unemployment dynamics in the Spanish transition to EMU membership. Economics, 3, 1–30. doi: https://doi.org/https://doi.org/10.5018/economics-ejournal.ja.2009-4
- Kashnitsky, I., De Beer, J., & Van Wissen, L. (2020). Economic convergence in ageing Europe. Tijdschrift Voor Economische en Sociale Geografie, 111(1), 28–44. https://onlinelibrary.wiley.com/doi/epdf/10.1111/tesg.12357 https://doi.org/https://doi.org/10.1111/tesg.12357
- Khan, N., Hassan, A. U., Fahad, S., Naushad, M. (2020). Factors affecting tourism industry and its impacts on global economy of the world. Available at SSRN 3559353. https://doi.org/https://doi.org/10.2139/ssrn.3559353
- Kong, J., Phillips, P. C. B., & Sul, D. (2017). Weak σ-convergence: Theory and applications. Cowles Foundation Discussion Paper 2072, 1–67. https://doi.org/https://doi.org/10.2139/ssrn.2901070
- Koudoumakis, P., Botzoris, G., Protopapas, A., & Profillidis, V. (2019). The impact of the economic crisis in the process of convergence of the Greek regions. Regional Science Inquiry, 11(1), 25–32. https://www.researchgate.net/publication/333582166
- Kum, H., Aslan, A., & Gungor, M. (2015). Tourism and economic growth: The case of next-11 countries. International Journal of Economics and Financial Issues, 5(4), 1075–1081. http://www.econjournals.com/index.php/ijefi/article/view/1655
- Kutan, A. M., & Yigit, T. M. (2004). Nominal and real stochastic convergence of transition economies. Journal of Comparative Economics, 32(1), 23–36. http://yoksis.bilkent.edu.tr/pdf/files/10.1016-j.jce.2003.09.008.pdf
- Kvedaras, V., & Cseres-Gergely, Z. (2020). Convergence of income distributions: Total and inequality-affecting changes in the EU. Economics Letters, 188, 108946. https://www.sciencedirect.com/science/article/pii/S0165176520300057 https://doi.org/https://doi.org/10.1016/j.econlet.2020.108946
- Le Gallo, J., Ertur, C., & Baumont, C. (2003). A spatial econometric analysis of convergence across European regions, 1980–1995. In B. Fingleton (Ed.), European regional growth (pp. 99–129). Springer-Verlag.
- Lee, J. W. (2020). Convergence success and the middle‐income trap. The Developing Economies, 58(1), 30–62. http://econ.korea.ac.kr/∼jwlee/publication/ConvergenceMIE_20171006.pdf https://doi.org/https://doi.org/10.1111/deve.12214
- Lemma, A. F. (2014). Tourism impacts: Evidence of impacts on employment, gender, income. EPS-PEAKS. https://assets.publishing.service.gov.uk/media/57a089f2ed915d622c000495/Tourism_Impacts_employment_gender_income_A_Lemma.pdf
- Levine, R., & Renelt, D. (1992). A sensitivity analysis of cross-country growth regressions. American Economic Review, 82(4), 942–963. https://www.researchgate.net/publication/4901181
- Lin, V. S., Yang, Y., & Li, G. (2019). Where can tourism-led growth and economy-driven tourism growth occur? Journal of Travel Research, 58(5), 760–773. https://doi.org/https://doi.org/10.1177/0047287518773919
- Longhi, C., & Musolesi, A. (2007). European cities in the process of economic integration: Towards structural convergence. The Annals of Regional Science, 41(2), 333–351. https://doi.org/https://doi.org/10.1007/s00168-006-0104-4
- Lundberg, J. (2017). Does academic research affect the local growth pattern? Empirical evidence based on Swedish data. Regional Studies, 51(4), 586–601. https://doi.org/https://doi.org/10.1080/00343404.2015.1107182
- Marzo, M. (1998). Fiscal policy and growth: A survey. Working Paper DSE 314. https://www.econstor.eu/bitstream/10419/159156/1/wp0314.pdf
- Merler, S. (2016). Income convergence: Did EU funds provide a buffer? Bruegel Working Paper 6. http://bruegel.org/wp-content/uploads/2016/10/WP-06-16-1.pdf
- Miandehi, P. M., & Masrouri, M. Y. (2013). Assessment of SWOT model on tourism industry in sustainable development of rural areas: Case study on Bandar-E Anzali. World Applied Sciences Journal, 21(3), 455–464. https://www.idosi.org/wasj/wasj21(3)13/21.pdf
- Nell, K. S. (2020). Evaluating the conditional convergence hypothesis in the post-1989 globalization period. Applied Economics, 52(30), 3308–3319. https://doi.org/https://doi.org/10.1080/00036846.2019.1710451
- Neuts, B. (2020). Tourism and urban economic growth: A panel analysis of German cities. Tourism Economics, 26(3), 519–527. https://doi.org/https://doi.org/10.1177/1354816619833553
- Nogués-Pedregal, A. M. (2012). When the desirable and the feasible converge through tourism space. In A. M. Nogués-Pedregal (Ed.), Culture and society in tourism contexts (pp. 57–89). Emerald Publishing. https://doi.org/https://doi.org/10.1108/S1571-5043(2012)0000017006
- Nunkoo, R., Seetanah, B., Jaffur, Z. R. K., Moraghen, P. G. W., & Sannassee, R. V. (2020). Tourism and economic growth: A meta-regression analysis. Journal of Travel Research, 59(3), 404–423. https://doi.org/https://doi.org/10.1177/0047287519844833
- Osti, L., Faccioli, M., & Brida, J. G. (2011). Residents' perception and attitudes towards tourism impacts: A case study of the small rural community of Folgaria (Trentino, Italy) (October 1, 2009). Benchmarking: An International Journal, 2011, 1–21. https://ssrn.com/abstract=1481149
- Paas, T., & Vahi, T. (2012). Economic growth, convergence and innovation in the EU regions. Estonian Discussions on Economic Policy, 20(1), 105–121. https://ojs.utlib.ee/index.php/TPEP/article/view/777/756
- Pascariu, G. C., Drăgan, G., & Stângaciu, O. A. (2019). Integration and trade specialization in central and eastern European countries: Towards a new core-periphery structural differentiation? Romanian Journal of Economic Forecasting, 22(3), 148–169. http://www.ipe.ro/rjef/rjef3_19/rjef3_19p148-169.pdf
- Petrakos, G., & Artelaris, P. (2009). European regional convergence revisited: A weighted least squares approach. Growth and Change, 40(2), 314–331. https://doi.org/https://doi.org/10.1111/j.1468-2257.2009.00477.x
- Phillips, P. C. B., & Sul, D. (2007). Transition modeling and econometric convergence tests. Econometrica, 75(6), 1771–1855. https://personal.utdallas.edu/∼d.sul/papers/ECTA6760.pdf
- Quah, D. T. (1996). Empirics for economic growth and convergence. European Economic Review, 40(6), 1353–1375. https://doi.org/https://doi.org/10.1016/0014-2921(95)00051-8
- Rodríguez, X. A., & Rivadulla, R. (2012). Tourism in Spain: Disaggregated analysis of the international demand. Regional and Sectoral Economic Studies, 12(1), 77–82. http://www.usc.es/economet/reviews/eers1216.pdf
- Rodríguez-Benavides, D., López-Herrera, F., & Venegas-Martínez, F. (2014). Are there economic convergence clubs in Latin America? Journal of Economics and Development Studies, 2(3), 113–123. http://jedsnet.com/journals/jeds/Vol_2_No_3_September_2014/8.pdf https://doi.org/https://doi.org/10.15640/jeds.v2n3a8
- Roudi, S., Arasli, H., & Akadiri, S. S. (2019). New insights into an old issue–examining the influence of tourism on economic growth: Evidence from selected small island developing states. Current Issues in Tourism, 22(11), 1280–1300. https://doi.org/https://doi.org/10.1080/13683500.2018.1431207
- Sahakyan, M., & Ghazaryan, S. (2016). Tourism modeling: A new approach to tourism. In M. Przygoda, M. Mikic, & P. Kurecic (Eds.), Economic and social development (pp. 160–170). Varazdin Development and Entrepreneurship Agency. https://www.esd-conference.com/upload/book_of_proceedings/Book_of_Proceedings_Warsaw_2016_Online.pdf
- Santamaria, D., & Filis, G. (2019). Tourism demand and economic growth in Spain: New insights based on the yield curve. Tourism Management, 75, 447–459. https://doi.org/https://doi.org/10.1016/j.tourman.2019.06.008
- Siljak, D. (2015). Real economic convergence in the European Union from 1995 to 2013. Business and Management Review, 6(4), 213. https://cberuk.com/cdn/conference_proceedings/2015iacp33.pdf
- Simionescu, M. (2014). Testing sigma convergence across EU-28. Economics and Sociology, 7(1), 48–60. https://economics-sociology.eu/files/09_25_Simionescu.pdf
- Sîrghi, N. (2010). Economic growth in the European model. [Special Issue]. Scientific Annals of the "Alexandru Ioan Cuza" University of Iași: Economic Sciences Series, 317–325. http://anale.feaa.uaic.ro/anale/resurse/mec2sirghi.pdf
- Sokhanvar, A. (2019). Does foreign direct investment accelerate tourism and economic growth within Europe? Tourism Management Perspectives, 29, 86–96. https://doi.org/https://doi.org/10.1016/j.tmp.2018.10.005
- Solow, R. M. (1956). A contribution to the theory of economic growth. The Quarterly Journal of Economics, 70(1), 65. http://piketty.pse.ens.fr/files/Solow1956.pdf https://doi.org/https://doi.org/10.2307/1884513
- Soukiazis, E. (2000). What have we learnt about convergence in Europe? Some theoretical and empirical considerations. Discussion paper 2, CEUNEUROP. Faculty of Economics, University of Coimbra. https://www.academia.edu/21465765
- Sperlich, Y., & Sperlich, S. (2012). Income dispersion and sigma convergence in south-south agreement areas. Working Paper Series 12031. Université de Genève. https://pdfs.semanticscholar.org/1f80/9b1efc6dd477dfbb68d35644b7ff0eb3b754.pdf
- Tang, C. F. (2020). The threshold effects of educational tourism on economic growth. Current Issues in Tourism, 1–16. https://doi.org/https://doi.org/10.1080/13683500.2019.1694869
- Tang, C. F., & Tan, E. C. (2016). The determinants of inbound tourism demand in Malaysia: Another visit with non-stationary panel data approach. Anatolia, 27(2), 189–200. https://doi.org/https://doi.org/10.1080/13032917.2015.1084345
- UNCTAD. (2013). Sustainable tourism: Contribution to economic growth and sustainable development. https://unctad.org/meetings/en/SessionalDocuments/ciem5d2_en.pdf
- UNWTO. (2017). Tourism for development. Volume I: Key areas for action. https://www.e-unwto.org/doi/pdf/10.18111/9789284419722
- Urbanc, M., Printsmann, A., Palang, H., Skowronek, E., Woloszyn, W., & Gyuró, É. (2004). Comprehension of rapidly transforming landscapes of Central and Eastern Europe in the 20th century. Acta Geographica Slovenica, 44(2), 101–131. https://www.researchgate.net/publication/250304699 https://doi.org/https://doi.org/10.3986/AGS44204
- Vellecco, I., & Mancino, A. (2010). Sustainability and tourism development in three Italian destinations: Stakeholders’ opinions and behaviours. The Service Industries Journal, 30(13), 2201–2223. https://doi.org/https://doi.org/10.1080/02642060903287500
- Vergori, A. S., & Arima, S. (2020). Cultural and non-cultural tourism: Evidence from Italian experience. Tourism Management, 78, 104058. https://doi.org/https://doi.org/10.1016/j.tourman.2019.104058
- Ville, K. (2004). Convergence of Real GDP per capita in the EU15. How do the accession countries fit in? ENEPRI Working Paper 25. http://aei.pitt.edu/1843/1/ENEPRI_WP25.pdf
- Vojinović, B., Brezovnik, B., & Oplotnik, Z. J. (2016). Measuring services and tourism convergence among five old and five new EU member states. Engineering Economics, 27(3), 285–293. https://doi.org/https://doi.org/10.5755/j01.ee.27.3.11145
- WTTC. (2016). Global travel and tourism economic impact. https://www.wttc.org/-/media/files/reports/economic-impact-research/wttc-global-travel–tourism-economic-impact-update_july-2016_encrypted.pdf
- WTTC. (2019). Travel and tourism economic impact 2019. https://www.wttc.org/-/media/files/reports/economic-impact-research/regions-2019/world2019.pdf
- Xie, J., & Tveterås, S. (2020). Economic decline and the birth of a tourist nation. Scandinavian Journal of Hospitality and Tourism, 20(1), 49–67. https://doi.org/https://doi.org/10.1080/15022250.2020.1719882
- Yeoman, I. (2008). What will the tourist be doing in 2030? In I. Yeoman (Ed.), Tomorrow’s tourists: Scenarios & trends (pp. 33–39). Elsevier.
- Yin, L., Zestos, G. K., & Michelis, L. (2003). Economic convergence in the European Union. Journal of Economic Integration, 18(1), 188–213. https://www.e-jei.org/upload/H1HUPG9T9QRTT3UH.pdf https://doi.org/https://doi.org/10.11130/jei.2003.18.1.188
- Young, A. T., Higgins, M. J., & Levy, D. (2008). Sigma convergence versus beta convergence: Evidence from U.S. county-level data. Journal of Money, Credit and Banking, 40(5), 1083–1093. https://www.biu.ac.il/soc/ec/d_levy/wp/jmcb5.pdf https://doi.org/https://doi.org/10.1111/j.1538-4616.2008.00148.x