
 ?Mathematical formulae have been encoded as MathML and are displayed in this HTML version using MathJax in order to improve their display. Uncheck the box to turn MathJax off. This feature requires Javascript. Click on a formula to zoom.
Abstract
Behavioural Finance and Behavioural Economics are jointly fast-growing fields of research, which encompass both academicia and business. Therefore, the purpose of this paper is to study the biases in decision-making by ordinary investors, also considering socio-economic variables. We do so by applying systematic review tools and meta-analysis. In this study, this analysis is conducted by using tools developed for this purpose, such as EPIReviewer. We sourced information primarily from WOS-Clarivate, and also supplement it with the Proquest database. The search provided 890 studies in total, from 2009 to 2019. After cleaning the dataset, 110 publications remained for the analysis. The output of the analysis consisted of summarised tables, frequency and cross-tabulation tables corresponding to the 17 types of biases and 15 socioeconomic variables. Inasmuch as the study was targeted to discover the type of behavioural biases and constructs that exhibit the ordinary investor‘s group, it was found that the evidence in the literature was joined with that of the institutional investors. On the other hand, the socio-economic evidence about gender, age, studies, and geography in the literature review is short, limited and partial. The results emerging from this review provide a first insight into the behavioural finance biases and socio-economic links of ordinary people based on the most recent publications. This should inform more extended studies given the importance of ordinary people as a general reference for the economy.
1. Introduction
Recently, Behavioural Finance and Behavioural Economics have been jointly fast-growing fields of research, which encompass both academia and business (Bikas et al., Citation2013; Baddeley, Citation2013).
The volume of papers published related to Behavioural Finance has risen exponentially since 2010, both with top referenced journals and other less referenced publications. However, a good number of published papers analyse the behaviour of financial markets and institutional investors, with reduced scope for individual and non-financial investors, such as ordinary consumers (Abu Bakar et al., Citation2014; Cuomo et al., Citation2018; Daniel et al., Citation1998). Specifically, this group remains less researched and constitutes our focus.
The purpose of this paper is, therefore, to study the biases and their relations in decision-making by ordinary investors, also considering links with descriptive socio-economic variables (Graham et al., Citation2002; Matsumoto et al., Citation2013).
In short, Behavioural Economics extracts from behavioural psychology new theories and pieces of evidence for individual choices and decision-making. The basic principles of traditional finance, like the rational behaviour of markets and participants, are challenged under Behavioural Finance to explain markets and investors' current anomalies, caused by biases in human decision-making (Sharma & Dibrugarh, Citation2014; Hirshleifer, Citation2015; Shiller, Citation2003) Theories like prospect theory (Kahneman & Tversky, Citation1979), mental accounting (Thaler, Citation1980), disposition effect (Gupta & Ahmed, Citation2016; Richards et al., Citation2011), overconfidence (Matsumoto et al., Citation2013; Michailova et al., Citation2017), anchoring (Chandra, Citation2008; Gupta & Ahmed, Citation2016; Sadi et al., Citation2011) and some others assist to explain the causes of biases (Aren et al., Citation2016; Bogan et al., Citation2013; Hackbarth, Citation2008; Howard, Citation2014; Lacalle, Citation2018; Zhou & Pham, Citation1984).
Given the prescriptive character and association between different psichological biases in Behavioural Finance, it has become customary to apply the methodology of literature reviews when analysing behaviours and state-of-the-art in the field (Kumer & Goyal, Citation2015). The existing amount of recent academic-level publications in Behavioural Finance in the considered line of research (Costa et al., Citation2017) facilitates the use of the methodology of literature reviews for these types of studies. From the different types of literature reviews used in social sciences, systematic reviews methodology fits better the objective of categorising the biases and their relations revealing the current state-of-the-art and the different sub-lines within this topic. In this study, this analysis is conducted using systematic reviews tools previously developed for this purpose in clinical investigation, such as EPIReviewer from University College London.
In social sciences business research, searching for literature (Hervas-Oliver et al., Citation2015) should be broad in terms of sources, keeping a balance between breadth and depth, including not only databases of published journals but also going beyond major bibliographical databases to increase the effectiveness of reviews (Fisch & Block, Citation2018). Frequently, the quality rating of the journals is used as the first criteria in the search. We sourced information primarily from WOS-Clarivate, and supplement it with the Proquest (ABI/Inform) database. The search query provided 883 studies in total, from years 2009 to 2019.
Inclusion and Exclusion criteria are used to produce the final cases to be analysed in the text by keywords analysis. After cleaning the dataset, 266 publications remained for that analysis. The output of the analysis consisted of summarised tables, frequency and cross-tabulation tables corresponding to the 18 types of biases and 18 socioeconomic variables, all categorical.
Inasmuch as the study was targeted to discover the type of behavioural biases and constructs that exhibit the ordinary investor‘s group, it was found that the evidence in the literature was joined with those of the institutional investors. On the other hand, the socio-economic evidence about gender, age, studies, and geography in the literature review are lacking, limited and partial, studies from the Far East being most commonly cited. To overcome this socio-economic shortage of evidence, new sources of literature must be investigated and included in future research about ordinary people.
The results emerging from this review provide a first insight into the behavioural finance biases and socio-economic links of ordinary people based on the most recent publications. That should inform more extended studies given the importance of ordinary people as a general reference for the economy.
2. Literature review
Classical finance theory, or efficient-market hypothesis, states that investors behave rationally when choosing the financial products in which they wish to invest. The Nobel laureate, Eugene Fama (Citation1998) defends this theory, expressing his disagreement with the new behavioural financing hypothesis based on two ideas: 1) that market anomalies are random results; and 2) that these anomalies tend to disappear when changes occur in the methodology used to measure them (Fama, Citation1998). However, the “theory of behavioural finance”; considers that the choice of financial products by the ordinary investor is based on their psychological and sociological as well as emotional preparation. Moreover, household bias associated with information and culture affects its behaviour, due to the acceptance of published data and the protection of reputation (Aren et al., Citation2016). This theory, therefore, considers irrational behaviour as the essence of making financial decisions. In this sense, Shiller (Citation2003) defines behavioural finance as “finance from a broader social science perspective, including psychology and sociology”.
There are currently supporters of both theories, among which are several authors awarded the Nobel Prize in economics, such as Kahneman, who, together with Tversky, was one of the architects of the so-called “prospect theory or theory of perspectives”. This theory enables us to describe how people make their decisions in situations where they must decide between alternatives of potential losses and gains, which involve risk in the selection (Kahneman & Tversky, Citation1979).
Thaler (Citation1980) developed the “mental accounting theory”. Money has the same value regardless of where it comes from, and what it is spent on. However, it costs us less work to spend an amount earned effortlessly than an amount earned with sacrifice resulting from work. This happens because our mind tricks us into believing that the first money has less value than the second. It is what is known as the mental accounting trap. Hammond (Citation2015) considers Kahneman and Tversky (Citation1979), along with Thaler (Citation1980), as the forefathers of behavioural finance, stating that feelings rather than rational reasons guide investment decisions.
The theory of perspectives establishes the hypothesis of expected utility, in which the most useful alternative is chosen. That is, when there is uncertainty regarding the expected results, there is a tendency to obtain secure rewards compared to other less probable ones, even if the value of the former is lower. It should be borne in mind that the feeling of loss is an aspect of human subjectivity so it should not be quantified, although the following are responsible for it: family influence, investment objectives, risk dimension, guilt, rationalisation, fear and anguish (Godoi et al., Citation2005). Therefore, loss aversion involves human emotions and desires (Godoi et al., Citation2005).
The conclusion reached by Baker and Wurgler (Citation2006) is that if the confidence indicators at the beginning of the period are low, the subsequent yields will be relatively high or, conversely, relatively low yields are obtained when the expectation is higher. In subsequent research, they determined the possibility of measuring the sentiment of investors and that surges of feelings have explanatory effects for individual companies and the stock market as a whole (Baker & Wurgler, Citation2007). There are measures based on surveys such as the Michigan Consumer Sentiment Index (MCSI) or Investor Intelligence, and measures based on market variables such as the closed-end fund discount (CEFD) (Qiu & Welch, Citation2004). Sentiment plays a role in financial markets, although CEFD may be an incorrect method for measuring it. Also, Qiu & Welch believe that “consumer confidence can robustly explain the profitability differential of small business and the profitability differential between the shares held disproportionately by retail investors and those of institutional investors”.
Investor sentiment can also be measured through indices constructed from other market variables, such as the Equity Market Sentiment Index (EMSI) (Bandopadhyaya & Jones, Citation2006) or the Baker and Wurgler sentiment index (Baker & Wurgler, Citation2006, Citation2007). For these authors, actions that are difficult to arbitrate or value are those most affected by the sentiment. The issue centres on the question of whether or not it is possible to know the price of the assets of the economy from existing pricing models.
Some studies have used the investor sentiment taken from social networks, such as Twitter, establishing a relationship between “Tweet sentiment”, stock returns, message volume and trading volume (Sprenger et al., Citation2014; Zhang et al., Citation2016). Furthermore, users who give investment advice ahead of the curve are quoted more frequently and have more followers. Piñeiro-Chousa et al. (Citation2017) analysed the activity of investors through social networks and the influence of these media on the Chicago Board Options Exchange Market Volatility Index (VIX) using a logit model and fuzzy-set qualitative comparative analysis (fsQCA). The authors conclude that, for non-professional investors, sentiment and experience form a combination that helps prevent an increase in market risk.
Oh and Sheng (Citation2011), from Shanghai, China, have tried to discover and evaluate the predictive power of text message sentiment on future directional movements of stock prices by using the irrational investor sentiment model. They recommend a complementary investment approach that uses user-generated content and validates an instrument that can contribute to the monetisation schemes of virtual investment communities. In 2017, Houlihan and Creamer developed a model based on the aggregation of all the characteristics as a whole, since the performance, the sentiment on social networks and market data can be used as risk factors in an asset pricing framework. The conclusions were as follows: on the one hand, the characteristics derived from the market data and a buy-sell relationship can improve the way the model functions; and, on the other, the sentiment derived from StockTwits further improves the performance of the model. However, there is no standardised way of measuring the sentiment provoked by instant messaging (Houlihan & Creamer, Citation2017).
Other authors have studied the “disposition effect” (Shefrin & Statman, Citation1985) that occurs in investors who hold financial assets that have lost value for too long and sell assets that have gained value without waiting for those assets to continue the increase in value trend (Barber et al., Citation1999). Ultimately, people dislike losing much more than they enjoy winning, so most investors bet on the use of stop-loss that decreases the disposition effect of the investor (Richards et al., Citation2011). Another significant contribution comes from the study of “overconfidence”, or the tendency to overestimate our skills and knowledge (Fischhoff et al., Citation1977; Michailova et al., Citation2017), which is reflected in the adoption of financial decisions by overly confident investors (Odean, Citation1998).On the contrary, Suresh (Citation2013) considers that all these biases help to make sound investment decisions.
Duxbury (Citation2015) presented a systematic synthesis of experimental studies about the effects of heuristics and prejudices, excessive reaction and overconfidence, as well as the influence of investors‘moods and emotions. In a similar line, Cuomo et al. (Citation2018) reinforce human thinking and feeling as an element that influences financial behaviour. Indeed, investor emotions (Howard, Citation2014) and psychology directly affect the operation of the stock market and the real economy, since they generate a bias that impacts the volatility of returns and the use of a pattern of behaviour based on past performance (Barberis et al., Citation1998; Lacalle, Citation2018). That is, they are irrational behaviours that do not focus on market information, because investors overestimate their skills based on the information they collect themselves and not what the market generates. These errors in investor perception have a direct effect on the markets (Daniel et al., Citation1998), and should be considered risk factors since the decisions taken by the investor focus on heuristics, cognitive dissonance, greed, fear and anchoring to satisfy their mental accounting (Chandra, Citation2008).
Some financial agents combine investment decisions with sentiment, mood or their mentality so that these conditions directly affect their decision making in one way or another (Blajer-Gołębiewska et al., Citation2018; Lucey & Dowling, Citation2005). However, knowing all the market information facilitates better decision making, although it has been shown that an excess of information sometimes harms investors, aggravating the threat, the relative risk and effectiveness of loss prevention (Blajer-Gołębiewska et al., Citation2018).
Feldman and Lepori (Citation2016) consider that the existence of irrational together with the rational investors has a significant impact on asset prices. However, in the long term only rational investors remain in the market, while the rest withdraw from the market due to the losses suffered so that the effects caused by the personalities and prejudices of investors are minor when herd behaviours are significantly reduced (Lakshmi et al., Citation2013). In turn, there will be new investors who will enter the market, and the process will be repeated. In general, those financial agents with herd behaviour are hoping to achieve higher returns than the market (Howard, Citation2014). The existence of herd behaviour is an additional factor for investment risk (Messis & Zapranis, Citation2014). It is essential, therefore, to understand this gap that is generated between the personality of the investor and their perception of the market which may be affected by their emotions, overconfidence, disposition effect, commitment, retrospection and randomness, as demonstrated by Sadi et al. (Citation2011).
If you take the everyday investor, you will have to consider that sometimes their herd behaviours are influenced by their confirmation bias and loss aversion (Wolf, Citation2005). However, loss aversion, regret and anchoring have been shown to affect experienced investors more than those who have no experience as professionals show a more significant disposition effect due to the type of investment they make as opposed to the common assets that most private investors access (Gupta & Ahmed, Citation2016). Added to this, investors with more capital and more experience prefer to invest on their own instead of receiving advice (Bodnaruk & Simonov, Citation2015). As far as inexperienced investors go, they are less prone to bias (Chen et al., Citation2007). Also, the everyday investor is more exposed to the “framework effect” than professional investors (Mittal, Citation2010).
In this regard, Guler (Citation2007) explains that despite the risk of making investments in venture capital, both companies and individuals continue to bet on them, mainly due to the need for investors to increase their portfolios with new assets that provide a higher return and a decrease in their losses due to diversification. Consequently, experienced investors with a high-risk perception bias issue more debt instruments compared to less segmented investors, using their experience to select debt instruments (Hackbarth, Citation2008). That is why the investor makes investments by keeping separate mental accounts for profit and loss (Zhou & Pham, Citation1984).
Similarly, certain demographic variables such as the occupation and educational level of investors directly affect the amount and capitalisation of the investment, with the educational level combined with honesty, quality of life and family security changing the investment patterns of financial agents (Mirji & Prasantha, Citation2016) and of private investors (Agyemang & Ansong, Citation2016).
There are also gender differences when making investments, as shown by various authors. Matsumoto et al. (Citation2013) showed that the behaviour of women is more rational than that of men, so decisions are more rational when investor teams are mixed since overconfidence is reduced. In the same direction, risk and loss biases are reduced in investment decisions in search of better performance (Bogan et al., Citation2013) since the processing of information between male and female investors is different (Graham et al., Citation2002).
In the case of Tumarkin and Whitelaw (Citation2001), they focused their study on the RagingBull.com website, concluding that publications in Internet financial forums affect share prices, either because the publications contain new information or because they are a stock price manipulation. The general conclusion is that there is no causal link between the activity of the forum and returns. The question is whether or not it is possible to know the price of the assets of the economy from existing asset pricing models. It is market information that influences the activity of this forum, and not vice versa. Investor sentiment affects the activity of the stock market through the valuation of assets since it generates a bias that impacts the volatility of returns and the use of a pattern of behaviour based on past returns (Brown & Cliff, Citation2005; Howard, Citation2014).
More recently, Piccoli and Chaudhury (Citation2018) have researched the role of investor psychology, associated with their confidence index, in the reaction of individual stock prices to extreme movements in the market in general. Also, investor sentiment may be linked to overreaction, which increases when investor sentiment is low. Investor sentiment represents an essential role in the arbitration limit, according to Yang and Zhou (Citation2015), who assert that it can be useful to understand a series of financial anomalies: overreaction, lack of reaction, fire sales and the arbitration limit. In line with the psychological literature, Abu Bakar et al. (Citation2014) consider that there is a higher proportion of investors with a pessimistic mood in the earlier part of the week, but as the week progresses they become more optimistic.
The authors have used Facebook‘s daily mood data across 20 international markets to explore the impact of that mood on the “Monday anomaly/effect”, using empirical evidence that investor sentiment is related to other behaviours studied in behavioural finance and, also to market effects (Abu Bakar et al., Citation2014). Feldman (Citation2010) shows that the rate of perceived losses exceeds all other sentiment measurements and systematic risk in the prediction of future returns in the medium term, especially for one- to two-year outlooks. Feldman concludes that the loss rate can be used as a quantitative measurement for the detection of bubbles and their subsequent crises in the financial markets. For their part, Frazzini and Lamont (Citation2008) explain that high investor sentiment can predict low future returns.
To avoid the biases caused by behavioural finance, Zahera and Bansal (Citation2018) compiled the conclusions of Nenkov et al. (Citation2009) and Avgouleas (Citation2008), suggesting that how the information is presented is crucial for the investor since they avoid the framework effect in their decision making.
The literature review methodology and in particular systematic reviews have been used with latitude in Behavioural Finance research, in particular in field analysis. Kumer and Goyal (Citation2015) published a timely systematic literature review about behavioural biases, followed by the study by Zahera and Bansal (Citation2018) about investor behavioural biases. Kwon and Silva (Citation2020) have recently published a study about the landscape of behavioural theories systematic literature review, and Ángeles López-Cabarcos et al. (Citation2020) studied investor sentiment but using another of the literature review methodologies based on bibliometrics.
3. Methodology
Literature reviews (Grant & Boot, Citation2009) provide methodologies and research strategies to gather knowledge and the state-of-the-art of a field. Some methodologies, such as narrative review (Hart, Citation2018) are a common form of review in humanities research, while systematic reviews (Petticrew & Roberts, Citation2006) are frequent in clinical investigation and are beginning to extend to social sciences and business management. There are several types of systemic reviews (Moher et al., Citation2015), being the standard one associated with meta-analysis used in this research. In general terms, “A systematic review is a review of a clearly formulated question that uses systematic and explicit methods to identify, select, and critically appraise relevant research, and to collect and analyse data from the studies that are included in the review. Statistical methods (meta-analysis) may or may not be used to analyse and summarize the results of the included studies” (Moher et al., Citation2009).
For business management research, the systematic reviews literature search should be broad and extend beyond major bibliographical databases to increase effectiveness (Fisch & Block, Citation2018), however it is essential to achieve a balance between quality-rated sources and others less controlled. In this research, the literature has been provided mainly by the Web of Science database, as a primary source, backed up by the Proquest database, including in all cases indexed peer-reviewed journals.
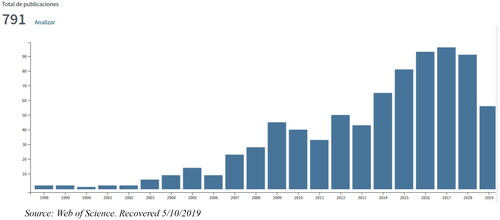
The terms used in the Web of Science Core Collection journals’ search were “Behavioural Finance”, “Households”, “Ordinary” and “Investors”. The resulting querying sentence filtering the documents, was, using Boolean Operators: (Behavioural_Finance) AND (Households OR Ordinary OR *_Investors), where “*” stands for the wildcard character, including any word associated with investors. This search resulted in 791 journals. and show the number of annual publications and citations from that search. About 48% of the selected journals originated in the category of business finance journals, while 44% in the category of economic journals. From the figures, it can be noticed that from 2009 onwards there is a steady upward trend, although before it was slow. Therefore, the review will only consider publications between 2009 and 2019.
Figure 1. Number of Citations and Publications. Source: Web of Science. Recovered 5/10/2019.
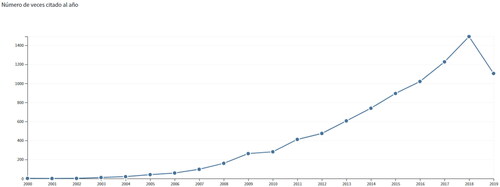
Figure 2. Number of Citations and Publications. Source: Web of Science. Recovered 5/10/2019.
Addressing the Proquest ABI/INFORM database, the used search terms were “Behavioural Finance” and “Every day”. Thus, the filtering query sentence was: (Behavioural_Finance) AND (Every day_*). The “*” character has the same function as before. After reducing the timescale for the selected journals between 2009 and 2019, the last search yielded 92 journals.
The systematic review will be conducted using the analysis tools provided by EPPI Reviewer 4 from the Department of Social Science University College London, previously developed for use in meta-analysis and systematic review in other research areas, such as medical research. The reference records with the abstract text and specific fields of information associated with the selected journals in the search were loaded into the EPPI database. The final result is a categorical classification allowing frequency analysis, crosstabs analysis and summary reports (Thomas & Harden, Citation2008).
The quality of systematic reviews, which affect the reliability of conclusions, has a complex assessment. In this research, the Oxman and Guyatt (Citation1991) checklist has been used. The major points to consider without meta-analysis are: literature search covering all relevant studies (all results from WoS and ABI//INFORM databases query); clear and complete definition of inclusion/exclusion criteria (criteria list implemented); reviewers assessing quality of included studies (text double revision); assessment of study heterogeneity (double check during coding); conclusions supported by the results of studies reviewed (yes).
Before the 883 journals produced from the search could be used for systematic review analysis, it is necessary (Petticrew & Roberts, Citation2006) to code and tag each one of them. The first step is the include/exclude separation. Records that are not entirely in compliance with the objectives of the research and could introduce unwanted bias are tagged as Excluded.
Records aligned with the intervention under study are labelled Included and subsequently coded with the analysis keywords to facilitate the explanatory statistics. summarizes the followed process before the categorial analysis is performed.
Figure 3. Reference Records Data Base Screening. Source: Elaborated by the authors.
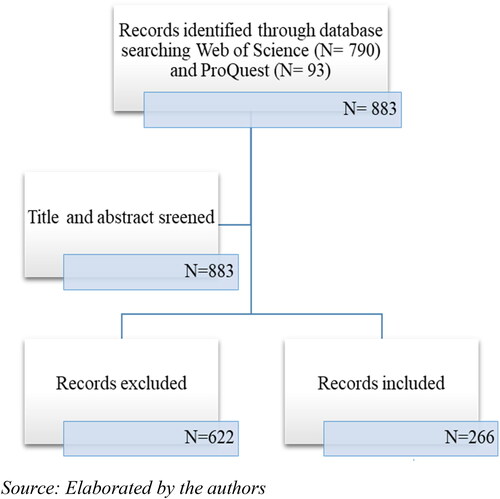
The reasons for exclusion, after the screening of each title and abstract, are: out of date, out of target group, out of intervention, out of evidence. Each case tagged the records with several keywords.
The codes applied to the records selected as Included are associated with socio-economic conditions or behavioural finance conditions. The socio-economic coding keywords are the following:
Geography: Europe, USA, South America, Far East, East, Middle East, Africa, Australia, Russia
Gender: Female, Male
Education: High Education, Middle Education, Low Education
Age: Young (under 40), Middle Age, (40–60), Mature Age, (60–70), Old Age (over 70)
The Behavioural finance coding keywords are the following:
Overconfidence (Moore & Healy, Citation2008). Associate financial performance to own capabilities.
Disposition (Shefrin & Statman, Citation1985). Financial decisions are based not on perceived losses but perceived gains.
Herding (Shiller, Citation2003). Other financial agents’ decisions influence peoplés decisions.
Mental accounting (Thaler, Citation1985). Investment policies are made according to mental categories that satisfy peoplés emotions.
Confirmation bias (Koehler, Citation1993). People use future information that suits their own opinions.
Hindsight (Fischhoff & Beyth, Citation1975). People perceive cause–effect relationships according to previous conceptions.
Home money effect ( Thaler & Johnson, Citation1990). When profit is made, people are less loss averse.
Endowment effect (Kahneman et al., Citation1990). People are resistant to change from the current position.
Loss aversion (Benartzi & Thaler, Citation1995). When chances of losses appear, people are ready to take more risks.
Framing (Tversky & Kahneman, Citation1989). When results are positive, people avoid risk, and when results are negative avoid losses.
Home bias (Tesar & Werner, Citation1995). People have a preference for domestic investments as a sense of belonging.
Self-attribution (Chaudhary, Citation2013). People attribute success to personal foresight and failures to external agents.
Regret aversion (Fishburn, Citation2013). People make decisions avoiding regrets in the future.
Anchoring (Kahneman & Tversky, Citation1982). People make decisions around past information received.
Discounting (Frederick et al., Citation2002). Gains and small amounts are discounted more than losses or more significant amounts.
Preference reversal (Lichtenstein & Slovic, Citation1973). People have a preference for one option over another without further investigation.
Representativeness (Kahneman & Tversky, Citation1972). People incorrectly equate one situation’s probability with that of other situations.
Conservativism bias (Edwards, Citation1982). People stand by their own beliefs and discard other information.
4. Results
This section presents the results associated with the systematic review of the selected literature.
4.1. Excluded references, criteria analysis
A decision was made to include documents only since 2009 because previously the literature on the subject of our research is very scarce. For this reason, 56 documents have been excluded because they are before the date above and widely dispersed in previous years, so they are not representative. Second, the exclusion occurs because documents are not included in the concept of the target group, that is because they are cases that refer to studies on investment companies, professional investors or non-directed financial products to the individual investor. In total, 190 documents have been excluded from this concept. Thirdly, the exclusion occurs because of the intervention concept, that is the process of direct action on people, groups, or entities in an experimental study, being here not related to ordinary people’s actions. The total exclusion for this concept amounts to 29. Finally, studies excluded by evidence total 469 for not referring to individual investors or types of financial products addressed to them, and for not addressing the concept of behavioural finance and the rational and irrational behaviour of the individual investor. The sum of all excluded works amounts to 622, as previously mentioned.
4.2. Included references, univariate analysis
The univariate analysis provides the measure of the importance of each type of the behavioural biases category considered and the socio-economic profiles of the people cohorts referenced within the selected published works included. The data is taken from the frequency analysis provided by EPPI Reviewer 4.
depicts the frequencies of the categories associated with the behavioural finance biases. Top categories are: Disposition (10.6%), Overconfidence (9.1%) Confirmation Bias (7.6%), Conservatism (7.3%), Loss Aversion (7.1%) and Self-Attribution (6.8%). From that list, Disposition, Overconfidence and Confirmation Bias represent the top 15% of the 18 categories considered.
Table 1. Behavioural Finance Biases. Frequency Table.
Overconfidence and Confirmation Bias have in common that people underestimate the probabilities of reverse events, as Disposition also presents an over-optimistic vision of current gain, not uncommon in ordinary people (Baddeley, Citation2013).
The bottom categories, covering the other 15% of the 18 considered, are Home-Bias (2.1%), Preference Reversal (1.7%) and Discounting (0.5%), and represent residual behavioural patterns in the groups under study.
depicts the frequencies associated with the socioeconomic types considered in this study. The information has been grouped into four segments: Geography, Gender, Education and Age.
Table 2. Socio Economic Variables. Frequency Table.
It can be observed that the absolute frequencies in this table are minimal in comparison to the behavioural ones previously described. That could be caused by the insufficient presence of socio-economic cohorts in the selected current studies.
Regarding Geography, it appears that many of the studies are from Europe (31.7%) and the Far East (23.4%) followed by the Near and Middle East (11.7%), the East currently being the geography with more publications about the subject. In the Gender segment, both Male and Female present nearly equal representation. Higher Education (35.9%) and Middle Education (33.7%) cover 70% of the cases of study and the same can be observed about the Age segment, with 70% corresponding to Young (38.2%) and Middle Age (32.9%).
Nonetheless, Low Education (30.4%) and Old Age (28.9%) are significant and have a similar percentage, but there is not an evident link between them.
4.3. Included references, bivariate analysis
The multivariate analysis provides information about the possible relations of the categorical variables considered in this study, taken from the crosstab tables provided by EPPI Reviewer 4.
The relation analysis is divided into two parts: one about the correlations between the behavioural biases variables, and the second about the cross-relationships between the behavioural biases and the socio-economic variables. This analysis makes use of two contingency tables: one related to Geography, “Behavioural*Geography” and others for the rest of the variables, “Behavioural*Gender&Education&Age”.
The correlation analysis of the behavioural biases is based on a confusion matrix (Ting, Citation2017) shown in , where the vertical classes, categories assigned to included cases, are assumed to predict the horizontal classes. depicts vertical relative frequency associated with the horizontal classes. In this table, Home Bias, Discounting,
Table 3. Confusion Matrix Behavioural variables.
Table 4. Confusion Matrix Precision analysis.
Preference Reversal and House Money have the lowest percentages while the rest are significant. It can be noticed that there is a strong relationship between Disposition and Overconfidence.
The relation links emerging are the following: Disposition with Confirmation Bias, Hindsight, Home Money, Endowment, Framing and Representativeness; Overconfidence with Herding, Loss Aversion, Self-Attribution, Anchoring, Preference Reversal and Conservatism; Endowment with Home Money; Confirmation Bias with Home Bias, Anchoring and Representativeness; Self-Attribution with Overconfidence, Hindsight and Conservatism; Regret Aversion with Loss Aversion; Representativeness with Home Money and Conservatism with Confirmation Bias and Framing.
The PrecisionFootnote1 Rate measure in a confusion matrix shows the prediction capacity of each class assigned. The percentages in the diagonal elements correspond to the Precision Rate for each category. The categories with a high Precision Rate are Overconfidence, Home Bias, Preference, Discounting and Mental Accounting. The PrevalenceFootnote2 Rate is the overall Precision Rate for the matrix being in this situation equal to 0.14, which means one in seven categories shows notable relation with the others. Matthews Correlation MCC,Footnote3 which has a similar interpretation to Cramer V, provides the overall correlation of the behavioural variables, having a value of 0.086, definitely low.
The other correlations corresponding to the socio-economic variables are analysed using contingency tables. The standard residuals for the Geography contingency table are depicted in and those for the remaining group of variables in .
Table 5. Contingency table with socioeconomic variables.
Table 6. Contingency table with socioeconomic variables.
Geography has a Chi-Square p-value near to cero (2E-36) which signifies there is a relation between behavioural variables and Geography. However, the Cramer V test is only 0.3 implying this correlation is low. The Gender & Education & Age group contingency table has a Chi-Square p-value of 0.03, which is significant for alpha 0.05 but manifests an insufficient relationship with a Cramer V test of 0.08.
Geography’s stronger relations are the following. The USA with Mental Accounting, Self-Attribution and Regret Aversion; South America with Overconfidence and Herding; Europe with Confirmation Bias, Discounting and Preference Reversal; The Far East with Herding, House Money and Anchoring; Other East located territories with Hindsight, Endowment, Framing, Home Bias and Representativeness; Australia with Mental Accounting, Home Money, Home Bias, Discounting and Preference Reversal; Russia with Home Bias, Discounting and Representativeness.
The other socio-economic variables appear to group horizontally for some of the behavioural biases. Thus, Overconfidence and Confirmation Bias with the Education variables and Age, in particular, Young and Middle Age. Discounting, Preference Reversal and Representativeness with Education and Age as well, but Preference Reversal has a stronger relation with Mature and Old Age.
5. Conclusions
From the systematic review done on current publications, it has emerged that the research focus on ordinary people is somehow reduced, researchers being more interested in agents with a professional relation with finances. That can be observed in a large number of exclusions by evidence on the target group close to 78%, and the low numbers in the socio-economic variables included except for gender.
In the literature review there were some clues about the possible interrelationships between the behavioural finance biases (Aren et al., Citation2016; Wolf, Citation2005) which have been confirmed by the analysis; also the predominance of biases like disposition and overconfidence, which is not unusual in ordinary people (Baddeley, Citation2013). The correlations among the behavioural biases, manifest dependencies that suggest people showing one type of bias could result from the influence of other biases with a similar psychological mechanism. That yield to some confusion about the leading cause for a particular bias.
The influence from certain demographic variables was suggested (Agyeman & Ansong, Citation2016) by the literature and evidenced by the analysis. The correlation between behavioural biases and socio-economic groups shows a good relationship for the Geography group. Two areas emerge as significant: the whole East and Europe. While the Studies and Age groups exhibit a weak correlation, some variables, such as high and middle studies or young and middle age, are more relevant than others in the groups.
From the findings, the results from the research on ordinary people’s behavioural finance biases deserve adequate consideration in financial models, However the evidence of links between the biases and some socioeconomic variables needs revision, in particular with respect to gender (expected) and cultural differences in geographies (expected). For that reason, new systematic review studies are recommended addressing those issues, with special attention to the studies included, broadening the scope including more diverse sources, even some less academically relevant but keeping quality criteria in use.
Disclosure statement
No potential conflict of interest was reported by the author(s).
Notes
1
2
3
References
- Abu Bakar, A., Siganos, A., & Vagenas-Nanos, E. (2014). Does mood explain the Monday effect? Journal of Forecasting, 33(6), 409–418. doi:https://doi.org/10.1002/for.2305
- Agyemang, O. S., & Ansong, A. (2016). Role of personal values in investment decisions. Management Research Review, 39(8), 940–964. https://www.researchgate.net/profile/Otuo_Agyemang/publication/305149038_Role_of_personal_values_in_investment_decisions_Perspectives_of_individual_Ghanaian_shareholders/links/5b200b60a6fdcc69745cf0fc/Role-of-personal-values-in-investment-decisions-Perspectives-of-individual-Ghanaian-shareholders.pdf https://doi.org/https://doi.org/10.1108/MRR-01-2015-0015
- Ángeles López-Cabarcos, M., Pérez-Pico, A. M., & López-Pérez, M. L. (2020). Investor Sentiment in the theoretical field of behavioural finance. Economic Research-Ekonomska Istraživanja, 33(1), 2101–2119. https://doi.org/https://doi.org/10.1080/131677X.2018.1559748
- Aren, S., Aydemir, S. D., & Şehitoğlu, Y. (2016). Behavioral biases on institutional investors: A literature review. Kybernetes, 45(10), 1668–1684. https://doi.org/https://doi.org/10.1108/K-08-2015-0203
- Avgouleas, E. (2008). Reforming investor protection regulation: the impact of cognitive biases, Essays in the Law and Economics of Regulation, In honour of Anthony Ogus, Intersentia, Antwerpen. https://www.research.manchester.ac.uk/portal/en/publications/reforming-investor-protection-regulation-the-impact-of-cognitive-biases(fd1d10ef-2a1c-45bb-9062-7a7ad80364f3)/export.html
- Baddeley, M. (2013). Behavioral economics and finance. Routledge Taylor and Francis.
- Baker, M., & Wurgler, J. (2006). Investor sentiment and the cross-section of stock returns. The Journal of Finance, 61(4), 1645–1680. https://doi.org/https://doi.org/10.1111/j.1540-6261.2006.00885.x
- Baker, M., & Wurgler, J. (2007). Investor sentiment in the stock market. Journal of Economic Perspectives, 21(2), 129–151. https://doi.org/https://doi.org/10.1257/jep.21.2.129
- Bandopadhyaya, A., & Jones, A. L. (2006). Measuring investor sentiment in equity markets. Journal of Asset Management, 7(3–4), 208–215. https://www.researchgate.net/publication/320415971_Investor_Sentiment_and_Asset_Pricing_A_Review https://doi.org/https://doi.org/10.1057/palgrave.jam.2240214
- Barber, B. M., Odean, T., Klein, P., Leland, H., Lyons, R., Modest, D., & Trueman, B. (1999). The courage of misguided convictions: The trading behavior of individual investors. Financial Analysts Journal, 55(6), 41–55. https://www.emerald.com/insight/content/doi/10.1108/QRFM-04-2017-0028/full/html?fullSc=1
- Barberis, N., Shleifer, A., & Vishny, R. (1998). A model of investor sentiment. Journal of Financial Economics, 49(3), 307–343. https://doi.org/https://doi.org/10.1016/S0304-405X(98)00027-0
- Benartzi, S., &Thaler, R. H. (1995). Myopic loss aversion and the equity premium puzzle. The Quarterly Journal of Economics, 110(1), 73–92.
- Bikas, E.,Jurevičienė, D.,Dubinskas ,P., & Novickytė, L. (2013). Behavioural finance: The emergence and development trends. Procedia-Social and Behavioral Sciences, 82, 870–876.
- Blajer-Gołębiewska, A., Wach, D., & Kos, M. (2018). Financial risk information avoidance. Economic Research, 31(1), 521–536. https://doi.org/https://doi.org/10.1080/1331677X.2018.1439396
- Bodnaruk, A., & Simonov, A. (2015). Do financial experts make better investment decisions? Journal of Financial Intermediation, 24(4), 514–536. https://doi.org/https://doi.org/10.1016/j.jfi.2014.09.001
- Bogan, V. L., Just, D. R., & Dev, C. S. (2013). Team gender diversity and investment decision-making behavior. Review of Behavioural Finance, 5(2), 134–152. https://doi.org/https://doi.org/10.1108/RBF-04-2012-0003
- Brown, G. W., & Cliff, M. T. (2005). Investor sentiment and asset valuation. The Journal of Business, 78(2), 405–440. https://doi.org/https://doi.org/10.1086/427633
- Chandra, A. (2008). Decision making in the stock market: Incorporating psychology with finance National Conference: FFMI 2008 IIT Kharagpur. https://mpra.ub.uni-muenchen.de/21288/1/Decision_Making_in_the_Stock_Market.pdf
- Chaudhary, A. K. (2013). Impact of behavioural finance in investment decisions and strategies-A fresh approach. Journal of Management Research and Business Strategy, 2(2), 85–92.
- Chen, G., Kim, K. A., Nofsinger, J. R., & Rui, O. M. (2007). Trading performance, disposition effect, overconfidence, representativeness bias, and experience of emerging market investors. Journal of Behavioral Decision Making, 20(4), 425–451. https://doi.org/https://doi.org/10.1002/bdm.561
- Costa, D. F., de Melo Carvalho, F., de Melo Moreira, B. C., & do Prado, J. W. (2017). Bibliometric analysis on the association between behavioral finance and decision making with cognitive biases such as overconfidence, anchoring effect and confirmation bias. Scientometrics, 111(3), 1775–1799. https://doi.org/10.1007/s11192-017-2371-5
- Cuomo, M. T., Tortora, D., Mazzucchelli, A., Festa, G., Di Gregorio, A., & Metallo, G. (2018). Impacts of code of ethics on financial performance in the Italian listed companies of bank sector. Journal of Business Accounting and Finance Perspectives, 1(1), 157–179. https://doi.org/https://doi.org/10.26870/jbafp.2018.01.005
- Daniel, K. D., Hirshleifer, D., & Subrahmanyam, A. (1998). Investor psychology and security market under- and overreactions. The Journal of Finance, 53(6), 1839–1886. https://doi.org/https://doi.org/10.2307/117455
- Duxbury, D. (2015). Behavioral finance: Insights from experiments I: Theory and financial markets. Review of Behavioural Finance, 7(1), 78–96. https://doi.org/https://doi.org/10.1108/RBF-03-2015-0011
- Edwards, W.(1982). Conservatism in human information processing (excerpted). Judgment under Uncertainty: Heuristics and Biases. New York, NY: Cambridge University Press.
- Fama, E. F. (1998). Market efficiency, long-term returns, and behavioral finance. Journal of Financial Economics, 49(3), 283–306. https://doi.org/https://doi.org/10.1016/S0304-405X(98)00026-9
- Feldman, T. (2010). A more predictive index of market sentiment. Journal of Behavioral Finance, 11(4), 211–223. https://doi.org/https://doi.org/10.1080/15427560.2010.526892
- Feldman, T., & Lepori, G. (2016). Asset price formation and behavioral biases. Review of Behavioral Finance, 8(2), 137–155. https://doi.org/https://doi.org/10.1108/RBF-05-2015-0020
- Fisch, C., &Block, J. (2018). Six tips for your (systematic) literature review in business and management research. Management Review Quarterly, 68(2), 103–106.
- Fischhoff, B., &Beyth, R. (1975). I knew it would happen: Remembered probabilities of once—future things. Organizational Behavior and Human Performance, 13(1), 1–16.
- Fischhoff, B., Slovic, P., & Lichtenstein, S. (1977). Knowing with certainty: The appropriateness of extreme confidence. Journal of Experimental Psychology: Human Perception and Performance, 3(4), 552–564. https://doi.org/https://doi.org/10.1037//0096-1523.3.4.552
- Fishburn, P. C. (2013). The foundations of expected utility (Vol. 31). Springer Science & Business Media.
- Frazzini, A., & Lamont, O. (2008). Dumb money: Mutual fund flows and the cross-section of stock returns. Journal of Financial Economics, 88(2), 299–322. 07.001 https://doi.org/https://doi.org/10.1016/j.jfineco.2007
- Frederick, S., Loewenstein, G., & ÓDonoghue, T. (2002). Time discounting: A critical review. Journal of Economic Literature, 40(2), 351–401. https://doi.org/https://doi.org/10.1257/jel.40.2.351
- Godoi, K. C., Marcon, R., & da Silva, A. B. (2005). Loss aversion: A qualitative study in behavioral finance. Managerial Finance, 31(4), 46–56.
- Graham, J. F., Stendardi, E. J., Myers, J. K., & Graham, M. J. (2002). Gender differences in investment strategies: An information processing perspective. International Journal of Bank Marketing, 20(1), 17–238. https://doi.org/https://doi.org/10.1108/02652320210415953
- Grant, M. J., & Boot, A. (2009). A typology of reviews: An analysis of 14 review types and associated methodologies. Health Information and Libraries Journal, 26(2), 91–108. https://doi.org/https://doi.org/10.1111/j.1471-1842.2009.00848.x
- Guler, I. (2007). Throwing good money after bad? Political and institutional influences on sequential decision making in the venture Capital industry. Administrative Science Quarterly, 52(2), 248–285. https://journals.sagepub.com/doi/10.2189/asqu.52.2.248
- Gupta, Y., & Ahmed, S. (2016). The impact of psychological factors in investment decision making of investors: An empirical analysis. ISI Impact Factor, 44(1), 40–52. https://www.emerald.com/insight/content/doi/10.1108/QRFM-04-2017-0028/full/html?fullSc=1
- Hart, C. (2018). Doing a literature review: Releasing the research imagination (2nd ed). Sage.
- Hervas-Oliver, J.-L., Gonzalez, G., Caja, P., & Sempere-Ripoll, F. (2015). Clusters and industrial districts: Where is the literature going? Identifying emerging sub-fields of research. European Planning Studies, 23(9), 1827–1872. https://doi.org/https://doi.org/10.1080/09654313.2015.1021300
- Hirshleifer, D. (2015). Behavioral Finance. Annual Review of Financial Economics, 7(1), 133–159. https://doi.org/https://doi.org/10.1146/annurev-financial-092214-043752
- Hackbarth, D. (2008). Managerial traits and capital structure decisions. Journal of Financial and Quantitative Analysis, 43(4), 843–881. https://doi.org/https://doi.org/10.1017/S002210900001437X
- Hammond, R. C. (2015). Behavioral finance: Its history and its future [Selected Honors Theses] (pp. 1–45). https://firescholars.seu.edu/cgi/viewcontent.cgi?article=1030&context=honors
- Houlihan, P., & Creamer, G. G. (2017). Can sentiment analysis and options volume anticipate future returns? Computational Economics, 50(4), 669–685. https://doi.org/https://doi.org/10.1007/s10614-017-9694-4
- Howard, C. T. (2014). Behavioral portfolio management. Journal of Behavioral Finance and Economics, 1–37. https://www.emerald.com/insight/content/doi/10.1108/QRFM-04-2017-0028/full/html?fullSc=1
- Kahneman, D.,Knetsch, J. L., &Thaler, R. H. (1990). Experimental Tests of the Endowment Effect and the Coase Theorem. Journal of Political Economy, 98(6), 1325–1348. https://doi.org/https://doi.org/10.1086/261737
- Kahneman, D., &Tversky, A. (1982). Variants of uncertainty. Cognition, 11(2), 143–157. https://doi.org/https://doi.org/10.1016/0010-0277(82)90023-3
- Kahneman, D., &Tversky, A. (1972). Subjective probability: A judgment of representativeness. Cognitive Psychology, 3(3), 430–454. https://doi.org/https://doi.org/10.1016/0010-0285(72)90016-3
- Kahneman, D., & Tversky, A. (1979). Prospect theory: An analysis of decision under risk. Econometrica, 47(2), 263–291. https://doi.org/10.2307/1914185
- Koehler, J. J. (1993). The Influence of Prior Beliefs on Scientific Judgments of Evidence Quality. Organizational Behavior and Human Decision Processes, 56(1), 28–55. https://doi.org/https://doi.org/10.1006/obhd.1993.1044
- Kumer, S., & Goyal, N. (2015). Behavioural biases in investment decision making – a systematics literature review. Qualitative Research in Financial Markets, 7(1), 88–108. https://doi.org/https://doi.org/10.1108/QRFM-07-2014-002
- Kwon, H. R., & Silva, E. A. (2020). Mapping the Landscape of behavioural theories: Systematic literature review. Journal of Planning Literature, 35(2), 161–179.
- Lacalle, D. (2018). Are the effects of unconventional monetary policy on financial markets causing bubbles? Journal of Business Accounting and Finance Perspectives, 1(1), 95–117. https://www.dlacalle.com/en/paper-are-the-effects-of-unconventional-monetary-policy-on-financial-markets-causing-bubbles/
- Lakshmi, P., Visalakshmi, S., Thamaraiselvan, N., & Senthilarasu, B. (2013). Assessing the linkage of behavioural traits and investment decisions using SEM approach. International Journal of Economics andManagement, 7(2), 221–241. https://www.researchgate.net/publication/281676729_Assessing_the_linkage_of_behavioural_traits_and_investment_decisions_using_SEM_approach
- Lichtenstein, S., &Slovic, P. (1973). Response induced reversals of preference in gambling: An extended replication in Las Vegas. Journal of Experimental Psychology, 101(1), 16(1), 16.
- Lucey, B. M., & Dowling, M. (2005). The role of feelings in investor decision-making. Journal of Economic Surveys, 19(2), 211–237. https://doi.org/https://doi.org/10.1111/j.0950-0804.2005.00245.x
- Matsumoto, A. S, Fernandes, J. L., Chagas, P. C., & Oliveira, N. A. (2013). Overconfidence in individual and group investment decisions. Journal of International Finance and Economics, 13(1), 109–114. https://doi.org/https://doi.org/10.18374/JIFE-13-1.11
- Messis, P., & Zapranis, A. (2014). Herding behaviour and volatility in the Athens stock exchange. The Journal of Risk Finance, 15(5), 572–590. https://doi.org/https://doi.org/10.1108/JRF-04-2014-0054
- Michailova, J., Mačiulis, A., & Tvaronavičienė, M. (2017). Overconfidence, risk aversion and individual financial decisions in experimental asset markets. Economic Research, 30(1), 1119–1131. https://doi.org/https://doi.org/10.1080/1331677X.2017.1311234
- Mirji, A. B., & Prasantha, D. (2016). Preference pattern of investors in stock market-a case study of investors in North Karnataka region. IOSR Journal of Economics and Finance, 07(05), 50–52. https://doi.org/https://doi.org/10.9790/5933-0705025052
- Mittal, M. (2010). Study of differences in behavioral biases in investment decision-making between the salaried and business class investors. IUP Journal of Behavioral Finance, 7(4), 20–24. http://www.indianjournaloffinance.co.in/index.php/IJF/article/view/94879
- Moher, D., Liberati, A., Tetzlaff, J., & Altman, D. G. (2009). Preferred reporting items for Systematic reviews and meta-analyses. The PRISMA statement. PLoS Medicine, 6(7), e1000097. https://doi.org/https://doi.org/10.1371/ournal.pmed.100097
- Moher, D., Stewart, L., & Shekelle, P. (2015). All in the family: Systematic reviews, rapid reviews, scoping reviews, realisitic reviews and more. Systematic Reviews, 4(1), 183. https://doi.org/https://doi.org/10.1186/s13643-015-016-7
- Moore, D. A., &Healy, P. J. (2008). The troublewith overconfidence. Psychological Review, 115(2), 502
- Nenkov, G. Y., Inman, J. J., Hulland, J., & Morrin, M. (2009). The impact of outcome elaboration on susceptibility to contextual and presentation biases. Journal of Marketing Research (JMR), 46(6), 764–776. https://doi.org/https://doi.org/10.1509/jmkr.46.6.764
- Odean, T. (1998). Volume, volatility, price, and profit when all traders are above average. Journal of Finance, 53(6), 1887–1934. https://doi.org/https://doi.org/10.1111/0022-1082.00078
- Oh, C., & Sheng, O. (2011, December). Investigating predictive power of stock micro blog sentiment in forecasting future stock price directional movement. In ICIS (pp. 1–19). http://www.misrc.umn.edu/workshops/2011/fall/OliviaSheng_Paper.pdf
- Oxman, A. D., & Guyatt, G. H. (1991). Validation of an index of the quality of review articles. Journal of Clinical Epidemiology, 44(11), 1271–1278.
- Petticrew, M., & Roberts, H. (2006, January). Systematic reviews in the social sciences: A practical guide. Wiley. https://doi.org/https://doi.org/10.1002/978047074887
- Piccoli, P., & Chaudhury, M. (2018). Overreaction to extreme market events and investor sentiment. Applied Economics Letters, 25(2), 115–118. https://doi.org/https://doi.org/10.1080/13504851.2017.1302052
- Piñeiro-Chousa, J., Vizcaíno-González, M., & Pérez-Pico, A. M. (2017). Influence of social media over the stock market. Psychology & Marketing, 34(1), 101–108. https://onlinelibrary.wiley.com/doi/abs/10.1002/mar.20976
- Qiu, L., Welch, I. (2004). Investor sentiment measures (No. w10794). National Bureau of Economic Research. https://www.nber.org/papers/w10794
- Richards, D., Rutterford, J., Fenton-O’Creevy, M. (2011). Do stop losses work? The disposition effect, stop losses and investor demographics. The Open University Business School Working Paper. https://pdfs.semanticscholar.org/a04e/98015245a00b6e829f0cd6b6e1261e32601d.pdf
- Sadi, R., Asl, H. G., Rostami, M. R., Gholipour, A., & Gholipour, F. (2011). Behavioral finance: The explanation of investors’ personality and perceptual biases effects on financial decisions. International Journal of Economics and Finance, 3(5), 234–241. https://doi.org/https://doi.org/10.5539/ijef.v3n5p234
- Sharma, A. J., &Dibrugarh, A. I. (2014). Understanding Cognitive Dissonance-The Behavioural Finance Principle. International Journal of Commerce, Business and Management, 3(1), 18–27.
- Shefrin, H., & Statman, M. (1985). The disposition to sell winners too early and ride losers too long: Theory and evidence. Journal of Finance, 40(3), 777–790. https://doi.org/https://doi.org/10.2307/2327802
- Shiller, R. J. (2003). From efficient markets theory to behavioral finance. Journal of Economic Perspectives, 17(1), 83–104. https://doi.org/https://doi.org/10.1257/089533003321164967
- Sprenger, T., Tumasjan, A., Sandner, P., & Welpe, I. M. (2014). Tweets and trades: The information content of stock microblogs. European Financial Management, 20(5), 926–957. https://doi.org/https://doi.org/10.1111/j.1468-036X.2013.12007.x
- Suresh, A. (2013). Understanding behavioral finance through biases and traits of trader vis-à-vis investor. Journal of Finance, Accounting and Management, 4(2), 11–25. https://docplayer.net/31373614-Understanding-behavioral-finance-through-biases-and-traits-of-trader-vis-a-vis-investor-dr-anli-suresh-assistant-professor-of-commerce.html
- Tesar, L. L., &Werner, I. M. (1995). Home bias and high turnover. Journal of International Money and Finance, 14(4), 467–492.
- Thaler, R. H., &Johnson, E. J. (1990). Gambling with the house money and trying to break even: The effects of prior outcomes on risky choice. Management science, 36(6), 643–660.
- Thaler, R. (1985). Mental Accounting and Consumer Choice. Marketing Science, 4(3), 199–214. https://doi.org/https://doi.org/10.1287/mksc.4.3.199
- Thaler, R. (1980). Toward a positive theory of consumer choice. Journal of Economic Behavior & Organisation, 1(1), 39–60. https://www.sciencedirect.com/science/article/pii/0167268180900517
- Thomas, J., &Harden, A. (2008). Methods for the thematic synthesis of qualitative research in systematic reviews. BMC Medical Research Methodology, 8(45), 1–10.
- Ting, K. M. (2017). Confusion matrix. In Sammut C. & Webb G. I. (Eds.), Encyclopedia of machine learning and data mining. Springer.
- Tumarkin, R., & Whitelaw, R. F. (2001). News or noise? Internet postings and stock prices. Financial Analysts Journal, 57(3), 41–51. https://doi.org/https://doi.org/10.2469/faj.v57.n3.2449
- Tversky, A., &Kahneman, D.(1989). Rational choice and the framing of decisions. In Multiple criteria decision making and risk analysis using microcomputers (pp. 81–126). Berlin Heidelberg: Springer.
- Wolf, E. (2005). Why the house always wins: A behavioral perspective on investor trading in the stock market? SSRN: https://ssrn.com/abstract=2026577
- Yang, C., Zhou, L. (2015). Sentiment approach to underestimation and overestimation pricing model. Economic Modelling, 51, 280–288. https://www.researchgate.net/publication/282419993_Sentiment_approach_to_underestimation_and_overestimation_pricing_model
- Zahera, S. A., & Bansal, R. (2018). Do investors exhibit behavioral biases in investment decisionmaking? Qualitative Research in Financial Markets, 10(2), 210–251. www.emeraldinsight.com/1755-4179.htm
- Zhang, W., Li, X., Shen, D., & Teglio, A. (2016). Daily happiness and stock returns: Some international evidence. Physica A-Statistical Mechanics and Its Applications, 460, 201–209. https://doi.org/10.1016/j.physa.2016.05.026
- Zhou, R., & Pham, M. T. (1984). Journal of consumer research. Serials Review, 10(2), 34. https://doi.org/https://doi.org/10.1016/0098-7913(84)90029-7