
 ?Mathematical formulae have been encoded as MathML and are displayed in this HTML version using MathJax in order to improve their display. Uncheck the box to turn MathJax off. This feature requires Javascript. Click on a formula to zoom.
Abstract
This paper aims to research whether the varieties of capitalism impact the relationship between social capital and inequality in developed economies (coordinated and liberal economies) and Latin America (hierarchical economies) in the period from 2000 to 2016. To do that, the study uses a panel analysis of developed economies and Latin America, that is, a fixed effect panel static analysis. The model includes one dependent variable (Gini index) and ten independent variables (generalised trust, informal economy, years of schooling, union density, market capitalization, annual gross domestic product, gross domestic product per capita, health expenditure, feminine labour force, and gross capital). The findings show that the relationship between inequality and social capital is negative and significant and that hierarchical economies (Latin America) amplified such a relationship.
1. Introduction
Latin America is the region with the greatest inequality in the world – even higher than sub-Saharan Africa (The World Bank, Citation2004). This fact is not new and is explained by a large number of factors, ranging from socio-cultural to economic. Piketty (Citation2014) pointed out that the main cause of the increase in inequality, in the medium and long run, is an interest rate that is higher than economic growth, which applies to Latin America, as the increase in inequality in the last four decades coincides with low economic growth in the region. Other explanations include the role of inclusive institutions in reducing inequality (Hartmann et al., Citation2017). Putnam (Citation2000) analysed the impact of social capital on income inequality, while several studies found that an increase in generalised trust negatively affects inequality (Delhey & Newton, Citation2005; Kawachi et al., Citation1997; Knack & Keefer, Citation1997; Wilkinson & Pickett, Citation2009).
The analysis of the relationship between inequality and social capital is important because it links aspects that occur in the labour market with the trust of individuals to the rest of society. In this way, if workers, through the labour unions, intervene, directly or indirectly, in the setting of salaries, the wage gap will tend to be smaller. The latter has two effects – on the one hand, a reduction in inequality, and on the other hand, an increase in the workers’ trust because they feel that they are part of the firm decision-making. Overall, the relationship between social capital and inequality shows the institutional choices that society makes in relation to the varieties of capitalism.
In the literature on varieties of capitalism, Hall and Soskice (Citation2001) concluded that institutional competitive advantages are a consequence of institutional complementarities. These authors consider that there are two ways in which companies solve their coordination problems. One is through formal institutions, that is, written laws, contracts, etc. Another is through informal institutions. The first case of such varieties of capitalism involves the Liberal Market Economies (LMEs), with institutional competitive advantages in services. In this case, the model country is the United States. The second case is the Coordinated Market Economies (CMEs), with institutional competitive advantages in advanced manufactures. In this case, the model country would be Germany. In the first case, there are radical innovations and workers do not intervene in the firm decision-making. Meanwhile, in the second case, there are incremental innovations with workers in the firm decision-making. With regard to Latin America, Schneider (Citation2009) pointed out that the model of Hall and Soskice (Citation2001) cannot be applied in developing countries because organisations assume the role of institutions. Schneider (Citation2013) pointed out that Latin America has Hierarchical Market Economies (HMEs), with the following organisations: ‘diversified business groups, multinationals, low-skilled labour and atomistic labour relations’ (p. 553).
Previous studies have not considered the impact of the varieties of capitalism on the relationship between social capital and inequality. This is important because in these three types of capitalism (LMEs, CMEs, and HMEs), the different institutional complementarities and institutional comparative advantages mean that the wage gap and generalised trust vary.
We argued that, to analyse the relationship between inequality and social capital, it is necessary to consider the varieties of capitalism, that is, whether countries are CMEs, LMEs, or HMEs. Thus, in the case of Latin America, the relationship between inequality and social capital is different from the relationships in other varieties of capitalism because the organisations that Schneider pointed out have permeated this relationship, unlike formal (LMEs) and informal (CMEs) institutions. The paper aims to show that the relationship between social capital and inequality is affected by the varieties of capitalism and that, in the Latin America case, its HMEs have a direct effect on this relationship. To do the above, we analyse LMEs, CMEs, and HMEs through the fixed effects panel data model, which estimates the effect of generalised trust, a set varieties of capitalism variables, and the Gini index, to determine whether the relationship between the previous variables is affected by the varieties of capitalism.
The findings show that the relationship between generalised trust and the Gini index is amplified in HMEs. Furthermore, union density, years of schooling, informal economy, and market capitalization affect inequality.
2. Literature review
The study aims to examine the effect of the varieties of capitalism on the relationship between social capital and income inequalities in Latin America. Most authors have observed the existence of a negative correlation between income inequalities and social capital. Other studies argue the null relationship between both variables when control variables are included. However, such papers do not consider how the institutional configuration (varieties of capitalism) influences this relationship. Those studies are characterised by differences of sample analysis in countries, econometric techniques, control and instrumental variables, and the selected analysis periods.
Overall, several empirical studies, developed in recent years, are presented (see ). Such studies are classified into two groups. The first group shows papers that confirm the effect of social capital, ethnic diversity, and race on income inequalities. The second group shows results that confirm the null relationship between both variables.
Table 1. Comparative studies: Social capital and economic inequalities.
The first group describes the results in the relationship between social capital and income inequalities. Within this group are papers at the regional level. For example, Putnam (Citation2000) pointed out that aspects such as suburbanisation, the pressures of time and money, incorporating females into the labour market, generational change, and technology negatively impact social capital, concluding that states with high social capital generate income equality that diminishes economic disparities.
Narayan and Pritchett (Citation1999) considered that societies have exogenous factors – such as social capital, education, assets, and the gender of the head of the family – that have a positive effect on household income. When the members of communities have associative and communal relations, they provide access to different services and economic improvement.
Subsequent studies confirmed that an increase in social capital increases average earnings (Robison et al., Citation2011). According to Ram (Citation2013), when such a relationship is analysed in a labour context, generalised trust creates a sense of honesty and respect by the receipt of compensation that helps mitigate wage inequalities. Similar results occur with the inclusion of explanatory variables such as polarisation and race and ethnic diversity (Alesina & La Ferrara, Citation2000; Costa & Kahn, Citation2003; Ivarsflaten & Strømsnes, Citation2013; Paarlberg et al., Citation2018; Wright, Citation2015).
Other studies conducted analyses at the transnational level. For instance, Kawachi et al. (Citation1997) showed that the wage gap between rich and poor generates disinvestment in generalised trust and in community participation, causing an increase in mortality among the countries. Meanwhile, homogenous ethnicities and high educational levels develop strong trust and dense civic norms.
Delhey and Newton (Citation2005) determined that there is no causal relationship between generalised trust and wage inequalities. However, they argue that economies with high interpersonal trust have ethnic homogeneity, government effectiveness, national wealth, and income equality. Similarly, Wilkinson and Pickett (Citation2009) studied various well-being measures in developed countries and concluded that countries with high income inequality have levels of interpersonal trust of 15%, while countries with low income inequality have trust of around 60–65%.
Barone and Mocetti (Citation2016) conducted a quantitative econometric study of 60 post-industrial and developing countries, using different variables to quantify income inequalities, control variables, and instrumental variables. They concluded that there is a correlation between income inequalities and generalised trust for developed countries but that this effect is not significant for developing regions (Bjørnskov, Citation2007; Gallego, Citation2016; Olivera, Citation2015).
The second group of studies found no relationship between capital and income inequalities. Fairbrother and Martin (Citation2013) conducted quantitative research through cross-sectional and longitudinal data in various counties of the United States. In analysing the cross-sectional data, the study showed the causal effect of income inequality and social capital, although this was not the case with the longitudinal data.
Similar results occurred in Ioakimidis and Heijke (Citation2016). They argued that socio-cultural factors affect the relationship between income inequality and social capital. In their research, they applied multiple regressions for 17 European countries, using the type of regime, GDP per capita, education, percentage of urbanisation, and government spending. The results confirmed that income inequalities do not affect generalised trust. The previous variable is related to the democratic regime (Liu et al., Citation2017; Steijn & Lancee, Citation2011).
The previous research examined the correlational and causal relationship of civic participation, social trust, and economic disparities. However, no research examines how such an effect varies by including the institutional configuration of capitalism. We argue that the reduction of social capital (generalised trust) means that various economic actors do not achieve joint profits, benefiting certain interest groups, such as managers, owners, and investors (elite groups), and generating an increase in inequalities of income in HMEs.
3. Data and methodology
3.1. Data
To demonstrate whether capitalism varieties negatively affect the relationship between social capital and income inequalities for HMEs, we examined longitudinal data from spatial and temporal dimensions. Because dimension had the same number of observations, we used a balanced data panel with effects fixed for 29 countries. This analysis was applied from 2000 to 2016. The sample was divided into three varieties of capitalism. Thirteen of the countries were classified, according to Schneider and Karcher (Citation2010), as HMEs. Another 16 economies were divided using Hall and Soskice’s scheme; six fell into LMEs and 10 fell into CMEs. shows these classifications.
Table 2. Countries by type varieties of capitalism.
Regarding variables, income inequalities were analysed like dependent variable. Previous research shows how the decrease in generalised trust and low participation in networks contributed to greater income inequalities. In terms of the income distribution channel, it was analysed in a manner similar to that of various international investigations (Berisha & Meszaros, Citation2018; Mishra, Citation2018; Mouw, Citation2003; Pedauga et al., Citation2017).
We used the data on the standardised global income inequality data (SWIID). The missing data were estimated using the cross-section multiple imputation method. We used the Gini index, which represents the distribution of income in the family market (before taxes and transfers), published in the 2014 version of the SWIID project (Solt, Citation2016). The coefficient assumes values from 0 (perfect equality) to 100 (perfect inequality). As noted by Solt (Citation2016), SWIID maximises comparability between countries and extended periods of available information on income inequalities.
Generalised trust was regarded as the independent variable. Several papers measure social capital from a multidimensional perspective, using variables such as social trust, participation in networks, and informal social norms (Hawes et al., Citation2013; Keele, Citation2005). However, current international research uses generalised trust as a social capital (Barone & Mocetti, Citation2016; Olivera, Citation2015). Generalised trust data were obtained from three databases: Latinobarómetro (Citation2018), which provided information for the Latin economies, the World Values Survey (Citation2018), and the European Social Survey (Citation2018), which includes data for European countries. In the case of missing data, the cross-section multiple imputation method was implied. The World Values Survey and the Latinobarómetro apply the same question: Would you say most people can be trusted, or should you be very careful when dealing with people? The possible answers are I) Most people can be trusted, II) I need to be very careful, III) No answer, and IV) Does not know. The weighting was performed with the percentage of people who believe they can trust most people, to determine the annual trust between countries. ESS considers the following question: Would you say that you can trust most people, or that you cannot be too careful when dealing with people? The answers range from 0 to 10. A score of 0 implies lower confidence, while 10 implies greater confidence. We use the sum of the percentage of the scale of the responses from 6 to 10.
For the case of variables related to varieties of capitalism, we used the country scheme proposed by Hall and Soskice (Citation2001), Schneider and Karcher (Citation2010) and Borges et al. (Citation2020). CMEs carry out wage negotiations with the intervention of employers’ associations and the labour union. Financing is based on their business networks and banks. Skill development is characterized by the acquisition of specific skills. The informal economy is low compared to hierarchical economies. LMEs base the coordination of labour relations on the market; therefore, union participation and union bargaining are low. Education and vocational training are general; corporate governance focuses on managers for decision-making. This type of economy has low levels in the informal economy. HMEs have a high informal labour market. Therefore, labour relations have fluid and short-term links between the company and workers and union participation is low. In addition, workers have limited skills and there is little development of financial markets.
We examined how institutional indicators condition the effects of social capital and income inequalities. In particular, we studied how the indicator of labour relations (union density) influences the effect of social capital. Union density measures the number of workers affiliated with unions, expressed as a percentage of the total number of workers. Data on union density is drawn from the International Labour Organization (Citation2018), Visser (Citation2016), and the Organization for Economic Co-operation and Development (Citation2018). Missing data were calculated using the cross-sectional multiple imputation method. Another indicator was the informal economy. This variable means self-employed workers. Informal economy data were obtained from World Development Indicators (WDI Citation2018a, Citation2018b, Citation2018c, Citation2018d, Citation2018e, Citation2018f, Citation2018g). The stock market capitalisation was obtained from WDI (Citation2018a, Citation2018b, Citation2018c, Citation2018d, Citation2018e, Citation2018f, Citation2018g). Finally, we studied the years of schooling (average); this variable was obtained from Human Development Reports (Citation2018).
The following control variables were considered: GDP growth per capita (annual %) and GDP per capita (Ishak, Citation2008; Royuela et al., Citation2019; Saucedo Acosta et al., Citation2016). GDP per capita means the total gross domestic product in dollar rates using purchasing power parity, while GDP growth reflects the annual percentage growth rate of GDP per capita. These data were obtained from WDI (Citation2018a, Citation2018b, Citation2018c, Citation2018d, Citation2018e, Citation2018f, Citation2018g). Additionally, we used a control variable related to the concept of social expenditure: health expenditure. Health spending measures the services that are invested in health annually. Health spending data were obtained from WDI (Citation2018a, Citation2018b, Citation2018c, Citation2018d, Citation2018e, Citation2018f, Citation2018g). Another control variable was the feminine labour force. Studies have shown that gender inequalities can increase wage gaps (Ukhova, Citation2015). Therefore, the feminine labour force was used as a control variable. The data were extracted from the WDI (Citation2018a, Citation2018b, Citation2018c, Citation2018d, Citation2018e, Citation2018f, Citation2018g). Finally, we used gross capital formation as a control variable. This reflects the investment in fixed assets, such as improvements in land, roads, schools, and transportation, among others. Data on gross capital formation were drawn from the WDI (Citation2018a, Citation2018b, Citation2018c, Citation2018d, Citation2018e, Citation2018f, Citation2018g). provides a brief description of the analysis variables.
Table 3. Variables included in the analysis.
shows a summary of selected data. The standard deviation indicates considerable heterogeneity. However, in the context of the analysis of temporal dimensions, the existence of such a variation is a good prerequisite for econometric analysis, as evaluating the impact of the independent variables (Buterin et al., Citation2017).
Table 4. Summary statistics by varieties of capitalism.
3.2. Estimation strategy
3.2.1. Correlation analysis
It is important to include the relationship between the dependent variable and the explanatory and control variables because the correlation analysis shows that the variables are interconnected. However, the coefficient value should never be 1, which indicates that the variables have the same information.
shows the correlation analysis of our study variables. The first segment refers to the relationship between the dependent and explanatory variables. It can be seen that most of the variables used in the model are correlated with each other and that their relationship with the dependent variable is negative. This is in line with what was expected when analysing the set of variables. However, such a negative relationship does not occur with the informal economy variable (E). Studies consider that developing economies with high levels of poverty and economic inequalities have higher levels of informal economy (E) (Chen, Citation2016; Dasgupta & Lloyd-Jones, Citation2018). On the order hand, the relationship between generalised trust (T) and the informal economy (E) is high and negatively correlated. In this sense, it is reasonable to observe that societies that have high levels of an informal economy (E) are associated with lower levels of social trust. This relationship is possible when societies have power relations and extractive institutions (Coletto et al., Citation2018).
Table 5. Correlation matrix.
The least related variables are union density (W) and market capitalisation (M). The second segment in refers to the control variables. GDP per capita (GDPPC) is the highest related variable with the Gini index, and in a related positive with all the explanatory variables. Annual GDP (AGDP) and gross capital (GC) are the least correlated with the dependent and explanatory variables.
3.2.2. Panel data
Panel analysis is a method that takes observations of time on different units, regularly with a smaller range of time series data, which is suitable for setting up this model. The most used methods in these cases (with a small temporal or spatial dimension) are the methods of fixed and random effects. We used balanced data for 29 countries over 17 years. The missing data were estimated using a multiple imputation model proposed for time-series cross-section data by Honaker and King (Citation2010). Overall, the decision was made to compare three different models.
The shape of the models used here is as follows:
(1)
(1)
(3)
(3)
where
and G are the vectors of regression coefficients measuring the association of the dependent variable Gini index (
with the explanatory variables,
is the generalised trust,
is the informal economy,
is the years of schooling,
is the union density, and
is the market capitalisation. In the second model,
and
are the estimation of the slope differences with regard to CME. The third model included the following control variables: feminine labour force
annual GDP
GDP per capita (
gross capital (
), and Health expenditure (
).
When is correlated with regressors, a model of fixed effects (FEM) is more appropriate. On the other hand, when the distribution of
is normal, the method of random effects (REM) is better.
The estimation of the models was made using a fixed effect transformation, also called within transformation. This estimation method ‘uses the time-demeaning on each explanatory variable including things like time-period dummies – and then do a pooled OLS regression using all time-demeaned variables’ (Wooldridge, Citation2013, p.485). The fixed effects model (a.k.a. within or least squares dummy variables), usually estimated by OLS on transformed data, and gives consistent estimates for β. The package PLM of R, version 3.6.2, make a transformation of the data: where T is the time periods, n is the number of individuals, j a vector of one length T and In the identity matrix. It returns a vector containing the values in deviation from the individual means (Croissant & Millo, Citation2008).
The fixed effect transformation is unbiased, under an exogeneity assumption on the explanatory variables (Wooldridge, Citation2013). It was used the Hausman test or Durbin Wu Hausman test, to test the exogeneity assumption, and the model fixed effect was chosen over the random effect.
In the model 2, variables of varieties of capitalism were added, which show the interaction with the generalized trust. The model 3 includes control variables, in order to corroborate the consistency of the model, given the limitation that the Hausman test (Vinod, Citation2019).
4. Results
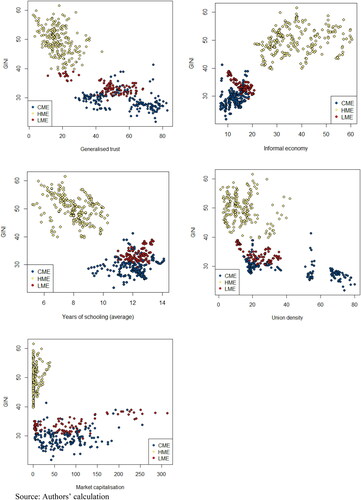
shows some relationships between the Gini index and a set of independent variables. The first graph (upper left hand) of shows the relationship between inequality and generalised trust (2000–2016) for 29 countries. Overall, this graph indicates a negative relationship between the previous variables. However, the relationship is clearer among HMEs than it is among CMEs and LMEs. The second graph (upper right hand) shows that the relationship between the Gini index and the informal economy appears to be positive for the whole sample, but negative for LMEs. The third graph (middle, left hand) indicates that there is a negative relationship between inequality and years of schooling for the whole sample. However, this relationship is stronger for HMEs and appears to be negative for LMEs; for CMEs, there is no clear relationship. The fourth graph (middle, right hand) illustrates the negative relationship between the Gini index and union density for the whole sample and applied for the three groups of countries. Finally, the fifth graph (bottom, left hand) shows that there is no clear relationship between inequality and market capitalization for the whole sample or for HMEs. Nevertheless, for LMEs and CMEs, the previous relationship appears to be positive.
Figure 1. Plots of Gini index and independent variables, by variety of capitalism, 2000-2016. Source: Authors’ calculation
shows the relationship between inequality and a group of independent variables, using a fixed-effects regression model. Model 1 shows the relationship among the inequality (Gini index) and a set of explanatory variables (generalised trust, informal economy, mean years of schooling, union density and market capitalisation). The results show a significant and negative relationship between the Gini index and generalized trust, which supports our argument. The coefficients of the varieties of capitalism variables have the expected signs: The informal economy variable is significant and positively affects inequality, while years of schooling and union density are significant and negatively affect inequality. The effect of years of schooling is higher than generalised trust and union density in reducing inequality.
Table 6. Fixed effects model (FEM). Dependent variable: Gini index.
In model 2, the Gini index was regressed with the same variables as in model 1, and a factor variable was introduced that estimates the effect of the generalized trust by varieties of capitalism on the relationship with inequality.
The CME was considered as a base (i.e. null correlation), HME generalized trust has a stronger negative and significant correlation with the Gini index (−0.272), while LME generalised trust is negative and significant (−0.089), but smaller than HME (), which is in line with our argument. The union density coefficient is significant and negative (−0.103) and the market capitalisation coefficient is significant and positive, which is in line with the varieties of capitalism theory. The marginal effect of generalised trust (model 2) is higher in HMEs than in CMEs and LMEs, which means that small increases in Latin American countries’ generalised trust lead to high reductions in the inequality of this region.
In model 3, the Gini index was regressed with the same variables as model 1 and five control variables. The results show that the coefficient of generalised trust remains negative and significant (−0.141), which also supports our argument. The variables of years of schooling and union density have a negative and significant relationship with inequality (as in model 1), while the informal economy variable has a positive relationship with the Gini index. The GDP per capita variable has a negative relationship with inequality, which means that increases in GDP per capita tend to reduce inequality.
Overall, the three models of show the negative effect of union density on inequality levels, while two models present the high effect of education on the reduction of inequality. The variables of varieties of capitalism indicate that the effect of generalised trust varies across the type of capitalism, and HMEs have a higher marginal effect (of generalised trust) on inequality.
5. Discussions and conclusions
The paper aimed to show how the varieties of capitalism – which for this study were HMEs, LMEs, and CMEs – affect the relationship between inequality and generalised trust. The results showed evidence that the relationship between inequality and social capital is stronger in HMEs than in LMEs/CMEs – that is, in economies with low levels of inequality, changes in generalised trust do not affect the Gini index.
The obtained results support our argument because they showed that in the cluster formed by HMEs, the relationship between inequality and social capital (generalised trust) is stronger. Latin American countries show levels of inequality ranging from a Gini index of 35 to 50, while generalised trust ranges from almost 10 to 25. The relationship is negative and stronger than CME and LME. In this sense, when a country is an HME, it tends to show a negative relationship between inequality and generalised trust.
Our results coincide with those of Putnam (Citation2000) and Narayan and Pritchett (Citation1999) because high levels of social capital imply low inequality, which would be the case with CMEs. These authors analysed communities and sub-national entities, while, in our case, we used countries. However, the results are the same because countries, states, and communities with high levels of social capital tend to have low levels of inequality. Ram (Citation2013) focused on the labour context but the results are similar to those we found: High levels of generalised trust tend to decrease wage inequality.
Kawachi et al. (Citation1997), Knack and Keefer (Citation1997), and Delhey and Newton (Citation2005) obtained results similar to those presented. They indirectly showed the existence of a negative relationship between inequality and social capital in an international context. Wilkinson and Pickett (Citation2009) found quantitative results that support the idea that CMEs have high levels of social capital associated with low inequality, while HMEs are characterized by low levels of social capital and high levels of inequality. On the other hand, our results do not coincide with those of Fairbrother and Martin (Citation2013) because, in our study, the link between inequality and generalised trust in developing countries (HMEs) is stronger than it is in developed countries (CMEs). The results obtained do not coincide with those of a group of scholars who believe that income inequalities do not affect social capital (Ioakimidis & Heijke, Citation2016; Liu et al., Citation2017; Steijn & Lancee, Citation2011).
The main weakness of the paper is that we used only the Gini index as a dependent variable. We could improve the econometric analysis if we include the Palma ratio and the 1% income concentration as dependent variables.
Additionally, from the results, we can consider that hierarchical capitalism generates conditions for workers to receive low salaries because the competitive advantages are commodities and simple manufactures. This fact, on the one hand, increases income inequality between low-skilled workers and the managers and owners of companies with high profit rates. On the other hand, it reduces generalised trust because workers do not see hierarchical capitalism as fair.
The results showed that the varieties of capitalism framework affects the relationship between social capital and inequality. From the above, the following questions could arise What organisations, in the sense of Schneider (Citation2013), most affect inequality and social capital in Latin America? Did the reconfiguration of these organisations have some effects on the fall of inequality and the increase in social capital in the 2000s in Latin America? Future research should focus on how the organisations that Schneider proposed have affected inequality and social capital in Latin America.
This paper presents new evidence to explain the relationship between inequality and social capital through the use of varieties of capitalism. The original contribution shows that in Latin America, there is hierarchical capitalism that strengthens the negative relationship between inequality and generalised trust. In the 2000s, there was a fall in inequality in most Latin American countries, which this study explains by the strong link between this variable and social capital. The original contribution of this paper can be generalised not only for Latin America but also for HMEs around the world.
Our conclusions show that the relationship between inequality and social capital is stronger in HMEs, which can be regarded as an advance in the current state of research on the determinants of inequality in Latin America.
Disclosure statement
No potential conflict of interest was reported by the author(s).
References
- Alesina, A., & La Ferrara, E. (2000). Participation in heterogeneous communities. Quarterly Journal of Economics, 115(3), 847–904. https://doi.org/https://doi.org/10.1162/003355300554935
- Atkinson, A. B., &Piketty, T. (2010). Top Incomes A Global Perspective. New York: Oxford University Press Inc. Retrieved from http://piketty.pse.ens.fr/files/AtkinsonPiketty2010.pdf
- Barone, G., & Mocetti, S. (2016). Inequality and trust: New evidence from panel data. Economic Inquiry, 54(2), 794–809. https://doi.org/https://doi.org/10.1111/ecin.12309
- Berisha, E., & Meszaros, J. (2018). Household debt, consumption, and income inequality. International Economic Journal, 32(2), 161–176. https://doi.org/https://doi.org/10.1080/10168737.2018.1481874
- Bjørnskov, C. (2007). Determinants of generalized trust: A cross-country comparison. Public Choice, 130(1-2), 1–21. https://doi.org/https://doi.org/10.1007/s11127-006-9069-1
- Borges, M., Saucedo-Acosta, E. J., & Diaz, J. (2020). The effect of varieties of capitalism on the relationship of institutional gearing and economic growth. Engineering Economics, 31(3), 262–269. https://doi.org/https://doi.org/10.5755/j01.ee.31.3.22852
- Buterin, V., Škare, M., & Buterin, D. (2017). Macroeconomic model of institutional reforms’ influence on economic growth of the new EU members and the Republic of Croatia. Economic Research-Ekonomska Istraživanja, 30(1), 1572–1593. https://doi.org/https://doi.org/10.1080/1331677X.2017.1355260
- Chen, M. A. (2016). The informal economy: Recent trends. Future Directions. A Journal of Environmental and Occupational Health Policy, 26(2), 1–18. https://doi.org/https://doi.org/10.1177/1048291116652613
- Coletto, D., Vittucci, G., & Marzetti, G. V. (2018). Informal economy and extractive institutions. Review of Economics and Institutions, 9(1), 36. https://doi.org/https://doi.org/10.5202/rei.v9i1.240
- Costa, D., & Kahn, M. (2003). Understanding the decline in American social capital, 1953-1998. Kyklos, 56(1), 17–46. https://doi.org/https://doi.org/10.1111/1467-6435.00208
- Croissant, Y., & Millo, G. (2008). Panel data econometrics in R: The plm package. Journal of Statistical Software, 27(2), 1–43. https://doi.org/https://doi.org/10.18637/jss.v027.i02
- Dasgupta, N., & Lloyd-Jones, T. (2018). Heterogeneity and vulnerability in the urban informal economy: Reworking the problem in the current context. The case of Uganda. World Development Perspectives, 10-12(0), 64–72. https://doi.org/https://doi.org/10.1016/j.wdp.2018.09.008
- Delhey, J., & Newton, K. (2005). Predicting cross-national levels of social trust: Global pattern or Nordic exceptionalism? European Sociological Review, 21(4), 311–327. https://doi.org/https://doi.org/10.1093/esr/jci022
- European Social Survey. (2018). Data base. https://www.europeansocialsurvey.org/data/themes.html?t=media
- Fairbrother, M., & Martin, I. W. (2013). Does inequality erode social trust? Results from multilevel models of US states and counties. Social Science Research, 42(2), 347–360. https://doi.org/https://doi.org/10.1016/j.ssresearch.2012.09.008
- Gallego, A. (2016). Inequality and the erosion of trust among the poor: Experimental evidence. Socio-Economic Review, 14(3), 443–460. https://doi.org/https://doi.org/10.1093/ser/mww010
- Hall, P. A., Soskice, D. W. (2001). Varieties of capitalism. New York: Oxford University Press Inc. http://books.google.com/books?id=gvAhEcF6G3oC&pgis=1
- Hartmann, D., Guevara, M. R., Jara-Figueroa, C., Aristarán, M., & Hidalgo, C. A. (2017). Linking economic complexity, institutions, and income inequality. World Development, 93, 75–93. https://doi.org/https://doi.org/10.1016/j.worlddev.2016.12.020
- Hawes, D., Rocha, R., & Meier, K. (2013). Social capital in the 50 states: Measuring state-level social capital, 1986-2004. State Politics and Policy Quarterly, 13(1), 121–138. https://doi.org/https://doi.org/10.1177/1532440012460057
- Honaker, J., & King, G. (2010). What to do about missing values in time-series cross-section data. American Journal of Political Science, 54(2), 561–581. https://doi.org/https://doi.org/10.1111/j.1540-5907.2010.00447.x
- Human Development Reports. (2018). Database. http://hdr.undp.org/en/data
- International Labour Organization. (2018). Database. Retrieved December 15, 2018, from, https://ilostat.ilo.org/
- Ioakimidis, M., & Heijke, H. (2016). Income inequality and social capital, are they negatively related? European cross country analyses 2006-2012. The Journal of Developing Areas, 50(1), 215–235. https://doi.org/https://doi.org/10.1353/jda.2016.0018
- Ishak, S. (2008). Economic growth and income inequality. Journal of the Asia Pacific Economy, 5(1/2), 112–124. https://doi.org/https://doi.org/10.1080/13547860008540786
- Ivarsflaten, E., & Strømsnes, K. (2013). Inequality, diversity and social trust in Norwegian communities. Journal of Elections, Public Opinion and Parties, 23(3), 322–342. https://doi.org/https://doi.org/10.1080/17457289.2013.808643
- Kawachi, I., Kennedy, B. P., Lochner, K., & Prothrow-Stith, D. (1997). Social capital, income inequality, and mortality. American Journal of Public Health, 87(9), 1491–1498. https://doi.org/https://doi.org/10.2105/ajph.87.9.1491
- Keele, L. (2005). Macro measures and mechanics of social capital. Political Analysis, 13(2), 139–156. https://doi.org/https://doi.org/10.1093/pan/mpi008
- Knack, S., & Keefer, P. (1997). Does social capital have an economic payoff? A cross-country. Quarterly Journal of Economics, 112(4), 1251–1288. http://www.jstor.org/stable/2951271
- Latinobarómetro. (2018). Database. http://www.latinobarometro.org/lat.jsp
- Liu, B., Wei, Y., & Simon, C. (2017). Social capital, race, and income inequality in the United States. Sustainability, 9(2), 248. https://doi.org/https://doi.org/10.3390/su9020248
- Mishra, A. K. (2018). Household income inequality and income mobility: Implications towards equalizing longer-term incomes in India. International Economic Journal, 32(2), 271–290. https://doi.org/https://doi.org/10.1080/10168737.2018.1480640
- Mouw, T. (2003). Social capital and finding a job: Do contacts matter? American Sociological Review, 68(6), 868. https://doi.org/https://doi.org/10.2307/1519749
- Narayan, D., & Pritchett, L. (1999). Cents and sociability: Household income and social capital in Rural Tanzania. Economic Development and Cultural Change, 47(4), 871–897. https://doi.org/https://doi.org/10.1086/452436
- Olivera, J. (2015). Changes in inequality and generalized trust in Europe. Social Indicators Research, 124(1), 21–41. https://doi.org/https://doi.org/10.1007/s11205-014-0777-5
- Organization for Economic Co-operation and Development. (2018). Trade unions: Trade union density. Database. https://www.oecd-ilibrary.org/employment/data/trade-unions/trade-union-density_data-00371-en
- Paarlberg, L. E., Hoyman, M., & McCall, J. (2018). Heterogeneity, income inequality, and social capital: A new perspective. Social Science Quarterly, 99(2), 699–710. https://doi.org/https://doi.org/10.1111/ssqu.12454
- Pedauga, L. E., Pedauga, L. D., & Delgado-Márquez, B. L. (2017). Relationships between corruption, political orientation, and income inequality: Evidence from Latin America. Applied Economics, 49(17), 1689–1705. https://doi.org/https://doi.org/10.1080/00036846.2016.1223830
- Piketty, T. (2014). El capital en el siglo XXI. Fondo de cultura ecocómica.
- Putnam, R. (2000). Bowling alone: America’s declining social capital. Simon & Schuster paperbacks.
- Ram, R. (2013). Social capital and income inequality in the United States. Atlantic Economic Journal, 41(1), 89–91. https://doi.org/https://doi.org/10.1007/s11293-012-9342-2
- Robison, L. J., Siles, M. E., & Jin, S. (2011). Social capital and the distribution of household income in the United States: 1980, 1990, and 2000. Journal of Socio-Economics, 40(5), 538–547. https://doi.org/https://doi.org/10.1016/j.socec.2011.04.004
- Royuela, V., Veneri, P., & Ramos, R. (2019). The short-run relationship between inequality and growth: Evidence from OECD regions during the Great Recession. Regional Studies, 53(4), 574–513. https://doi.org/https://doi.org/10.1080/00343404.2018.1476752
- Saucedo Acosta, E. J., Díaz Pedroza, J., & Molina, R. (2016). Varieties of capitalism and income inequality in OECD countries: Recent trends. Revista Cubana de Ciencias Económicas-EKOTEMAS, 2(2), 1–79.
- Schneider, B. R. (2009). Hierarchical Market Economies and Varieties of Capitalism in Latin America. Journal of Latin American Studies, 41(3), 553–575. https://doi.org/https://doi.org/10.1017/S0022216X09990186
- Schneider, B. R. (2013). Hierarchical capitalism in Latin America: Business, labour, and the challenges of equitable development. Cambridge University. https://doi.org/https://doi.org/10.1017/CBO9781107300446
- Schneider, B. R., & Karcher, S. (2010). Complementarities and continuities in the political economy of labour markets in Latin America. Socio-Economic Review, 8(4), 623–651. https://doi.org/http://dx.doi.org/10.1093/ser/mwq022Oxford
- Solt, F. (2016). The standardized world income inequality database. Social Science Quarterly, 97(5), 1267–1281. https://fsolt.org/papers/solt2016_pre.pdf
- Steijn, S., Lancee, B. (2011). Does income inequality negatively affect general trust? Gini, growing inequalities impacts (pp. 1–40). https://core.ac.uk/download/pdf/6273040.pdf
- The World Bank. (2004). Making services work for poor people. The World Bank, and Oxford University Press. https://openknowledge.worldbank.org/bitstream/handle/10986/5986/WDR2004 - English.pdf
- Ukhova, D. (2015). Gender inequality and inter-household economic inequality in emerging economies: Exploring the relationship. Gender and Development, 23(2), 241–529. https://doi.org/https://doi.org/10.1080/13552074.2015.1055082
- Uslaner, E. M., & Brown, M. (2005). Inequality, trust, and civic engagement. American Politics Research, 33(6), 868–894. https://doi.org/https://doi.org/10.1177/1532673X04271903
- Vinod, H. D. (2019). New exogeneity test and casual paths. In H. D. Vinod & C. R. Rao (Eds.), Handbook of statistics 41 (pp. 33–63). Elsevier.
- Visser, J. (2016). Data base version 5.1. Amsterdam Institute for Advanced Labour Studies (AIAS). Retrieved December 25, 2017, from http://uva-aias.net/en/ictwss
- Wilkinson, R., & Pickett, K. (2009). Desigualdad. Un análisis de la (in) felicidad colectiva. Turner Publications.
- Wooldridge, J. M. (2013). Introductory econometrics: A modern approach (5th ed.). Cengage Learning.
- World Development Indicators. (2018a). Database. https://data.worldbank.org/indicator/SL.EMP.SELF.ZS
- World Development Indicators. (2018b). Database. https://data.worldbank.org/indicator/cm.mkt.lcap.gd.zs
- World Development Indicators. (2018c). Database. https://data.worldbank.org/indicator/sl.tlf.totl.fe.zs
- World Development Indicators. (2018d). Database. https://data.worldbank.org/indicator/ny.gdp.pcap.kd.zg
- World Development Indicators. (2018e). Database. https://data.worldbank.org/indicator/NY.GDP.PCAP.KD
- World Development Indicators. (2018f). Database. https://data.worldbank.org/indicator/ne.gdi.totl.zs
- World Development Indicators. (2018g). Database. https://data.worldbank.org/indicator/SH.XPD.CHEX.GD.ZS
- World Values Survey. (2018). Database. http://www.worldvaluessurvey.org/wvs.jsp
- Wright, M. (2015). Economic inequality and the social capital gap in the United States across time and space. Political Studies, 63(3), 642–662. https://doi.org/https://doi.org/10.1111/1467-9248.12113