
Abstract
Western Balkan (WB) economies are lagging behind more advanced post-transitional countries in terms of economic development and the quality of the institutional framework and public services. As a response to the rigidity in the business environment and high taxation, private entrepreneurs shift part of their activities into the unofficial sector. We aim to estimate the volume of the unofficial economy (UE) in seven WB economies: Slovenia, Croatia, Bosnia and Herzegovina, Serbia, Montenegro, Kosovo and North Macedonia. In providing reliable estimates of the range of the UE, we applied two different methods: multiple indicators, multiple causes (MIMIC) and a direct survey of 21,000 individuals. The highest size of the UE, based on the average of both methods, is estimated for Montenegro. Slovenia, the most developed economy included in the sample, has the lowest share of the UE. The direct survey provides results on the propensity of different socioeconomic groups to engage in unofficial activities. The improvement of the institutional environment, quality of public services and lower tax burden are expected to be more effective than repression measures in the combat against the UE.
1. Introduction
European national account standards (Eurostat, Citation2013) require that official national accounts provide a comprehensive measure of the total economic activity performed in the territory of an economy during a period. Macroeconomic aggregates should include not only the regular income but also the income received but not reported to the tax or other administrative bodies. Estimates of the non-observed economy are not regularly incorporated in the official national accounts in some Western Balkan (WB) economies, and the official gross domestic product (GDP) is not fully comparable to EU members. The estimates of the unofficial economy (UE) are based on the Eurostat exhaustiveness of the national accounts approach in the WB. Previous estimates based on the Eurostat approach are available only for Slovenia and Croatia (Gyomai & van de Ven, Citation2014; Mikulić & Nagyszombaty, Citation2013). Improvements in the exhaustiveness of national accounts and harmonisation towards ESA 2010 standards are stated as one of the European Commission’s recommendations for WB economies striving to accede in the EU in the future (European Commission, Citation2019).
Besides the Eurostat approach, the method often applied for estimating the UE is the multiple indicators, multiple causes (MIMIC) method. Recent studies based on the MIMIC approach (Medina & Schneider, Citation2018) do not provide estimates for Serbia, Montenegro, North Macedonia and Kosovo because of the lack of comparable data. The size of the UE in the MIMIC method depends on benchmarking techniques, which are usually based on monetary data. Montenegro and Kosovo are not EU members, nor do they have a formal monetary agreement with the EU, but both countries unilaterally adopted the Euro as their de facto currency. In other WB economies, the inflow of foreign currency related to tourism receipts or remittances from abroad represents a significant share of cash in circulation (Scheiber, Citation2019). Monetary aggregates controlled by national monetary authorities form only a fraction of the total currency in circulation in WB economies, making the monetary or traditional MIMIC approach unsuitable for the UE estimate for WB countries.
This study aimed to estimate the size of the UE for the recent period in the following WB countries: Slovenia, Croatia, Bosnia and Herzegovina (B&H), Serbia, Montenegro, Kosovo and North Macedonia. The estimate of the UE in this study combines the forecasts of undeclared work (UDW) derived by a direct approach based on the representative survey conducted in the WB region and estimates based on the combination of the MIMIC and Eurostat approach. Instead of the benchmarking procedure based on the monetary system, we applied a hybrid method that combines relative indices derived from the MIMIC process and Eurostat estimates for new member states (NMS) to convert indices to absolute values. Additionally, a unique survey conducted on a representative sample of 21,000 respondents provides a more in-depth insight into the socioeconomic status of persons engaged in UDW. The survey is applied due to its ability to reveal detailed information on the structure of undeclared activities.
This article shows that the leading causes of the UE in the WB region are the same as found in previous studies (Medina & Schneider, Citation2018) and include a high tax burden, underdeveloped institutional framework and insufficient quality public services. The study hypothesises that the UE in the WB region is not to be considered primarily as a social buffer but as an answer to the heavy administrative burden in striving towards a higher living standard, especially for persons with higher education. Although those persons are receiving above-average income, their living standard is significantly below the standard of citizens with the same occupations and skills in more developed EU countries. While the answer to that issue in NMS with the free access to the EU labour market is emigration to more developed EU economies (Draženović et al., Citation2018), in other WB economies, a certain percentage of work is directed towards the UE.
The remainder of this article is divided into four sections. Alternative definitions of the UE and previous findings on the factors affecting trends in the UE are summarised in the second section. Section 3 describes the methods applied and data sources. The results on the estimated volume of the UE in WB economies are presented in Section 4, followed by conclusions, limitations and recommendations summarised in the last section.
2. Literature review
The size, methods of measurement and causes of the UE are broadly explored in the economic literature. Many alternative terms instead of the UE are used in previous studies: underground economy, non-observed economy, hidden economy, shadow economy, informal economy, black economy, UDW, and so on. Definitions of the UE rarely explain what UE is, but more often what ‘is absent, insufficient or missing concerning work in the shadow economy relative to work in the formal economy’ (Williams & Schneider, Citation2016, p. 2). The general definition describes the UE as income derived from productive activities, which are not covered in official statistics (Feige, Citation1990). It usually covers unregistered economic activities: the market-based production of goods and services, whether legal or illegal, that escape detection in the official GDP (Feige, Citation1989; Frey & Pommerehne, Citation1984; Schneider, Citation1994, Citation2003, Citation2005; Smith, Citation1994). A broader definition is taken from Dell’Anno (Citation2003, p. 4): ‘those economic activities and the income derived from them that circumvent or otherwise avoid government regulation, taxation or observation’. Some studies explicitly limit their legal research activities. Schneider and Buehn (Citation2016, p. 2) define: ‘all market-based legal production of goods and services deliberately concealed from public authorities’.
The common methodological framework for the compilation of national accounts presented by the ESA (Eurostat, Citation2013) and the OECD (Citation2002) use the term the non-observed economy when describing the lack of exhaustiveness in macroeconomic indicators. In the ESA 2010 (Eurostat, Citation2013, chapter 11.26), the non-observed economy is defined as the value of productive activities that are not directly observed but should be included within the national accounts. In the Eurostat approach, the total non-observed economy is divided into seven mutually exclusive categories, marked from N1 to N7 (Nadim, Citation2007), which are usually grouped into four main categories (Gyomai & van de Ven, Citation2014):
Illegal activities where the parties are willing partners in an economic transaction (marked as N2 in the Eurostat approach).
Underground activities where the transactions themselves are not illegal but are unreported to avoid official scrutiny; include N1 – underground producer and N6 – deliberate misreporting income.
Activities of the informal sector, where no business records are kept. These are typically non-monetary activities for the household benefit (N3 producers are not obliged to register), or small-scale market producers are not required to be registered (N4 and N5 depending on the legal status of the producer).
Statistical deficiencies: inadequate statistical data sources or inappropriate data processing (N7).
In the literature, numerous methods for estimating the underground economy have been developed. Methodological backgrounds, advantages and shortcomings of approaches have been discussed in detail previously (Schneider, Citation2011; Smith & Wied-Nebbeling, Citation1986). Recently, some methods are abandoned because of methodological weakness, and only three different approaches are used: direct survey, the MIMIC and the Eurostat approach.
According to the previous studies, countries from the WB region suffer from a significant share of the UE. It results from an inefficient institutional environment, the weak rule of law, high tax burden and the counterproductive fight against corruption.
The Eurostat–OECD GDP Exhaustiveness Project for WBC (Western Balkan Countries) was established in 2004, and preliminary results were described in Nadim (Citation2007). Estimates of the non-observed economy range from 7.6 for Slovenia to 17.2% of GVA (gross value added) for North Macedonia (). The most important type is the N6, which covers deliberate misreporting. Schneider and co-authors (Manes et al., Citation2016; Schneider & Enste, Citation2000; Schneider et al., Citation2010) points to the too-high share of unofficially economy in WB countries in the range between 26% and 36% of the GDP. Estimates for the period after 2013 are not available except for Croatia, Slovenia and B&H, wherein those of the UE in Kosovo are not available, and never use the MIMIC approach; which for the WB region results in two to sometimes four times higher than the Eurostat approach.
Table 1. Estimates of the UE in WB economies.
Estimates on the UE size based on the labour input approach are available for Croatia and Slovenia (Williams et al., Citation2017). UDW in the private corporate sector is estimated at 16.4% of the total GVA in Slovenia and 17.1% in Croatia. The comprehensive survey of previous results is available from Škrinjarić et al. (Citation2017) and Bejaković (Citation2015). Various forms of informal work in WB economies are questioned by a survey (Southeast European Leadership for Development and Integrity, Citation2016). It is estimated that the highest UE is expected for Kosovo, where 37.9% of employees do not have a written labour contract, followed by Serbia (35), Montenegro (28) and Macedonia (15). The lowest indicator is reported for Croatia and B&H (9% and 11%). Depending on the flexibility of the national labour legislation, some types of labour do not require a written contract between an employer and employee, which is not to be interpreted as a UE share in the GDP.
3. Methodology
The estimate of the UE in this study applies the following approaches:
Combination of the MIMIC and the Eurostat approach:
the MIMIC model was used for the set of NMS and WB economies to identify the causes of the UE and derive the relative size of the UE in different countries and
the Eurostat approach was used to convert relative indicators to the volume of the UE in each economy. Indices from MIMIC are transformed into the share of the UE by the benchmarking procedure based on the results of the Eurostat approach instead of the monetary approach estimates, which were most frequently used before (Medina & Schneider, Citation2018).
Estimates based on the direct survey on UDW conducted in the WB region.
3.1. Multiple indicators–multiple causes (MIMIC) approach
The MIMIC model examines the relationship between the latent variable (UE) and observable variables. Almenar et al. (Citation2019), Giles and Tedds (Citation2002) and Schneider and Enste (Citation2000) summarised the advantages of the MIMIC approach in modelling indicators and causal variables simultaneously. The method is flexible regarding the period and a group of countries included. The MIMIC model can be separated into two parts: the structural equation and the measurement equation system (Schneider & Buehn, Citation2016). The structural model estimates the relationships between the latent variable (UE) and various causes (xi in ) while the measurement model links estimates among indicators (yi) and the UE. Although the UE (η) is not directly observable, it can be estimated by relating causes and indicators. An exhaustive list of previous studies using the MIMIC approach is available in Medina and Schneider (Citation2018).
Figure 1. General structure of the MIMIC approach.
Source: Schneider and Enste (Citation2000).
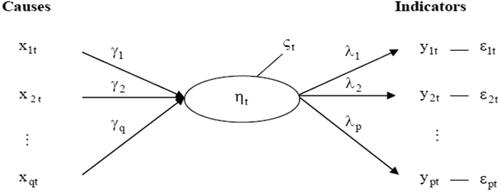
Determinants of the shadow economy (Feld & Schneider, Citation2010; Frey & Pommerehne, Citation1984; Schneider & Enste, Citation2000) are:
Tax burden;
Quality of public sector services;
Tax morality and government controls;
Labour market conditions;
Structural factors.
The tax burden is considered to be the most significant factor. Higher taxes provide potentially more net income for individuals and firms if taxes are evaded. The higher the difference between the gross and net income, the greater the incentive to work in the UE. The tax burden additionally affects labour and leisure preferences. Empirical evidence on the influence of the tax burden on the shadow economy is provided by Schneider (Citation2005), Johnson et al. (Citation1998) and Feld and Schneider (Citation2010).
The efficiency and quality of the government can explain the motivation of individuals to participate in the UE. If unsatisfied with the quality of public services or have a perception that public officials are corrupt, individuals will be more prone to engage in the UE. Countries with transparent legal systems and efficient regulations, a better rule of law and low corruption generally have lower UE (Friedman et al., Citation2000; Schneider & Buehn, Citation2016; Teobaldelli & Schneider, Citation2012). Tax compliance is driven by a psychological tax contract that entails rights and obligations both from the taxpayers and the government (Schneider & Buehn, Citation2016).
The main criticism of the MIMIC model is focused on its ability to provide results in relative terms only (Breusch, Citation2005). The main issue is selecting appropriate benchmark estimates for a particular country and economy derived from an alternative method. As a benchmark for the UE estimate, a currency demand approach estimates for Austria, Germany, Italy and the United States have been most frequently used (Bajada & Schneider, Citation2005; Dell’Anno & Schneider, Citation2006; Schneider & Enste, Citation2000). The exact benchmarking procedure is not fully explained, heavily criticised by other authors (Breusch, Citation2005; Feige, Citation2015).
A novelty of the method applied in this study is benchmarking relative estimates derived by the MIMIC model by results of the exhaustiveness of the national accounts approach available for new EU member states.
3.2. Eurostat approach based on the exhaustiveness of the national accounts
The Eurostat approach is more complicated than the methods used in the scientific literature. Different types of UE are estimated by statisticians, which select the most suitable way and the most exhaustive data sources for a particular UE type. Eurostat defined a standard set of procedures that can identify the lack of exhaustiveness of national accounts. Some kinds of UE are more related to the economic factors (N1 and N6), while obsolete registers and statistical deficiencies are factors behind other UE types. The Eurostat approach is explained in OECD (Citation2002), Nadim (Citation2007) and Mikulić and Nagyszombaty (Citation2013).
3.3. Direct survey on the experience with undeclared work
Alternatively, the UE estimate is based on the survey data collected in 2018 by field research conducted in WB countries. A stratified sampling procedure has been applied, with a geographical region, age and gender as control variables. The raw data collected were tested, and logical control has been performed. The data include responses of 21,000 adult respondents (3000 per country). The questionnaire was designed by an expert team engaged in the project ‘Illegal Trade of Tobacco Products: Smuggling as Experienced along the Balkan Route’. The survey had been concerned with smoking habits, but it included a set of questions on the respondents’ personal experience with UDW. Additional questions were based on the Eurobarometer survey carried out by TNS Opinion & Social network in the European Union’s 27 member states and Croatia in 2013. The European Commission (Citation2014) defined UDW as ‘paid activities that are lawful regarding their nature but not declared to public authorities’.
The question on the unofficial demand examined the existence of payments for goods or services when an individual had good reason to believe that a supplier was engaged in UDW. Respondents were asked to provide information on the type of goods or services paid and approximate expenditures.
Two questions examine the supply of the UDW:
Hidden income or regular employees: ‘Sometimes employers prefer to pay the entire or part of the regular salary, remuneration for extra work or overtime hours cash-in-hand and without declaring it to the tax or social security authorities. Did your employer pay all or part of your income in that way in the last 12 months?’
Hidden income from secondary employment: ‘Except for your regular job/activity, did you carry out any undeclared activities in the last 12 months for which you were paid in cash or in-kind’.
4. Results
4.1. Unofficial economy in the WB – a combination of MIMIC and Eurostat approaches
The MIMIC model is a type of structural equation modelling used in social sciences research and psychometrics. Its theoretical background is described in many previous studies. The primary purpose of the MIMIC model is to examine the influence of a set of exogenous causal variables, which is treated as a latent unobservable variable. The model confirms expectations on the relative size and trends in the UE:
If the government size (measured by tax burden or public expenditures) increases, the UE is expected to increase and vice versa.
An improved institutional framework reduces the UE; economies with a better institutional framework are expected to have a smaller UE.
Economic development reduces the UE: the UE of a smaller size is expected in more developed economies.
A better situation on the labour market reduces people’s willingness to work undeclared.
The parameters of the MIMIC model are estimated for the period of 2001–2017, and the model includes 19 NMS (13 countries joined the EU in 2004, 2007 and 2013) and WB economies. In various specifications, only one variable related to the quality of the institutional environment is included because of the high correlation among those variables. The parameter for the GDP per capita growth is set to −1 because of theoretical consideration on the antagonistic relation of the UE and the official growth rate. This approach is usually applied in the MIMIC model (Hassan & Schneider, Citation2016).
The estimated parameters and econometric properties of specifications are presented in . The results are compared with recent MIMIC research, which included 151 countries (Medina & Schneider, Citation2018). The statistical properties of the models estimated for NMS and WB economies indicate a less powerful model performance than the specification applied by Medina and Schneider (Citation2018). It can be partially explained by a limited sample of economies included and a shorter period. Model 1 ensures that each estimated parameter is significant at level p < 0.05, and it is selected as a base model for the UE estimation. Compared to the previous study (Medina & Schneider, Citation2018), the impact of the government size on the UE economy in WB economies is higher than the parameter estimated for a broader sample of 151 economies. The parameters estimated for the unemployment rate, the GDP per capita, and the quality of the institutional framework have the expected sign. They are per the results provided by Medina and Schneider (Citation2018).
Table 2. Parameters estimated by the MIMIC model for 19 NMS and WB economies.
Table 3. Non-observed economy based on the Eurostat approach.
Regarding the relation of trade openness and the size of the UE, the previous empirical results do not provide a unique relationship. International trade in goods generally decreases the probability of hidden transactions. However, most WB economies record a high share of exports of services (such as travel and tourism) where the UE could be significant. Moreover, it is not unusual that certain products (as cars in Croatia) are imported and resold by informal units that do not report the trade margin as a taxable income. In those cases, import growth, because of trade liberalisation, could indicate an increase in the UE. Recent results presented by Medina and Schneider (Citation2018) show different signs of the parameter for trade openness, depending on the specification of the model. The model, which includes all the countries, estimates a negative relation between trade openness and the UE. Conversely, a positive association is found in the model, including 26 developed economies only (Table 10 in Medina & Schneider, Citation2018).
The estimated parameters for causes of UE are used to estimate the relative UE size for each of the economies. The following step is the transformation of relative indicators into shares of the UE in the GDP. Instead of independent estimates based on the monetary approach, which are usually used in the MIMIC model, the UE estimates for NMS are based on the Eurostat approach. The non-observed economy (excluding illegal activities) in the five NMS for which data were available is estimated at 11.5% by national statistical offices using the Eurostat framework (). The underground economy, as the most critical component of the UE, forms almost two-thirds of the total non-observed economy.
The MIMIC results, expressed as the share of the UE in the GDP, are presented in and . On average, UE in the WB (measured as a share of the GDP) is expected to be almost 50% higher than NMS. The UE in WB countries decreased when compared to the beginning of the century. Improvements in the institutional framework, economic growth and better labour market performance contributed to the transition of hidden producers towards the official sector. In most of the economies, the UE decreased in the period between 2002 and 2009 when the global crisis reversed the trend. The intensity and duration of the economic recession were different in WB countries. Generally, the downturn phase of the economic cycle has been partially compensated by the growth in the hidden economy. While the economy in the most of WB countries returned to the growth path shortly after 2010, the Croatian economy had been stagnating until 2014, and growth in the hidden economy could be interpreted as the adjustment to the poor economic situation. In the recent period, WB economies have been improving their institutional framework in harmonisation with the EU legislation, which, together with stable economic prospects, result in decreasing the UE trend.
Figure 2. Estimate of the UE, excluding illegal activities, for WB economies, in the percentage of GDP.
Source: Authors’ calculations.
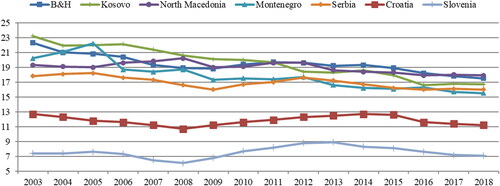
Table 4. Estimate of the UE in WB economies, a combination of the MIMIC and Eurostat approaches, excluding illegal activities, in percentage of GDP.
4.2. Survey results
Approximately, 1 in 10 respondents (9.5% of the total number of persons interviewed in all WB economies) declared purchasing products they had good reason to believe were linked to UDW ().
Figure 3. Distribution of answers on personal experiences with purchasing products delivered by the UDW sector.
Source: Survey data.
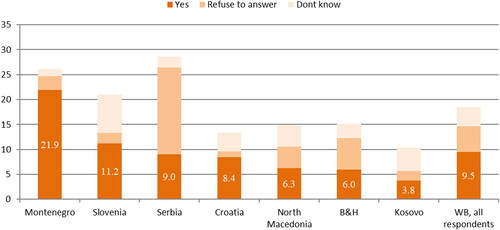
While 21.9% of respondents in Montenegro declared their personal experience with demand for UDW products, the same indicator for Kosovo is only 3.8%. The survey points to the following conclusions ():
Table 5. Persons declaring experience in purchasing products delivered by the UDW sector by socioeconomic groups, in percentage of the total number of respondents per country.
Men tend to purchase undeclared goods or services (10.2%) compared to women (8.8%).
The younger population is more likely to buy products delivered by UDW.
The purchasing of goods and services delivered by the UDW sector in the WBs is not considered a social buffer. Persons with higher education and above-average income expressed the most increased tendency in buying UDW products.
The market size is one of the most critical determinants for the development of the UE. Possibilities for purchasing services provided by UDW are more diversified in larger cities than in small rural communities.
When it comes to the structure of goods and services bought on the unofficial market, tobacco products are among the three most essential items in each of the seven WB economies. Except for tobacco, the most critical items delivered by the unofficial sector are household maintenance services, construction work, car repair and personal services, such as hair styling or cosmetics services. Food, cosmetics, clothes and shoes are essential only in a few economies.
The supply side of the UDW includes two categories:
Hidden income received by regular employees (the share of persons with positive answers are presented in )
Hidden income from undeclared secondary activity ()
Figure 4. Percentage of respondents receiving underreported income.
Source: Survey data.
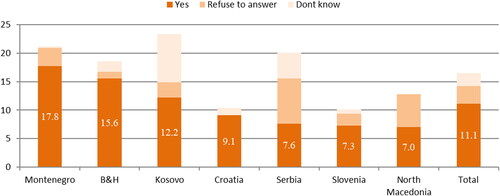
Figure 5. Percentage of respondents receiving compensation in money or a kind of undeclared secondary activity.
Source: Survey data.
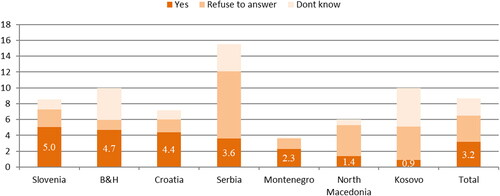
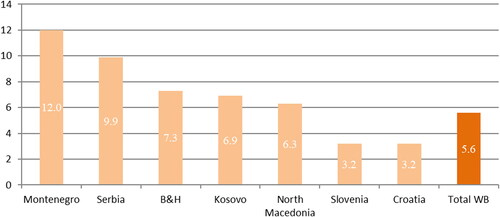
Figure 6. Total undeclared income estimated by the survey, in the percentage of GDP.
Source: Authors’ calculation based on the survey.
One out of 30 adults in the region declared performing UDW, either as secondary employment, in the case of regular employees, or as an unreported secondary job. The extent of UDW is the most intensive in Slovenia, B&H and Croatia, where 4%–5% of adult respondents declared performing secondary labour activities. A high percentage of individuals in Serbia, North Macedonia, B&H and Kosovo, who refused to answer the question or answered with ‘do not know’, could point to the possibility that a certain percentage of respondents had not been willing to provide an honest answer. A higher percentage of the male population, compared to the female population, perform UDW in Croatia, Slovenia, B&H and Montenegro. In Serbia, North Macedonia and Kosovo, the percentage of the female population is slightly higher, but the difference is not statistically relevant when the sampling error is included ().
Table 6. Persons declaring experience on undeclared secondary employment by socioeconomic groups, in percentage of the total number of respondents per country.
In most countries, there is a clear positive correlation between education and the tendency to perform UDW. It seems that educated persons, who can more easily find undeclared secondary employment, are more often engaged in the UE. Keeping in mind the labour market conditions and the low level of protection of labour rights in the WB region, persons with a lower education employed in trade, construction, restaurant services or other labour-intensive industries often work overtime for a regular wage. It is not likely that those persons have extra time or energy to engage in a secondary job position. Contrary to the previous studies which found that UDW is usually a social buffer. WB survey results indicate that, in most studied economies, persons with higher education receiving higher income are more likely to engage in UDW in the WB region.
Except for information on participation in the UDW supply and demand, the survey provided information on the amounts spent on UDW goods and services, percentage of labour income which regular employees earned without declaring it to tax authorities, and the amount of compensation received for undeclared secondary employment. In transforming relative indicators into total revenue generated by UDW, a set of official macroeconomic indicators was used: the total number of the adult population, the number of employees, the total amount of wages and salaries, income tax and contribution rates and the national accounts data.
The question of personal experience with UDW is related to the traditional concept of social (un)desirability. People could refuse to answer if they perceived that an honest answer could be socially unacceptable or undesirable (Tourangeau & Yan, Citation2007). Leeuw and Hox (Citation2008) suggest that missing data will be treated depending on their randomness. If a person refused to answer the question, it is more probable that this person would work in undeclared employment. The estimates on the actual share of participation in supply or demand for UDW are therefore based on the following assumptions:
two-thirds of respondents who refuse to answer are active in UDW (i.e., the probability that a person from the group of respondents who refuse to answer participated in UDW is 66.6%) and
one-third of persons who responded with ‘do not know’ are active in UDW (i.e., the probability that a person from the group of respondents who answered with ‘do not know’ participated in UDW is 33.3%).
The total income generated by UDW in the WB region is estimated at more than EUR 9 billion (6.7% of GVA or 5.6% of GDP, ). It is estimated that the highest share of UDW income in gross weight added can be found in Montenegro (14.5%) and Serbia (12.1%). On the other hand, Slovenia and Croatia, as the most developed WB economies, are estimated to have the lowest share of UDW, slightly under 3% of official GVA ().
Table 7. Total income generated by UDW, in EUR million.
4.3. Comparison of the results based on alternative methods
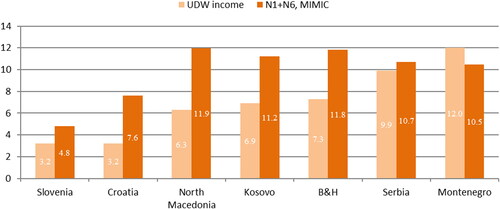
As estimates of the Eurostat approach used in benchmarking the MIMIC model includes not only the underground economy but also statistical deficiencies, a meaningful comparison should be based on the corrected MIMIC figures. According to the results of the Eurostat approach for NMS, it is assumed that the underground economy (N1 + N6) represents approximately 63% of the total UE as estimated by MIMIC ().
compares the UE estimates based on the survey and the MIMIC approach. In each of the WB economies, except Montenegro, survey results indicated a lower level of UDW income compared to the estimates based on the MIMIC model. It seems that respondents from Montenegro and Serbia are less reluctant to provide honest answers about their participation in hidden activities. The MIMIC model indicates that the size of the underground economy is almost double than the size of the underground economy estimated from the survey results for other WB economies.
Figure 7. Comparison of undeclared income based on survey results and underground economy (N1 + N6) estimated by the MIMIC approach, in the percentage of GDP.
Source: Authors’ calculations.
5. Conclusions
Although it may be difficult to quantify the volume of the UE in the WB region, the application of more than one method can help paint a more nuanced picture of the UE patterns. The analysis offered in this study is not designed to primarily rank countries by the UE volume, but rather to help understand the complex activities around the grey market in the region. Every country has specific conditions, and there are no ‘one-size-fits-all’ policy recommendations for curbing the UE.
Due to more massive taxation and the lower quality of institutions, the UE in the WBs is higher than NMS (Gyomai & van de Ven, Citation2014). The lowest volume of the UE is found for Slovenia and Croatia, the most developed WB economies. The ranking of the countries regarding the UE size does not differ significantly regardless of the method applied. Survey results depend on the willingness of respondents to reveal their participation in the UE and provide a lower limit for the EU estimate. The citizens of Montenegro and Serbia are less reluctant to offer an honest answer for participation in the unofficial sector in comparison to other WB residents.
The results of this survey provide evidence-based facts that reveal a more nuanced picture of the problem of the grey market. On average, 9.5% of the WB population is purchasing products delivered by the unofficial sector, while 11.1% of respondents are receiving undeclared income. In Montenegro and B&H, every sixth respondent declared participation in UDW. The survey found that purchasing goods and services delivered by the unofficial market in the WB is not considered to be a social buffer. It reveals that persons with higher education and above-average income expressed the most increased tendency to participate in the unofficial market. Educated persons in the WB can more easily find an undeclared secondary job than persons with lower education. It could be the result of the weak protection of labour rights in WB economies where persons with lower education in labour-intensive industries often work overtime for a regular wage. The process of joining the EU and free access to the EU labour market could result in the emigration of skilled workers towards more developed EU economies instead of working in the unofficial domestic sector.
The taxation policy is a key topic in all studies investigating the UE. This study does not provide a clear-cut answer about the effects of different tax mix scenarios. Still, one of the main conclusions of this study confirms previous findings on the vital role of the overall tax burden in explaining the UE size. Improvements in the regulative framework and effectiveness of the public sector and a lower tax burden are expected to be more effective than repression measures in the combat against the UE.
Future research is required to detect the effects of harmonisation of the national legislation towards EU requirements in the combat against the UE. Results should be interpreted, keeping in mind that each method has certain advantages and limitations. This complex phenomenon could be assessed from different angles if more than one method is applied. An in-depth discussion on the advantages and disadvantages of various methods could be found in many previous studies (Breusch, Citation2005; Medina & Schneider, Citation2018) and are summarised by .
Table 8. Main advantages and limitations of essential UE measurement methods.
Disclosure statement
No potential conflict of interest was reported by the author.
Additional information
Funding
References
- Almenar, V., Sánchez, J. L., & Sapena, J. (2019). Measuring the shadow economy and its drivers: The case of peripheral EMU countries. Economic Research - Ekonomska Istraživanja, 33(1), 2904–2918. https://doi.org/https://doi.org/10.1080/1331677X.2019.1706601
- Bajada, C., & Schneider, F. (2005). The shadow economies of the Asia-Pacific. Pacific Economic Review, 10(3), 379–401. https://doi.org/https://doi.org/10.1111/j.1468-0106.2005.00280.x
- Bejaković, P. (2015). A revision of the shadow economy in Croatia: Causes and effects. Economic Research - Ekonomska Istraživanja, 28(1), 422–440. https://doi.org/https://doi.org/10.1080/1331677X.2015.1059104
- Breusch, T. (2005). Estimating the underground economy using MIMIC models (Working Paper). Australian National University, pp. 1–36.
- Dell’Anno, R. (2003). Estimating the shadow economy in Italy: A structural equation approach (Economic Working Paper No. 2003-07). Department of Economics, The University of Aarhus.
- Dell’Anno, R., Schneider, F. (2006). Estimating the underground economy by using MIMIC models: A response to T. Breusch’s critique (Economics Working Paper No. 2006-07). Department of Economics, Johannes Kepler University.
- Draženović, I., Kunovac, M., & Pripužić, D. (2018). Dynamics and determinants of emigration: The case of Croatia and the experience of new EU member states. Public Sector Economics, 42(4), 415–447.
- European Commission. (2014). Special Eurobarometer 402: Undeclared work. Author.
- European Commission. (2019). Reforms in the Western Balkans and Turkey: Annual assessments and recommendations. Author. https://ec.europa.eu/commission/presscorner/api/files/document/print/en/ip_19_2752/IP_19_2752_EN.pdf
- Eurostat. (2013). European System of National and Regional Accounts: ESA 2010. ec.europa.eu
- Feige, E. L. (Ed.). (1989). The underground economies. Tax evasion and information distortion. Cambridge University Press.
- Feige, E. L. (1990). Defining and estimating underground and informal economies: The new institutional economics approach. World Development, 18(7), 989–1002.
- Feige, E. L. (2015). Reflections on the meaning and measurement of Unobserved Economies: What do we really know about the ‘Shadow Economy’? (MPRA Paper No. 68466). University Library of Munich.
- Feld, L. P., & Schneider, F. (2010). Survey on the shadow economy and undeclared earnings in OECD countries. German Economic Review, 11(2), 109–149. https://doi.org/http://dx.doi.org/10.1111/j.1468-0475.2010.00509.x https://doi.org/https://doi.org/10.1111/j.1468-0475.2009.00466.x
- Frey, B. S., & Pommerehne, W. W. (1984). The hidden economy: State and prospects for measurement. Review of Income and Wealth, 30(1), 1–23. https://doi.org/https://doi.org/10.1111/j.1475-4991.1984.tb00474.x
- Friedman, E., Johnson, S., Kaufmann, D., & Zoido-Lobaton, P. (2000). Dodging the grabbing hand: The determinants of unofficial activity in 69 countries. Journal of Public Economics, 76(3), 459–493. https://doi.org/https://doi.org/10.1016/S0047-2727(99)00093-6
- Giles, D., & Tedds, L. M. (2002). Taxes and the Canadian underground economy (Canadian Tax Paper No. 106). Canadian Tax Foundation.
- Gyomai, G., & van de Ven, P. (2014). The non‐observed economy in the system of national accounts (OECD Statistics Brief No. 18). https://www.oecd.org/std/na/Statistics%20Brief%2018.pdf
- Hassan, M., & Schneider, F. (2016). Size and development of the shadow economies of 157 worldwide countries: Updated and new measures from 1999 to 2013. Journal of Global Economics, 4(3), 1–14.
- Johnson, S., Kaufmann, D., & Zoido-Lobaton, P. (1998). Corruption. Public finances and the unofficial economy (Discussion Paper). World Bank.
- Leeuw, E. D., & Hox, J. (2008). Missing data. In Encyclopaedia of survey research methods. http://sage-ereference.com/survey/Article_n298.html
- Manes, E., Schneider, F., & Tchetchik, A. (2016). On the boundaries of the shadow economy: An empirical investigation (IZA Discussion Paper No. 10067). The Institute for the Study of Labour.
- Medina, L., & Schneider, F. (2018). Shadow economies around the world: What did we learn over the past 20 years? (IMF Working Paper No. 18/17). International Monetary Fund. https://doi.org/https://doi.org/10.5089/9781484338636.001[]
- Mikulić, D., & Nagyszombaty, A. G. (2013). Causes of the unofficial economy in new EU member states. Economic Research-Ekonomska Istraživanja, 26(Sup1), 29–44. https://doi.org/https://doi.org/10.1080/1331677X.2013.11517638 https://doi.org/https://doi.org/10.1080/1331677X.2013.11517638
- Nadim, A. (2007). Measuring the non-observed economy in WB countries: Practical lessons for transition economies [Paper presentation]. In Experiences and challenges in measuring national income and wealth in transition economies. International conference organized by the International Association for Research in Income and Wealth (IARIW) and the National Bureau of Statistics (NBS) of China, Beijing, China, September 18–21.
- Organisation for Economic Co-Operation and Development (OECD). (2002). Measuring the non-observed economy. OECD, International Monetary Fund (IMF), and the International Labour Organisation (ILO). https://www.oecd.org/std/na/1963116.pdf
- Scheiber, T. (2019). The use of euro cash in CESEE and the role of euro adoption expectations (Focus on European Economic Integration Q3/19). Austrian Central Bank, pp. 76–94.
- Schneider, F. (1994). Measuring the size and development of the shadow economy. Can the causes be found and the obstacles be overcome? In H. Brandstaetter & W. Güth (Eds.), Essays on economic psychology (pp. 193–212). Springer.
- Schneider, F. (2003). Veličina i razvoj sive ekonomije i radne snage u sivoj ekonomiji u 22 tranzicijske zemlje i 21 zemlji OECD-a: Što doista znamo? Financijska Teorija i Praksa, 27(1), 1–29.
- Schneider, F. (2005). Shadow economies around the world: What do we really know? European Journal of Political Economy, 21(3), 598–642. https://doi.org/https://doi.org/10.1016/j.ejpoleco.2004.10.002
- Schneider, F. (2011). Handbook on the shadow economy. Edward Elgar. https://doi.org/https://doi.org/10.4337/9780857930880.
- Schneider, F., & Buehn, A. (2016). Estimating the size of the shadow economy: Methods, problems and open questions (IZA Discussion Paper No. 9820). The Institute for the Study of Labour.
- Schneider, F., Buehn, A., & Montenegro, C. E. (2010). New estimates for the shadow economies all over the world. International Economic Journal, 24(4), 443–461. https://doi.org/https://doi.org/10.1080/10168737.2010.525974.
- Schneider, F., & Enste, D. (2000). Shadow economies: Size, causes and consequences. Journal of Economic Literature, 38(1), 77–114. https://doi.org/https://doi.org/10.1257/jel.38.1.77
- Smith, P. (1994). Assessing the size of the underground economy: The Canadian statistical perspectives. Canadian Economic Observer, 11, 16–33.
- Smith, S., & Wied-Nebbeling, S. (1986). The shadow economy in Britain and Germany. Anglo-German Foundation for the Study of Industrial Society.
- Southeast European Leadership for Development and Integrity. (2016). Hidden economy fact sheets 2016: SELDI.net. http://seldi.net/publications/publications/hidden-economy-fact-sheets-2016/
- Škrinjarić, B., Recher, V., & Budak, J. (2017). Consumption in the dark: Estimating unrecorded expenditures of households in Croatia. Croatian Economic Survey, 19(2), 135–167.
- Teobaldelli, D., & Schneider, F. (2012). Beyond the veil of ignorance: The influence of direct democracy on the shadow economy (Discussion Paper No. 2012/4). Department of Economics, The University of Linz.
- Tourangeau, R., & Yan, T. (2007). Sensitive questions in surveys. Psychological Bulletin, 133(5), 859–883. https://doi.org/https://doi.org/10.1037/0033-2909.133.5.859
- Williams, C. C., Bejaković, P., Mikulić, D., Franić, J., Kedir, A., & Horodnic, I. A. (2017). An evaluation of the scale of undeclared work in the European Union and its structural determinants: Estimates using the labour input method. European Commission Directorate-General for Employment, Social Affairs and Inclusion.
- Williams, C., & Schneider, F. (2016). Measuring the global shadow economy: The prevalence of informal work and labour. Edward Elgar.