
 ?Mathematical formulae have been encoded as MathML and are displayed in this HTML version using MathJax in order to improve their display. Uncheck the box to turn MathJax off. This feature requires Javascript. Click on a formula to zoom.
Abstract
This paper investigates the multiscale bidirectional volatility spillover effect between the national stocks and exchange rate markets in four African countries – Nigeria, South Africa, Egypt and Morocco. Our computations involve the wavelet transformation of the empirical series, creation of the regime-dependant conditional volatilities via MS-GARCH model and measurement of the volatility spillover effect in the quantile regression framework. We find an evidence of the bidirectional volatility spillover effect, but the volatility impact from exchange rate market to stock market is stronger in all the African countries, except Nigeria. Regarding the direction from stocks to exchange rate, we report that volatility spillover effect is the strongest in South Africa, because Johannesburg stock exchange is the most developed and liquid market. As for the reverse direction, the spillover effect is recorded in longer time-horizons in the Egyptian and Moroccan cases, which indicates to flow-oriented model, while for South Africa, the effect is found in shorter time-horizons, which is in line with the portfolio-balance theory. In South Africa, investors should protect themselves against exchange rate risk in shorter time-horizons, in Morocco and Egypt in longer time-horizons, while in Nigeria, hedging against exchange rate is not needed.
1. Introduction
The connection between the world’s financial markets have strongly grown in the recent years due to increased international trade, foreign direct investments and the capital inflows from global portfolio investors, whereby the emerging and developing African economies are no exception in these global trends (see e.g. Babecky et al., Citation2013; Cevik et al., Citation2016; David & Grobler, Citation2020; Sare et al., Citation2019). Borojo and Yushi (Citation2020) contended that owing to the introduction of numerous economic measures and reforms in the last decades, African countries have opened and harmonized financial markets, whereby the capitalization of the 10 largest African financial markets tripled from 2002 to 2008. Boako et al. (Citation2016) asserted that net private capital flows to Sub-Saharan African countries doubled between 2010 and 2012 in comparison with the period 2000–2007, whereas the portfolio and cross-border bank flows into Sub-Saharan African markets exceeded the US$17 billion in 2012. They asserted that dominant beneficiaries were Nigeria, Zambia and Ghana in 2013. Bonga-Bonga and Hoveni (Citation2013) investigated South Africa and they claimed that equity market in this emerging economy increased annually by 15% between 2000 and 2010.
Our motivation to do this research lies in the fact that consistent and intense capital inflows entered Africa in the last two decades (see e.g. Asamoah et al., Citation2016; Hassan et al., Citation2003). Due to these occurrences, an important question can be put to the test, that is, whether a bidirectional volatility transmission effect between stock and exchange rate markets exist in Africa, and if so, what is the magnitude. This question is important since the appearance of volatility in the exchange rate market may cause various effects across the real economy and financial markets (see Tule et al., Citation2018). The transmission of volatility is also known as the ‘meteor shower’ effect according to the typology of Engle et al. (Citation1990), and this hypothesis suggests intraday volatility spillover from one market to another. Monfared and Enke (Citation2014) asserted that this subject of research is also essential for international investors because it leads to a better understanding of risk spillovers between the two markets, possible hedging strategies and pricing of financial instruments. Golosnoy et al. (Citation2015) added that equally important for international investors is to know whether volatility spillover effects are more pronounced during periods of very high volatility, which is associated with financial crises.
Therefore, the goal of this study is to thoroughly analyse whether and in which extent the volatility spillover effect exists between the two markets in the four emerging African countries – Nigeria, South Africa, Egypt and Morocco. The reason why we carry out this study is the fact that large number of foreign investors participate in stock markets in order to make profit in the largest African countries, and in that process, they are exposed to exchange rate risk. On the other hand, exporters of these countries are also vulnerable to exchange rate changes that happen due to capital inflows in these countries. Therefore, this paper tries to provide an answer whether and in which magnitude volatility shocks are transmitted between the markets, and whether or not some type of hedging activities is needed for both stock investors and exporters. We do not include Algeria in the sample, although Algerian economy is forth in the African continent, because Algerian stock market is very illiquid, which means that changes in this index are very small, almost non-existent. Due to this fact, conducting an analysis in these data would be erroneous and misleading. All other countries in the sample are considered because they are among the largest in Africa, and they all pursue a flexible exchange rate regime (see and ).
Figure 1. Empirical dynamics of the selected stocks and exchange rates. Note: Black lines denote stock indices, while red lines present exchange rate dynamics. Source: Authors’ calculation.
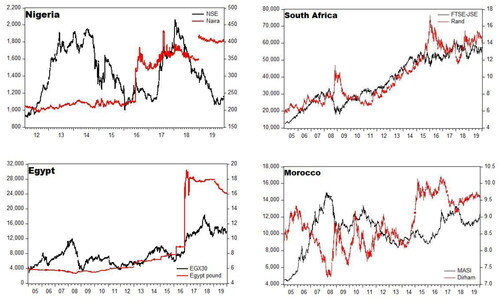
Table 1. Nominal GDP of the selected economies and their size rank in the African continent.
However, it should be said that most of the previous studies in this topic are limited in scope, since they analyse the nexus between the markets only from a temporal point of view. Taking into account only time-domain is by all accounts insufficient, because observation of different time-horizons can reveal which theory better explains the nexus between stocks and exchange rate – the ‘flow-oriented’ model or ‘portfolio-balance’ approach. The flow-oriented model finds the linkage via the international trade balance. It assumes that exchange rate depreciation affects positively (negatively) competitiveness of domestic (foreign) goods, which transfers to cash flows of domestic companies, especially those export-oriented, pushing their stock prices up. This indirect linkage occurs in longer time-period, and it supports positive correlation between these two assets. On the other hand, portfolio-balance approach proposes the linkage via capital-financial balance and the demand (supply) of financial assets. The rationale behind this theoretical tenet lies in the fact that higher demand for domestic stocks could cause higher needs for domestic currency, which eventually leads to its appreciation. Conversely, if exchange rate appreciates/depreciates for whatever reason, it would increase/decrease demand for domestic stocks and a rise/fall in their value. Therefore, the portfolio-balance model is in a position that negative correlation exists between these two variables. Due to fast information transfer between the markets, the linkage between stocks and exchange rate, according to this theory, realizes in short-term horizon. Since we investigate volatility spillover effect between the two markets, we hypothesise that rising volatility in one market causes higher volatility in the other market, that is, the volatility movements are positively correlated.
Conlon and Cotter (Citation2012) explained why relatively limited number of papers considered different time-horizons. They asserted that the sample reduction problem arises when researchers try to match the frequency of data with the different time-horizons. Therefore, this paper endeavours to circumvent this issue by working with the wavelet signal-decomposing series, which preserve information contained in the empirical time-series, but at the same time, they allow researchers to observe different time-horizons. Many papers used the wavelet methodology in recent years in order to analyse various economic phenomena in different time-horizons (see e.g. Lee & Lee, Citation2016; Madaleno & Pinho, Citation2012; Njegić et al., 2017 ; Tsai & Chang, Citation2018; Živkov, Kuzman, et al., Citation2019; Živkov, Pećanac, et al., Citation2019).
In addition, since we investigate the volatility spillover effect between the markets, we especially address the way in which the dynamic volatility of the two markets is measured. In order to generate conditional volatilities, most of the papers used some form of symmetric or asymmetric GARCH models. However, the problem may arise if the volatility process is subject to structural breaks. In this case, the sum of estimated GARCH coefficients is close to or even exceeds one, as Klaassen (Citation2002) explained, which implies estimation of a non-stationary volatility in a single-regime GARCH models. Frommel (Citation2010) asserted that this leads to the overestimation of volatility persistence and misspecification of the GARCH model. One solution of this problem is to insert dummy variables in the GARCH process, which recognize structural shifts in volatility level. However, if it is hard to accurately determine the exact break dates exogenously, then this approach comes down to an arbitrary choice of dummy variables, which yields a wrong estimation of dynamic volatility. In order to avoid biasedness in the estimation of volatility time-series, we apply a Markov switching GARCH (MS-GARCH) model, which recognizes the structural breaks endogenously. This particular model couples traditional GARCH model with the Markov switching process, and for our computation purposes, we utilize MS-GARCH of Gray (Citation1996). Therefore, our procedure firstly involves the wavelet transformation process of the empirical time-series, whereas in the second step we estimate Markov switching model for every examined asset, and then subsequently derive conditional Markov switching volatilities from the MS-GARCH model. In this way, we can obtain accurate estimates of the dynamic conditional volatilities, taking into account different time-horizons as well.
In the final step, we embed the created Markov switching volatilities in the quantile regression (QR) framework in order to explore the bidirectional ‘meteor shower’ effect between the selected African assets across the quantiles. Since we work with the conditional volatilities, and not returns, our quantile estimates can measure the states of low volatility, moderate volatility and high volatility. Combining wavelet-based Markov switching volatilities with the QR approach, we can gain a holistic insight about the magnitude of the ‘meteor shower’ effect across the different market conditions and in different time-horizons. Many researchers find very appealing quantile regression for their studies (see e.g. He et al., Citation2020; Maestri, Citation2013; Vilerts, Citation2018).
As a complementary analysis, we use wavelet coherence approach, which can tell us how strong volatility nexus between two markets is. This information is provided in both time and frequency domains. The results of this methodology will serve well as a robustness check for the estimated wavelet-based quantile parameters.
To the best of our knowledge, this paper departs from the existing literature along several dimensions. First, unlike the most of the studies which put the emphasis on the first moment cross-market spillover effect, this paper investigates volatility spillover phenomenon. Second, we investigate several emerging African countries, which were given a little attention in the economic literature thus far, and this opens an opportunity for our contribution. Third, the main advantage of this study, comparing to other related papers, is the fact that we perform an extensive analysis of the bidirectional volatility spillover effect, combining several different and sophisticated methodologies – wavelet transformation, MS-GARCH model and quantile regression.
Besides instruction, the rest of the paper is structured as follows. Section 2 provides literature review. Section 3 explains used methodologies. Section 4 presents dataset and the way in which conditional volatilities are created. Section 5 contains empirical results of the bidirectional volatility spillover effect, estimated via wavelet-based quantile parameters. Section 6 presents wavelet coherence results. Section 7 explains policy implications based on the results, while the last section concludes.
2. Literature review and related studies
Generally speaking, volatility spillover effect is a common phenomenon in financial and commodity markets. One of the early papers on this topic did Koutmos and Booth (Citation1995), and they investigated the transmission mechanism of price and volatility spillovers across the New York, Tokyo and London stock markets in the context of EGARCH Model. They reported significant volatility spillovers from New York to London and Tokyo, from London to New York and Tokyo and from Tokyo to London and New York. Vo and Tran (Citation2020) analysed volatility spillovers from the US equity market to stock markets of ASEAN economies. They employed the augmented EGARCH model with the ICSS algorithm, in order to control the excessive volatility breaks over an extended period. They reported a significant volatility spillover from the US to ASEAN equity markets. The paper of Yip et al. (Citation2020) researched dynamic implied volatility spillover effect from oil to agricultural markets in the period after the global financial crisis 2008–2009. They used the generalized spillover indices within a fractionally integrated VAR model to capture the dynamic patterns of the volatility spillover effects alongside the Markov Switching Autoregressive model to extract the regimes of oil. Their findings revealed that the net volatility spillover effect from crude oil to all agricultural commodities tends to decrease when crude oil remains in its low volatility regime. On the other hand, this effect experiences an increasing trend when crude oil remains in its relatively high volatility regime.
As for the papers that researched volatility transmission between stock and exchange rate markets, one of the earliest studies on this topic did Kanas (Citation2000). He researched volatility spillover between stock returns and exchange rate changes in six developed countries. He reported the existence of volatility spillover effect from stock returns to exchange rate changes in all countries except Germany, while spillover effect from exchange rate changes to stock returns is insignificant for all the countries. Apergis and Rezitis (Citation2001) used GARCH methodology to investigate cross-market volatility spillover effects between stocks and exchange rate markets across New York and London. Their empirical results indicated the presence of volatility spillover effects from the foreign exchange market in London and New York to the equity market in New York and London, respectively. They contended that possible explanation for these findings could lay in the fact that exchange rate news may reflect the macroeconomic news, such as trade balance, real interest rate and the level of inflation. On the other hand, they could not find volatility spillover impact from the equity markets to the foreign exchange markets across New York and London. Yang and Doong (Citation2004) researched mean and volatility transmission mechanism between stock and foreign exchange markets in the G-7 countries. They reported the asymmetric volatility spillover effect and showed that movements in stock prices affects future exchange rate movements, but changes in exchange rates have less direct impact on future changes of stock prices. The paper of Fu et al. (Citation2011) analysed volatility transmission between the Japanese stock and foreign exchange markets, using BEKK-GARCH model. They reported that news shocks in the Japanese currency market account for volatility transmission in eight out of ten industrial sectors in Japan. Andrikopoulos et al. (Citation2014) explored the volatility transmission mechanism between stock and currency markets for Eurozone economies, such as Greece, Italy, Ireland, Portugal and Spain. They found a bidirectional, asymmetric volatility spillover effect between currency and stock markets in these countries. Živkov et al. (Citation2015) researched the bidirectional second moment spillover effect between stock returns and exchange rate changes in four Eastern European emerging markets, using several symmetric/asymmetric FIGARCH models and assuming presence of multiple structural breaks. They found that volatility spillover effect has much higher impact from the currency market toward stock market than vice-versa. Leung et al. (Citation2017) studied volatility spillover between the equity markets and exchange rate in the US, Great Britain and Japan for the period of 2001–2013. They found significant positive volatility spillover from exchange rates to equity markets, except for the Japanese case. They argued that irrational investors’ behaviour could lead to financial panics in crises, while the volatility spillover increases during that time in excess of macroeconomic fundamentals.
There is relatively limited research on the volatility spillover effects between the exchange rate and stock markets as Sikhosana and Aye (Citation2018) contended, while only a few studies consider the volatility spillover effect in African countries. For instance, Adjasi et al. (Citation2008) investigated the effect of the exchange rate volatility on stock market volatility in Ghana. They found negative relation between exchange rate and stock price volatilities, which means that high exchange rate volatility leads to a decrease in stock market volatility. Bonga-Bonga and Hoveni (Citation2013) investigated the extent of volatility spillovers between the equity market and the foreign exchange market in South Africa, by using asymmetric EGARCH model. Their findings suggested a unidirectional relationship in terms of volatility spillovers from the equity market to the foreign exchange market, and they concluded that the extent of foreign participation in the South African equity market possibly contributes to these results. Sikhosana and Aye (Citation2018) also considered the South African case, whereby they analysed the asymmetric volatility spillover effect between South African real exchange rate and stock returns in monthly data via several GARCH models. They found a bidirectional volatility spillover effect between the two markets in the short-run, emphasizing that negative shocks in the exchange rate market have a greater influence on volatility in the stock market, whereas positive shocks in the stock market have a greater impact in transmitting volatility to the exchange rate market. Tule et al. (Citation2018) researched volatility spillovers between stock market returns and the exchange rate in Nigeria, using multivariate VARMA-AGARCH model. They reported a stronger unidirectional transmission effect from the stock market to the foreign exchange market in the model without breakpoints. However, when they inserted breakpoints in the model, they found a bidirectional spillover pattern across both markets.
2.1. Methodological approaches of this paper vs methodologies used in prior studies
Looking at the methodologies used in prior studies that is presented in the previous section, it can be seen that all of them consider volatility spillover effects only from a temporal point of view. We enrich the analysis by adding frequency domain as well. In particular, by using wavelet decomposed series, we can gain a wider picture about what is the extent of volatility transmission between the markets, not only in different time-periods, but also in different time-horizons. This approach is useful because it can effectively suggest whether portfolio-balance approach or flow-oriented model have an upper hand in explaining the nexus between the markets. In addition, consideration of different time-perspectives is very useful for investors who operate in different time-horizons, because the obtained results can suggest to them whether some hedging strategies are necessary or not.
Regarding the construction of conditional volatilities, we employ MS-GARCH model, which is novelty comparing to the existing studies. This particular model can measure conditional volatilities more accurately than other univariate GARCH type models, because it considers structural breaks in the variance. It is well known in the literature that neglecting this issue could yield biased measures of conditional variance.
At the end, quantile regression is used to gauge the bidirectional volatility spillover effect in different market conditions, which is very useful for our research because we cover relatively long time-period, permeated with significant ups and downs in both markets. This type of results can give a valuable information for investors to define their investment strategies in calm and turbulent periods in the largest countries in Africa.
3. Methodologies
3.1. Wavelet signal-decomposing methodology
First step of our three-step procedure involves transformation of empirical time-series in the several wavelet time-frequency components. According to Dewandaru et al. (Citation2014) wavelets are capable of ensuring an appropriate trade-off between resolution in the time and frequency domains, unlike traditional Fourier analysis, which only emphasize the frequency domain. Wavelet theory discerns two basic wavelet functions: the father wavelet (ϕ) and the mother wavelet (ψ), where father wavelets augment the representation of the smooth or low frequency parts of a signal with an integral equal to 1, whereas the mother wavelets can describe the details of high frequency components with an integral equal to 0. In other words, father wavelet delineates the long-term trend over the scale of the time series, while the mother wavelet describes fluctuations in the trend. The functions of father wavelet and mother wavelet
are generated in the following way:
(1)
(1)
Symbol j is typically referred to as 'level', while the scale or dilation factor is whereas the translation or location parameter is
As much as j grows, so does the scale factor
which is a measure of the width of the functions
and
and it affects the underlying functions to get shorter and more dilated. Also, when j increases, the translation steps automatically get larger in order to accommodate the level of scale parameter
As for our analysis, we apply the maximum overlap discrete wavelet transformation (MODWT) algorithm, which is based on a highly redundant non-orthogonal transformation. Therefore, the signal-decomposing procedure in MODWTFootnote1 are given in the following way:
(2)
(2)
(3)
(3)
where symbols
and
stand for the fluctuation and scaling coefficients, respectively, at the
level wavelet that reconstructs the signal in terms of a specific frequency (trending and fluctuation components). Consequently, an empirical time series
can be expressed in terms of those signals as:
(4)
(4)
3.2. Markov switching GARCH model
In order to avoid biased measurement of the conditional volatilities of the selected stocks and exchange rates, we employ the Markov switching GARCHFootnote2 model in the second step of our three-step procedure. In other words, for all the selected assets, we estimate the MS-GARCH model with the wavelet decomposed series and subsequently obtain regime switching conditional volatilities from the model. The MS-GARCH model can be very appealing, since it can recognize structural breaks in variance endogenously, avoiding in such way its overestimation. We assume an AR(1) process for the conditional mean of all examined assets, where residuals of the model follow the normal distribution
Abounoori et al. (Citation2016) asserted that regime switching models can switch some or all parameters of the model according to the Markov process, which is governed by a state variable (). The state variable (
) evolves according to a first-order Markov chain, with transition probability, and we assume two possible states – low volatility (state 1) and high volatility (state 2). The dynamics of this process are given by the transition matrix P, and
is the probability of switching from state 1 to state 2. Conditional on an information set
is the probability that unobserved state variable
is in regime 1. These probabilities are grouped together into the transition matrix according to the following expression:
(5)
(5)
If the regimes are stable, switching probabilities should be relatively high. We set the conditional variance to follow a GARCH(1,1) process according to the following equation:
(6)
(6)
where
is a state dependent constant, whereas
and
are ARCH and GARCH effects under regime
The non-negativity of
is ensured if we set following restrictions:
and
Volatility persistence in state
is measured by
However, it should be said that the GARCH model in a regime switching context with state-dependent past conditional variances would be unfeasible. This is the case because conditional variance depends not only on the observable information set and on the current regime
but also on all past states
Thus, this process requires the integration over a number of unobserved regimes paths, which grows exponentially with the sample size. The model in that form is essentially impossible to estimate. This model-shortcoming was recognized by both Cai (Citation1994) and Hamilton and Susmel (Citation1994), who independently introduced Markov switching GARCH model. Therefore, in order to circumvent this issue, we use the Markov switching GARCH model of Gray (Citation1996) who proposed an integration of the unobserved regime path
in GARCH term, by using the conditional expectation of the past variance.
To estimate the model, we use the maximum likelihood methodology, and according to Caglayan et al. (Citation2016) it looks like as follows:
(7)
(7)
3.3. Quantile regression approach
In the final step, we combine wavelet-based regime switching conditional volatilities in a quantile regression framework, in order to assess the bidirectional volatility spillover effect between the two markets of the selected African countries. We opt for the quantile regressionFootnote3 approach of Koenker and Bassett (Citation1978), because this methodology can unravel complex dependence structure between the underlying assets, under the conditions when normality conjecture is severely violated and when data contain numerous outliers (see Dybczak & Galuščak, Citation2013; Koenker, Citation2005). In other words, the QR approach does not have a restrictive assumption that the error terms are identically distributed at all points of the conditional distribution. This means that no parametric distributional form (e.g. Normal, Student, GED, Poisson, etc.) needs to be assumed due to a semiparametric nature of the quantile regression method (see e.g. Delgado et al., Citation2018; Živkov et al., Citation2014).
In a two-asset QR framework, where y is linearly dependent on x, then conditional quantile function of y is given in the following way:
(8)
(8)
where b denotes an element of the conditional distribution function of y given x.
denotes the conditional distribution function of y given x, while parameter
for
defines the dependence relationship between vector x and the
conditional quantile of y.
represents
vector, which contains constant and independent variable.
This research strives to examine bidirectional spillover effect between the regime-switching volatilities of the two financial markets, regarding quantile of the dependent variable distribution, where y can be either stock volatility or exchange rate volatility. The same applies for the independent series x.
The coefficients β(τ) for a given τ are estimated by minimizing the following objective function, that is, the average of asymmetrically weighted absolute errors with weight φ on positive errors and weigh (1 - φ) on negative errors:
(9)
(9)
EquationEquation (9)(9)
(9) implies the minimization of the sum of asymmetrically weighted absolute error terms, where positive and negative residuals are weighted differently depending on the quantile chosen. According to Lin and Lin (Citation2013), expression
denotes the sum of absolute value of the positive error, while
represents the sum of absolute value of the negative error. It should mention that the estimator for β does not have an explicit form, which imply that the resulting minimization problem can be solved by the linear programming algorithm.
3.4. Wavelet coherence methodology
In order to further strengthen our overall findings, we use the wavelet coherence methodology,Footnote4 which can indicate the strength of the local linear correlation between two volatility time series at each scale. Torrence and Webster (Citation1999) explained that wavelet coherence can be presented as a squared absolute value of the smoothed cross wavelet spectra normalized by the product of the smoothed individual wavelet power spectra of each selected time series. The cross wavelet transform of two time-series, x(t) and y(t), is defined as where
and
are the wavelet transforms of two time-series, x and y, respectively. Symbol u represents a position index, s denotes the scale, while the symbol * indicates to a complex conjugate. The squared wavelet coherence coefficient is given as follows:
(10)
(10)
where
stands for a smoothing operator and s is a wavelet scale. The squared wavelet coherence coefficient ranges
whereby values near zero point to weak correlation, while values near one indicate to strong correlation.
4. Dataset and construction of the conditional volatilities
This paper analyses the daily closing prices of the stock indices and corresponding national currencies in the four African countries – Nigeria (NSE and naira), South Africa (FTSE-JSE and rand), Egypt (EGX30 and pound), Morocco (MASI and dirham). All indices and exchange rates are transformed into the log returns according to the expression: where
stands for the closing price of the particular asset. For South Africa, Egypt and Morocco, the samples range from January 2005 to December 2019, whereas for Nigeria the sample starts from January 2012 due to unavailability of the NSE data. All time-series are retrieved from the investing.com website. We try to cover relatively long time-period, starting from 2005, in order to include a turbulent period of global financial crisis, which had a profound effect on financial markets around the globe. All corresponding pairs of assets are synchronized according to the existing observations. Since we investigate the extent of the volatility transmission in different time-horizons, we work with five scales of wavelet decomposed time-series, where these scales correspond to: scale 1 (2–4 days), scale 2 (4–8 days), scale 3 (8–16 days), scale 4 (16–32 days) and scale 5 (32–64 days). First three scales are treated as short-term horizon, while fourth and fifth scales match to midterm and long-term, respectively.
We assume that all daily time-series are subject to structural breaks, because we consider relatively long time-span, which is permeated with numerous ups and downs (see ). This nuisance could cause biased conditional volatilities in the GARCH process. Therefore, we utilize the MS-GARCH model, which successfully deals with this issue. contains values of probabilities of daily time-series that suggest what is the likelihood of staying in regime of low volatility (P11) and high volatility (P22). clearly shows that two regimes exist in the empirical time-series, whereas all indices and all currencies, except naira, are dominantly characterized by the low volatility regime. The presence of two regimes justifies the use of the MS-GARCH model in the process of conditional volatilities computation.
Table 2. Regime switching probabilities of the selected indices and currencies.
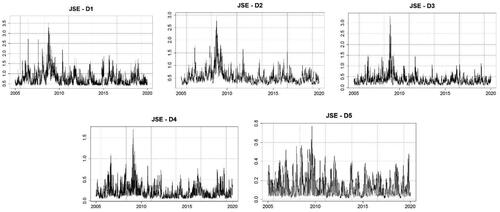
Since we find two regimes in the daily time-series, it is reasonable to assume that two regimes also exist in wavelet decomposed time-series. Therefore, we repeat the MS-GARCH estimation procedure with every wavelet time-series. Due to parsimony, shows only wavelet-based regime switching volatilities of South African FTSE-JSE index, while all other plots can be obtained by request.
Figure 2. Wavelet-based regime switching conditional volatilities of FTSE-JSE index. Source: Authors’ calculation.
contains descriptive statistics of daily-based regime-switching conditional volatilities, which includes first four moments. Jarque-Bera test of normality is not calculated, because it is clear that none of the conditional volatilities follow Gaussian distribution (see ). Since we work with the volatilities, it is expected that all conditional volatilities are heavily skewed to the right, which corroborates in the cases of all indices as well as all currencies, except for Nigerian naira. This means that the empirical distribution of the volatilities is strongly concentrated around the left quantile, which implies that the majority of observations oscillates around low volatility. This assertion is verified by distribution plots of all regime-switching volatilities in .
Figure 3. Distribution histograms of the Markov-switching conditional volatilities. Source: Authors’ calculation.
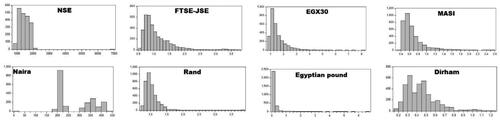
Table 3. Descriptive statistics of the daily-based regime-switching conditional volatilities.
In order to perceive stylized facts of descriptive statistics of wavelet-based regime-switching conditional volatilities, we present these findings in only for South African FTSE-JSE index. Distributional characteristics for all other assets are very similar with FTSE-JSE index, thus they are not presented, in a sake of brevity. As can be seen, with the rise of wavelet scales, mean decreases as well as standard deviations. All wavelet-based FTSE-JSE time series are skewed heavily to the right, while all kurtosis coefficients heavily exceed the reference value of the normal distribution (equal to 3), which suggests the presence of extreme values and outliers. Therefore, the wavelet-based quantile approach is a convenient choice for our research, owing to the following reasons. Firstly, the wavelet method successfully tackles extreme movements and numerous outliers in empirical signals (see e.g. Nikkinen et al., Citation2011). Secondly, the quantile regression estimators are robust to deviations from normality and it performs very well in extreme value environment, since QR provides information about the average dependence as well as the extreme tail dependence.
Table 4. Descriptive statistics of the daily-based regime-switching conditional volatilities.
5. Research results and discussion
This section presents the results of the bidirectional spillover effect between the markets in four countries of Africa. Combining wavelet transformation and QR approach, we can learn according to which theory volatilities spill over between the markets. In particular, if results indicate that volatility spillover effect is stronger from exchange rate market towards stock market, and this happens in longer time-horizons, than it could be assumed that flow-oriented model better explains the nexus between the markets. On the other hand, if results suggest that transmission effect is stronger from stocks to exchange rate markets, and that occurs in shorter time-period, than portfolio-balance theory has an upper hand in explaining the nexus. It is also possible that statistically significant spillover effect exist in both directions. In that case, both theories explain the nexus between the markets to some extent, and then the question is from which direction stronger spillover effect occurs. The direction that is dominant, gives an advantage to a particular theory.
5.1. The volatility spillover effect from stock market to exchange rate market
This subsection presents the results of the multiscale ‘meteor shower’ effect that goes from stock to exchange rate markets in the selected African countries, and contains these results. It is obvious that estimated QR parameters are heterogeneous across quantiles and wavelet scales, which justifies the usage of wavelet-based QR approach. It is also evident that the ‘meteor shower’ effect grows stronger when QR parameters are observed from left to right quantiles, and this particularly applies for the Nigerian, Moroccan and South African cases in . This is expected, since left quantile parameters denote lower volatility in the markets, while right quantiles portray higher volatility. In other words, in increased volatility conditions of the recipient market, the spillover effect is stronger and vice-versa.
Table 5. Multiscale volatility spillover effect from stocks to exchange rate.
reports that the ‘meteor shower’ effect from the stocks to the exchange rate in the Nigerian case does not exist when volatility in the exchange rate market is very low, which is portrayed by the first and second quantiles. It can be seen that the highest quantile parameters are found at second wavelet scale, which signals to delay effect. When volatility is very high in the Nigerian exchange rate market, then we find the highest spillover effect in the short time-horizon (4–8 days) in 0.8 and 0.95 quantiles, amounting 0.179 and 0.233, respectively. These relatively high quantile parameters in short time-horizons are most likely associated with 30% depreciation of naira in June 2016 against the US dollar (see ), which happened after Nigerian central bank removed its currency peg in an effort to alleviate the chronic foreign currency shortages that had severe negative effect on the Nigerian growth. In addition, in relatively long time-horizon (D4 scale) at high quantiles ( and
) we also find relatively high quantile parameters in magnitude of 0.281 and 0.240. This probably means that volatility shocks from Nigerian stock markets lasted in prolong amount of time when Nigerian exchange rate market was under severe turbulence. We can assert that this stressful time in the Nigerian exchange rate market is connected with the naira depreciation in 2016, and due to this reason Nigerian exchange rate market felt volatility shocks from Nigerian stock market in the extended time period (16–32 days). The same pattern can be spotted in the case of Egypt, which also devaluated its currency in 2016. In other words, in the case of Egypt, we also find relatively high quantile parameters in D4 and D5 scales in high quantile
On the other hand, in the cases of South Africa and Morocco, the countries that did not have severe and abrupt depreciations of their currencies, we find higher quantile parameters in shorter time-horizons (D1 and D2 scales).
Observing the South African case, it can be seen that right-tail quantile parameters ( and
) are significantly higher, comparing to the cases of Egypt and Morocco. Also, we find that the highest QR parameter is recorded in the second scale (D2), in amount of 79.2% at the right-tail quantile (
). This means that in short time-horizon (4–8 days), Johannesburg stock exchange has relatively strong impact on volatility of rand, in the cases when South African exchange rate market experiences the highest volatility. With the flow of time, this effect decreases, since D3, D4 and D5
quantile parameters amount 55.4%, 53.1% and 18.9%, respectively. The results reported in for South Africa are consistent with the findings of Bonga-Bonga and Hoveni (Citation2013) who also found significant volatility spillover effect from stock to exchange rate market in South Africa. They claimed that equity markets in emerging market, in general, greatly depend to foreign participation. Therefore, if high extent of volatility occurs in these equity markets then rapid sale of stocks probably follows. This is the case because foreign investors relocate their funds to more stable global markets, which consequently implies a massive capital outflow that automatically spills over to volatility in the foreign exchange market.
In the case of Egypt, the results indicate that the volatility spillover effect from the EGX30 index to Egyptian pound is almost non-existent, except for the highest quantile parameters (), and this is recorded only in midterm and long-term. It means that volatility from the Egyptian stock market is transmitted to the Egyptian exchange rate market only in the rare cases when the exchange rate market is under severe volatility stress. As have been said, these
quantile parameters are probably linked with Egyptian pound devaluation in 2016 by 48% (see ), which was done by Egyptian monetary authorities in an effort to meet a key demand of the International Monetary Fund in order to secure a $12 billion loan over three years to overhaul Egyptian ailing economy. However, even in these extreme instances, the volatility spillover effect is relatively modest, meaning that 100% volatility increase in the stock market induces 19.6% and 25.8% volatility increase in the Egyptian exchange rate market in midterm and long-term, respectively. In all other cases, estimated quantile parameters are either statistically insignificant or go around zero.
In the Moroccan case, the estimated quantile parameters are somewhat higher, comparing to the Egyptian case, but little-bit lower in comparison with the Nigerian quantile estimates. More precisely, we find that QR parameters, up to quantile, are very low, below 10%, whereas in increased volatility conditions in the Moroccan exchange rate market, these parameters are not particularly high and amount below 30%. In moderate volatility conditions, which is portrayed by the median quantile, most wavelet-based quantile parameters are below 5%. Also, it can be seen that estimated QR parameters are relatively equable across the wavelet scales, which means that this effect does not change significantly when different time-horizons are observed.
Taking into account different volatility states, which are depicted by quantiles from to
it can be noted that QR parameters are higher in the South African case than in the cases of three other countries, in all quantiles. The rationale behind these findings probably lies in the fact that Johannesburg stock exchange is more developed and bigger market than Lagos, Cairo and Casablanca stock exchanges in terms of both market capitalization and trading volumes (see ). Due to these reasons, Johannesburg stock exchange is more liquid market, but also more prone to significant capital inflows and outflows, which can leave an impact on rand’s volatility. This argument also explains why we do not find a significant spillover effect in Nigeria, Egypt and Morocco. In other words, low trading volumes, i.e. low capital inflows (outflows) in these markets, probably do not make enough incentives for capital mobility that could initiate changes in the national exchange rate markets. Therefore, very low or almost non-existent volatility transmission effects are recorded from stocks to exchange rate market in these three countries.
Table 6. Market capitalization and trading volumes for the three stock markets.
Since we find relatively significant volatility spillover effect from stocks to exchange rate market in lower as well as in higher quantiles in South Africa, and also because this effect is the strongest in short-term horizon (4–8 days), all these findings suggest that the portfolio-balance theory can explain the interconnection between stocks and exchange rate markets in South Africa. On the other hand, we fail to find significant volatility transmissions from stock to exchange rate market in Nigeria, Egypt and Morocco, which indicates that the nexus between these markets cannot be explained undoubtedly by the portfolio-balance theory in these economies.
5.2. The volatility spillover effect from exchange rate market to stock market
Results of the reverse volatility spillover effect, from exchange rate to stocks, is presented in . Similar to the results in , the majority of quantile parameters in are highly statistically significant, but also heterogeneous across the wavelet scales and quantiles. Comparing and , it seems that the ‘meteor shower’ effect is stronger and more consistent when volatility shocks spill over from exchange rate to stocks, than other way around. This assertion applies for all the African countries, except Nigeria. Apergis and Rezitis (Citation2001) also found similar phenomenon investigating developed countries. They tried to explain this finding by the fact that exchange rate volatility carries various set of news related to different macroeconomic regularities, such as trade news, real interest rate news and expected inflation news. These fundamentals affect stock markets in different ways, and thus when foreign exchange market become more volatile, then stock markets also become more uncertain, in terms of higher conditional volatility.
Table 7. Multiscale volatility spillover effect from exchange rate to stocks.
The Nigerian case is a unique one, since it is the only case in which we find stronger spillover effect from the stock market to the exchange rate market than vice-versa. We find that exchange rate volatility impacts stock market volatility, but at very low rate, even when the stock market is in the high volatility mode. Our results coincide very well with the paper of Adi (Citation2017), who also investigated the Nigerian case and found evidence of the bidirectional volatility transmission. He claimed that exchange rate market responds more to volatility transmission than stock market. In addition, the paper of Tule et al. (Citation2018) analysed the transmission mechanism of volatility between the Nigerian stock market and foreign exchange market, and reported the presence of long-term unidirectional spillovers from the stock market to the foreign exchange market. They argued that naira experiences stronger impact from stock markets due to the openness of the capital account, where the frequent oscillations of the Nigerian stock market are associated with inflows and outflows of portfolio capital with the far-reaching consequences on the naira exchange rate.
In the case of Egypt, almost all Egyptian quantile parameters are highly statistically significant in , which was not the case when we observed volatility transmission from the EGX30 index to the Egyptian pound. Also, these parameters are relatively high in the magnitude across the scales and quantiles, which clearly suggests that volatility from the Egyptian exchange rate market transfers to the Egyptian stock market at relatively high rate. It can be noted that the volatility effect grows larger as wavelet scales increase, and in fourth wavelet scale (16–32 days), this effect reaches its peak. In particular, we find that Egyptian pound has the strongest effect in quantile, with the parameter size of 0.521%. This means that 100% increase in volatility in Egyptian exchange rate market affects the EGX30 index by 52.1%, and this happens in conditions when Egyptian stock market is relatively turbulent. On the other hand, in low volatility regime (
) in midterm horizon, this effect goes around 15%, while in moderate market conditions (median quantile), the effect is around 20%. Since we find that exchange rate has significant influence on stocks in Egypt, this gives us a basis to believe that flow-oriented model can explain the nexus between stocks and exchange rate in Egypt. This assertion is further strengthened by the fact that the strongest effect is found in longer time-horizon, which is also an intrinsic characteristic of this theory.
In the Moroccan case, the estimated quantile parameters are higher in , comparing to findings in , which indicates that exchange rate volatility has more power on stock market, than vice-versa. As in the Egyptian case, we also find that volatility spillover effect grows larger with the flow of time, whereby the strongest effect is recorded in quantile in midterm horizon (D4 wavelet scale). This parameter is 1.005, whereas lower wavelet parameters as well as lower quantile parameters are smaller than this one. This indicates that dirham has stronger impact on MASI in high volatility conditions in Moroccan stock market and in longer time horizons, which supports flow-oriented model. Atenga and Mougoue (Citation2020) gave an opinion why significant exchange rate changes may have an impact on Moroccan economy. They claimed that a sudden change in exchange rate can cause a reduction on tourist arrivals, which causes rapid increase of uncertainty in Morocco.
Comparing and for Egypt and Morocco, the results speak in favour that the flow-oriented model has an advantage vis-à-vis the portfolio-balance approach in these two countries, which means that the nexus between stocks and exchange rate is probably shaped by the international trade. Speaking differently, if exchange rate depreciates, it stimulates export, which eventually boosts stock prices, while appreciation has a reverse effect. According to the flow-oriented theory, these causalities do not happen immediately, but with some flow of time. presents export/GDP ratio of the selected countries, and it can be seen that Egyptian weight of export in GDP is lower, comparing to the Moroccan counterpart. This is consistent with the estimated quantile parameters, since we find that exchange rate volatilities affect more intense the volatilities of MASI index than volatilities of the EGX30 index. In other words, Morocco is more export-oriented country than Egypt, thus Moroccan companies are more dependent on favourable exchange rate, and consequently more susceptible to dirham oscillations. As for Nigeria, shows that Nigeria has the lowest export to GDP ratio, which could indicate that exchange rate fluctuations of naira has relatively modest effect on NSE index, according to the flow-oriented theory. Indeed, confirms these assumptions, since naira has almost negligible effect on the NSE index.
Table 8. Weight of export in GDP of the selected countries in 2018.
The South African case is very similar to the previous cases of Egypt and Morocco, but we also report some differences. We find that the spillover effect is stronger from exchange rate to stocks than reverse, which coincides with recent paper of Sikhosana and Aye (Citation2018). This indicates that flow-oriented model also explains the nexus between the assets in South Africa, which is expected, since the export to GDP ratio amounts 30% in South Africa, according to . Probably due to the same reason, we find that exchange rate volatility has the strongest effect on corresponding stock market in South Africa, taking into account all four countries. In particular, we find that the highest quantile parameter is at third wavelet scale. This means that 100% increase in volatility in South African exchange rate market affect stock market volatility with 135% in very volatile conditions in Johannesburg stock market.
However, we need to clarify some findings between South Africa and the other two African countries (Egypt and Morocco), in which we find relatively high effect from exchange rate to stocks. As can be seen in , the highest spillover effect in South Africa is found in shorter time-horizon (8–16 days), which is third wavelet scale, while for Egypt and Morocco, it is time-horizon between 16 and 32 days. It is well known that exchange rate changes can have significant repercussions on revenues of portfolio investors, in a sense that if exchange rate depreciates it lowers investment incomes expressed in some solid currency, such as USD or EUR. Therefore, due to the fact that South African stock market is the most developed one, with the highest volumes of trading activities and capital flows, every depreciation of rand reflects negatively on the value of investors’ revenues in Johannesburg stock exchange. Since information transfer is very fast between the markets, this effect comes to the fore in high speed. Thus, it can be asserted that rand oscillations affect both stock that serve as investment asset and stocks of export-oriented companies. However, it can be argued that the effect on stocks as investment instruments is stronger, because we find relatively high quantile parameters even in very short time-horizons (2–4 days) and short time-horizons (4–8 and 8–16 days). This gives an advantage to portfolio-balance theory in South Africa. On the other hand, this explanation cannot be applied firmly on the Moroccan and particularly Egyptian cases, because stock markets of these countries are very illiquid in comparison with the Johannesburg stock market (see ). Consequently, quantile parameters in lower wavelet scales in the Moroccan case are notably smaller, comparing to the South African counterparts, while Egyptian QR parameters are either very low or statistically insignificant.
6. Complementary analysis via wavelet coherence
In order to put more credibility in our overall results, we compute wavelet coherence between stocks and exchange rate volatilities, and this section presents the findings. In doing these calculations, we referred to the paper of Živkov, Manić, et al. (Citation2019), who researched volatility transmission between Baltic stock indices, using wavelet coherence method. This approach can indicate visually what is the strength of the nexus between two time series in both time and frequency domains. In our case, it is helpful because it can be used as a robustness check for the previously calculated wavelet-based quantile parameters. shows wavelet coherence plots, where horizontal axis in all wavelet coherence plots presents the observed time-period. Left vertical axis denotes wavelet decomposed time-horizons, which goes up to sixth scale (64 days). The strength of the co-movement between each of the selected assets can be viewed via colour surfaces, whereby blue and green colours indicate low coherence, while wormer colours suggest higher coherence. The colour pallet is depicted at right Y-axis and it ranges between 0 and 1.
Figure 4. Wavelet coherence plots for the four African countries. Source: Authors’ calculation.
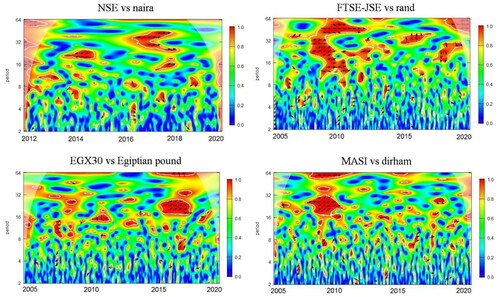
As can be seen, blue and green colours prevail across entire surface in all wavelet coherence plots, which suggests that low level of correlation exists between two volatilities throughout the period and wavelet scales. These results coincide very well with the estimated wavelet-based quantiles, which also signal that relatively low spillover effect exist between volatilities when both directions of risk transmission are observed. This means that risk transmission between the markets exists, but at very low level. In other words, these findings do not raise a concern in most of the time for investors who operates in stock markets in these countries, because low level of risk transmission from exchange rate market does not require an implementation of exchange rate hedging strategies. Although exchange rates of the selected countries are relatively volatile, we do not find significant risk transmission from exchange rate to stock markets in Nigeria, Egypt and Morocco, which is corroborated by wavelet-based quantiles and wavelet coherence results. A viable explanation probably lies in the fact that the selected stock markets are relatively illiquid (except for Johannesburg stock exchange), which means that exchange rate risk, no matter how high it is, cannot come to the fore in the stock markets.
The exceptions are very dark red islands in wavelet coherence plots, which indicates very high correlation between the two risks. It can be seen that dark red surfaces for South Africa and Morocco are recorded around 2009–2010, that is, in time of global financial crisis, whereas for Nigeria and Egypt, dark red islands are found around 2016, which is the period when naira and Egyptian pound abruptly and significantly devaluated. Also, it can be noticed that dark red spot in the case of South Africa is significantly bigger, comparing to the Moroccan counterpart. This indicates that high correlation between the two risks was more profound and it lasted longer in South Africa than in the case of Morocco during global financial crisis. We already ascertain that South Africa has the most developed and liquid financial markets of all African countries, and due to this reason, volatility shocks transfer between the markets relatively easily, while global financial crisis made the risk transmission between two markets even more intense.
In addition, it should be said that almost all phase difference arrows within dark red areas are pointed to right, which indicate to positive correlation between the risks. In other words, rising volatility in one market increases volatility in other market. This is expected and this finding confirms our initial hypothesis set at the beginning of the paper.
7. Policy implications
This section gives some recommendations about monetary policy that should be implemented regarding the spillover results given in the previous sections. This policy can be viewed from the aspect of whether or not exchange rate oscillations need to be moderated by monetary authorities. On the other hand, free movements of capital are a necessary precondition for development of every country, and free flow of capital is not in question in modern world, so monetary authorities should not (cannot) impose capital controls in cases when capital inflows and outflows have significant effect on exchange rate.
According to the results, we do not find strong volatility spillover effect from naira to Nigerian stocks, which indicates that Nigerian export is not affected by exchange rate oscillations. This finding is good for Nigerian economy, given that Nigerian export is dominantly based on crude petroleum and petroleum gas, which exceeds 90%. This is the case because oil market is very volatile by itself, thus Nigerian authorities do not need to worry additionally about possible volatility shocks that might come from exchange rate market. In addition, naira is not affected strongly by capital movements from Nigerian stock market, so Nigerian central bank do not need to implement any measures in stabilisation of exchange rate market, regarding volatility shocks from Nigerian stock market.
On the other hand, in the cases of Morocco and Egypt, our wavelet-based quantile parameters indicate that exchange rate volatility shocks affect stocks in these countries in longer time-horizons, which is in line with flow-oriented model. Our results show that Morocco is affected by volatility shocks from exchange rate market more strongly than Egypt, and this is particularly the case in higher quantiles. Moroccan export is more diversified that the Nigerian, which means that wide range of companies can be affected by exchange rate volatility shocks. In that regard, Moroccan monetary authorities should put a greater interest to alleviate high exchange rate oscillations in relatively rare periods when Moroccan stock market is under stress (95th quantile). In all other conditions, this type of policy is not needed, because the spillover effect is not particularly high, whereas companies can protect themselves optionally by taking long position in exchange rate futures market. Also, the results indicate that capital movement do not impact dirham strongly, even at the highest quantile, so Moroccan monetary authorities do not need to worry how capital volatility shocks will affect Moroccan exchange rate.
Egypt, like Morocco, has relatively diversified export, but volatility shocks from Egyptian pound do not hit hard Egyptian stocks as in the case of Morocco, while time-frequency correlations between pound and EGX30 are relatively week. Therefore, we can assert that some anti-volatility exchange rate policy is not particularly required in the case of Egypt. Like in the case of Morocco, volatility shocks from Egyptian stock market has no significant impact on Egyptian exchange rate market in all quantiles, hence Egyptian central bank do not need to intervene in order to mitigate these shocks.
As for the South African case, we determined that significant volatility spillover effect exists between their stock and exchange rate markets in turbulent periods of both markets. As a matter of fact, South Africa has the highest volatility spillover of all the countries, and the reason lies in the fact that both markets are very liquid, and that contributes to high volatility spillover effect between them. Also, relatively high volatility spillover effect is present in short term, but also in midterm, which means that portfolio-balance, as well as flow-oriented theory, shape the relations between the markets in South Africa. South African export is relatively diversified, but more than 30% of that goes to gold, platinum and diamonds, and these commodities have relatively volatile prices, highly dependent on global demand, which implies higher risk for exporters of these commodities. Due to this reason, South African monetary authorities need to diminish exchange rate oscillations in turbulent times in order to help their exporters in lowering an overall risk. In addition, since rand is affected by volatility shocks from South African stock market in high or very high quantiles, this means that South African central bank needs to intervene in the exchange rate market in order to prevent intense exchange rate changes. This activity will lower investors’ concern in South African stock market, regarding possible loss that they might encounter due to rapid and unanticipated exchange rate changes. Comparing all countries in the sample, it seems that the volume of exchange rate interventions in South Africa could be the highest one, due to the presence of relatively high volatility spillover effect between the markets.
8. Conclusion
Stocks and exchange rate markets are naturally linked via various conduits, such as trade flows and capital movements, thus this paper tries to assess the extent of the bidirectional multiscale volatility transmission effect between these two markets, considering the four emerging African countries – Nigeria, Egypt, Morocco and South Africa. Our three-step computation procedure involves the scale-dependant transformation of empirical series via MODWT algorithm, creation of unbiased regime-dependant conditional volatilities via MS-GARCH model and gauging the ‘meteor shower’ effect in the quantile regression framework. As a complementary analysis, we use wavelet coherence methodology.
Our results indicate the presence of the bidirectional ‘meteor shower’ effect, but at relatively modest rate. However, the estimated QR parameters suggest that the volatility impact is stronger from exchange rate market to stock market, than vice-versa in all the African countries, except Nigeria. Regarding the direction from stocks to exchange rate, we report that volatility spillover effect is significantly stronger in South Africa than in Nigeria, Egypt and Morocco. We suspect that this happens because Johannesburg stock exchange is more developed and bigger market, with higher trading volumes that other stock exchanges. Therefore, Johannesburg stock exchange is more prone to significant capital inflows and outflows, which can leave an impact on rand’s volatility. Since we find relatively significant volatility spillover effect from stocks to exchange rate market in short-term horizon (4–8 days) in South Africa, this indicates that the portfolio-balance theory can explain the interconnection between stocks and exchange rate markets in this country. On the other hand, this conclusion cannot be applied straightforward to Nigeria, Egypt and Morocco, because we fail to find economically significant volatility transmissions from stock to exchange rate market in most quantiles and wavelet scales.
As for the reverse direction, i.e. exchange rate→stocks, we find relatively high and statistically significant quantile parameters in all countries, except Nigeria. In the Egyptian and Moroccan cases, the strongest spillover effect is recorded in longer time-horizons, which indicates that flow-oriented model has an upper hand vis-à-vis portfolio balance approach in these two countries. This signals that the interlink between stocks and exchange rate in these two countries is probably moulded by the international trade, and our quantile parameters are well in line with export to GDP ratio of these two countries. In the South African case, we also find stronger volatility transmission from exchange rate to stocks, than other way around, which might indicate that flow-oriented model better explains the nexus, comparing to the portfolio-balance approach. However, we also find high quantile parameters in shorter time-horizons, which is not consistent with the flow-oriented model. The explanation for such findings probably lies in a fact that every unanticipated fluctuations of rand reflects on the value of investors revenues in Johannesburg stock exchange. Since South African stock exchange is very liquid market, with rapid information transfer between the two markets, this indicates that volatility transmission from exchange rate to stock market comes to the fore in high speed, which supports the portfolio-balance approach. Therefore, we find evidence that both theories – the flow-oriented model and portfolio-balance approach can explain the nexus from exchange rate to stocks, but the latter has a precedence in South Africa. Nigeria has the lowest export to GDP ratio, which can suggest that exchange rate oscillations of naira has relatively modest effect on NSE index via trade balance, as flow-oriented theory would anticipate. The estimated wavelet-based quantile parameters are well in line with this assertion, because naira has almost negligible effect on the NSE index across quantiles and wavelet scales.
The results of this paper could have practical implications for international investors who participate in African financial markets to better understand the nature of the volatility transmission, regarding different length of investment-horizons as well as different market conditions. We find that volatility spillover effect is stronger from exchange rate market to stocks market than vice-versa, but these results are important to consider only in very volatile market conditions (upper quantiles) for South Africa and Morocco, and to some extent for Egypt. As have been said, for South Africa, the effect also occurs in short-run, which coincides with the portfolio-balance theory, whereas for Morocco and Egypt, stocks are affected in longer-run, which is in line with the flow-oriented tenet. Therefore, the results could be useful for portfolio managers and stock market investors to devise proper hedging strategies against the exchange rate risk, depending on the country in which they operate. In particular, market participants can protect themselves from the exchange rate risk simply by taking a long position in currency futures or forward markets. In South Africa, investors should protect themselves in shorter time-horizons, in Morocco and Egypt in longer time-horizons, while in Nigeria, the protection against exchange rate is not needed because naira has almost non-existent effect on the NSE index. In addition, companies from these countries, which have intense import and export activities, could be interested in the results, since the exchange rate fluctuations affect both costs and revenues. And finally, policy makers of the countries may find these results beneficial in regard of formulating appropriate exchange rate policy, taking into account how stock market volatiles influence the corresponding exchange rate market. The activities from policy-makers can contribute to a faster restoration of the financial stability in a country.
This paper is the first one that comprehensively and thoroughly investigates volatility transmission between the two markets in African countries in time-frequency context. Future studies can employ different methodological approaches in order to confirm (refute) our findings or they can broad the scope of investigation and consider different African countries that have relatively long and usable empirical time-series. Also, some papers can consider the ‘meteor shower’ effect from global financial markets to stock and exchange rate markets of African countries.
Disclosure statement
No potential conflict of interest was reported by the author(s).
Notes
1 MODWT transformation was done via ‘waveslim’ package in ‘R’ software.
2 MS-GARCH model was estimated via ‘MSGARCH’ package in ‘R’ software.
3 Quantile regression was estimated via Eviews 10 software.
4 All wavelet coherence calculations were done via ‘R’ software, using ‘WaveletComp’ package.
References
- Abounoori, E., Elmi, Z., & Nademi, Y. (2016). Forecasting Tehran stock exchange volatility; Markov switching GARCH approach. Physica A: Statistical Mechanics and Its Applications, 445, 264–282. doi: https://doi.org/10.1016/j.physa.2015.10.024
- Adi, A. A. (2017). Returns effect, shocks and volatility transmission between foreign exchange-stock markets in Nigeria. Academic Journal of Economic Studies, 3(1), 29–38.
- Adjasi, C., Harvey, S. K., & Agyapong, D. (2008). Effect of exchange rate volatility on the Ghana stock exchange. African Journal of Accounting, Economics, Finance and Banking Research, 3(3), 29–47.
- Andrikopoulos, A., Samitas, A., & Kougepsakis, K. (2014). Volatility transmission across currencies and stock markets: GIIPS in crisis. Applied Financial Economics, 24(19), 1261–1283. doi: https://doi.org/10.1080/09603107.2014.925054
- Apergis, N., & Rezitis, A. (2001). Asymmetric cross-market volatility spillovers: Evidence from daily data on equity and foreign exchange markets. The Manchester School, 69(s1), 81–96. doi: https://doi.org/10.1111/1467-9957.69.s1.5
- Asamoah, M. E., Adjasi, C. K. D., & Alhassan, A. L. (2016). Macroeconomic uncertainty, foreign direct investment and institutional quality: Evidence from Sub-Saharan Africa. Economic Systems, 40(4), 612–621. doi: https://doi.org/10.1016/j.ecosys.2016.02.010
- Atenga, E. M. E., & Mougoue, M. (2020). Return and volatility spillovers to African equity markets and their determinants. Empirical Economics. https://doi.org/https://doi.org/10.1007/s00181-020-01881-9
- Babecky, J., Komarek, L., & Komarkova, Z. (2013). Financial integration at times of financial instability. Finance a úvěr: Czech Journal of Economics and Finance, 63(1), 25–45.
- Boako, G., Omane-Adjepong, M., & Frimpong, J. M. (2016). Stock returns and exchange rate nexus in Ghana: A Bayesian quantile regression approach. South African Journal of Economics, 84(1), 149–179. doi: https://doi.org/10.1111/saje.12096
- Bonga-Bonga, L., & Hoveni, J. (2013). Volatility spillovers between the equity market and foreign exchange market in South Africa in the 1995–2010 period. South African Journal of Economics, 81(2), 260–274. doi: https://doi.org/10.1111/saje.12001
- Borojo, D. G., & Yushi, J. (2020). The impacts of institutional quality and business environment on Chinese foreign direct investment flow to African countries. Economic Research-Ekonomska Istraživanja, 33(1), 26–45. doi: https://doi.org/10.1080/1331677x.2019.1696691
- Cai, J. (1994). A Markov model of switching-regime ARCH. Journal of Business and Economic Statistics, 12(3), 309–316. doi: https://doi.org/10.2307/1392087
- Caglayan, M., Kocaaslan, O. K., & Mouratidis, K. (2016). Regime dependent effects of inflation uncertainty on real growth: A Markov switching approach. Scottish Journal of Political Economy, 63(2), 135–155. doi: https://doi.org/10.1111/sjpe.12087
- Cevik, N. K., Dibooglu, S., & Kutan, A. M. (2016). Real and financial sector studies in Central and Eastern Europe: A review. Finance a úvěr: Czech Journal of Economics and Finance, 66(1), 2–31.
- Conlon, T., &Cotter, J. (2012). An empirical analysis of dynamic multiscale hedging using wavelet decomposition. Journal of Futures Markets, 32(3), 272–299. https://doi.org/https://doi.org/10.1002/fut.20519
- David, O. O., & Grobler, W. (2020). Information and communication technology penetration level as an impetus for economic growth and development in Africa. Economic Research-Ekonomska Istraživanja, 33(1), 1394–1418. doi: https://doi.org/10.1080/1331677x.2020.1745661
- Delgado, F. J., Fernandez-Rodriguez, E., & Martinez-Arias, A. (2018). Corporation effective tax rates and company size: Evidence from Germany. Economic Research-Ekonomska Istraživanja, 31(1), 2081–2099. doi: https://doi.org/10.1080/1331677x.2018.1543056
- Dewandaru, G., Rizvi, S. A. R., Masih, R., Masih, M., & Alhabshi, S. O. (2014). Stock market co-movements: Islamic versus conventional equity indices with multi-timescales analysis. Economic Systems, 38(4), 553–571. doi: https://doi.org/10.1016/j.ecosys.2014.05.003
- Dybczak, K., & Galuščak, K. (2013). Changes in the Czech wage structure: does immigration matter? Finance a úvěr: Czech Journal of Economics and Finance, 63(2), 108–128.
- Engle, R. F., Ito, T., & Lin, W.-L. (1990). Meteor showers or heat waves? Heteroskedastic intra-daily volatility in the foreign exchange market. Econometrica, 58(3), 525–542. doi: https://doi.org/10.2307/2938189
- Frommel, M. (2010). Volatility regimes in Central and Eastern European countries’ exchange rates. Finance a úver-Czech Journal of Economics and Finance, 60(1), 2–21.
- Fu, T. Y., Holmes, M. J., & Choi, D. F. S. (2011). Volatility transmission and asymmetric linkages between the stock and foreign exchange markets - A sectoral analysis. Studies in Economics and Finance, 28(1), 36–50. doi: https://doi.org/10.1108/10867371111110543
- Golosnoy, V., Gribisch, B., & Liesenfeld, R. (2015). Intra-daily volatility spillovers in international stock markets. Journal of International Money and Finance, 53, 95–114. doi: https://doi.org/10.1016/j.jimonfin.2015.01.002
- Gray, S. F. (1996). Modelling the conditional distribution of interest rates as a regime-switching process. Journal of Financial Economics, 42(1), 27–62. doi: https://doi.org/10.1016/0304-405x(96)00875-6
- Hamilton, J. D., & Susmel, R. (1994). Autoregressive conditional heteroskedasticity and changes in regime. Journal of Econometrics, 64(1–2), 307–333. doi: https://doi.org/10.1016/0304-4076(94)90067-1
- Hassan, M. K., Maroney, N. C., El-Sady, H. M., & Telfah, A. (2003). Country risk and stock market volatility, predictability, and diversification in the Middle East and Africa. Economic Systems, 27(1), 63–82. doi: https://doi.org/10.1016/s0939-3625(03)00017-7
- He, Q., Xu, L., & Men, Y. (2020). Composition effect matters: Decomposing the gender pay gap in Chinese university graduates. Economic Research-Ekonomska Istraživanja, 33(1), 847–864. doi: https://doi.org/10.1080/1331677X.2020.1734850
- Kanas, A. (2000). Volatility spillovers between stock returns and exchange rate changes: International evidence. Journal of Business, Finance and Accounting, 27(3–4), 447–467. doi: https://doi.org/10.1111/1468-5957.00320
- Klaassen, F. (2002). Improving GARCH volatility forecasts with regime-switching GARCH. Empirical Economics, 27(2), 363–394. doi: https://doi.org/10.1007/s001810100100
- Koenker, R., & Bassett, G. (1978). Regression quantiles. Econometrica, 46(1), 33–50. doi: https://doi.org/10.2307/1913643
- Koenker, R. (2005). Quantile regression. Econometric society monograph series. Cambridge University Press.
- Koutmos, G., & Booth, G. G. (1995). Asymmetric volatility transmission in international stock markets. Journal of International Money and Finance, 14(6), 747–762. doi: https://doi.org/10.1016/0261-5606(95)00031-3
- Lee, C. M., & Lee, H. S. (2016). Improving the predictive power of spreads for economic activity: A wavelet method. Romanian Journal of Economic Forecasting, 19(4), 65–78.
- Leung, H., Schiereck, D., & Schroeder, F. (2017). Volatility spillovers and determinants of contagion: Exchange rate and equity markets during crises. Economic Modelling, 61, 169–180. doi: https://doi.org/10.1016/j.econmod.2016.12.011
- Lin, L., & Lin, W. (2013). Exchange rate reversion under regimes other than free float? International Journal of Finance and Economics, 18(3), 239–306. https://doi.org/https://doi.org/10.1002/ijfe.1465
- Maestri, V. (2013). Imputed rent and distributional effect of housing-related policies in Estonia, Italy and the United Kingdom. Baltic Journal of Economics, 13(2), 37–60. doi: https://doi.org/10.1080/1406099x.2013.10840532
- Madaleno, M., & Pinho, C. (2012). International stock market indices comovements: A new look. International Journal of Finance & Economics, 17(1), 89–102. doi: https://doi.org/10.1002/ijfe.448
- Monfared, S. A., & Enke, D. (2014). Volatility forecasting using a Hybrid GJR-GARCH neural network model. Procedia Computer Science, 36, 246–253. doi: https://doi.org/10.1016/j.procs.2014.09.087
- Njegić, J., Živkov, D., & Damnjanović, J. (2017). Business cycles synchronization between EU15 and the selected Eastern European countries – The wavelet coherence approach. Acta Oeconomica, 67(4), 539–556. doi: https://doi.org/10.1556/032.2017.67.4.3
- Nikkinen, J., Pynnönen, S., Ranta, M., & Vähämaa, S. (2011). Cross-dynamics of exchange rate expectations: A wavelet analysis. International Journal of Finance & Economics, 16(3), 205–217. doi: https://doi.org/10.1002/ijfe.423
- Sare, Y. A., Aboagye, A. Q. Q., & Mensah, L. (2019). Financial development, sectoral effects, and international trade in Africa: An application of pooled mean group (PMG) estimation approach. International Journal of Finance & Economics, 24(1), 328–347. doi: https://doi.org/10.1002/ijfe.1665
- Sikhosana, A., & Aye, G. C. (2018). Asymmetric volatility transmission between the real exchange rate and stock returns in South Africa. Economic Analysis and Policy, 60, 1–8. doi: https://doi.org/10.1016/j.eap.2018.08.002
- Torrence, C., & Webster, P. J. (1999). Interdecadal changes in the ENSO-monsoon system. Journal of Climate, 12(8), 2679–2690. doi: https://doi.org/10.1175/1520-0442(1999)012 < 2679:icitem>2.0.co;2
- Tsai, S.-L., & Chang, T. (2018). The comovement between money and economic growth in 15 Asia-pacific countries: wavelet coherency analysis in time-frequency domain. Romanian Journal of Economic Forecasting, 21(2), 63–79.
- Tule, M., Dogo, M., & Uzonwanne, G. (2018). Volatility of stock market returns and the naira exchange rate. Global Finance Journal, 35, 97–105. doi: https://doi.org/10.1016/j.gfj.2017.08.001
- Vilerts, K. (2018). The public-private sector wage gap in Latvia. Baltic Journal of Economics, 18(1), 25–50. doi: https://doi.org/10.1080/1406099x.2018.1457356
- Vo, X. V., & Tran, T. T. A. (2020). Modelling volatility spillovers from the US equity market to ASEAN stock markets. Pacific-Basin Finance Journal, 59, 101246. doi: https://doi.org/10.1016/j.pacfin.2019.101246
- Yang, S.-Y., & Doong, S.-C. (2004). Price and volatility spillovers between stock prices and exchange rates: Empirical evidence from the G-7 countries. International Journal of Business and Economics, 382, 139–153.
- Yip, P. S., Brooks, R., Do, H. X., & Nguyen, D. K. (2020). Dynamic volatility spillover effects between oil and agricultural products. International Review of Financial Analysis, 69, 101465. doi: https://doi.org/10.1016/j.irfa.2020.101465
- Živkov, D., Njegić, J., & Pećanac, M. (2014). Bidirectional linkage between inflation and inflation uncertainty – the case of Eastern European countries. Baltic Journal of Economics, 14(1–2), 124–139. doi: https://doi.org/10.1080/1406099x.2014.993831
- Živkov, D., Njegić, J., & Milenković, I. (2015). Bidirectional volatility spillover effect between the exchange rate and stocks in the presence of structural breaks in selected Eastern European economies. Czech Journal of Economics and Finance - Finance a Uver, 65(6), 477–498.
- Živkov, D., Manić, S., & Đurašković, J. (2019). Multiscale volatility transmission and portfolio construction between the Baltic stock markets. Finance a Úvěr – Czech Journal of Economics and Finance, 69(2), 211–236.
- Živkov, D., Kuzman, B., & Subić, J. (2019). How do oil price changes impact the major agricultural commodities in different market conditions and in different time-horizons? Economic Computation and Economic Cybernetics Studies and Research, 53(4), 159–175. https://doi.org/https://doi.org/10.24818/18423264/53.4.19.10
- Živkov, D., Pećanac, M., & Ercegovac, D. (2019). Interdependence between stocks and exchange rate in East Asia – A wavelet-based approach. Singapore Economic Review. https://doi.org/https://doi.org/10.1142/S0217590819500450