?Mathematical formulae have been encoded as MathML and are displayed in this HTML version using MathJax in order to improve their display. Uncheck the box to turn MathJax off. This feature requires Javascript. Click on a formula to zoom.
Abstract
The present study aims to examine the effect of energy productivity, international trade, especially by treating exports and imports distinctly with technological innovation and gross domestic product on Consumption-based Carbon emissions for G-7 countries over the period of 1996–2017. This study employed cross-section dependence and slope heterogeneity for evaluating the order of unit root. The cross-sectionally augmented autoregressive distributed lags model (CS-ARDL) is used for evaluating long and short-run relationships among variables; and an augmented mean group and a common correlated mean group test to check for robustness. The findings confirm cointegration relationships with structural breaks (e.g., the 2001 mild recession; the 2008 global financial crisis; the 2011 stock market decline; and the 2014 exports decline in Italy, France, the United Kingdom and Japan) among consumption based carbon emission, energy productivity, exports, imports, gross domestic product, and technological innovation. Further, energy productivity, exports and technological innovation are inversely related to consumption based carbon emission while imports and gross domestic product are positively associated with consumption-based carbon emissions for G-7 countries. The findings recommend the promotion of technological innovation and cleaner production for curbing consumption-based carbon emissions.
1. Introduction
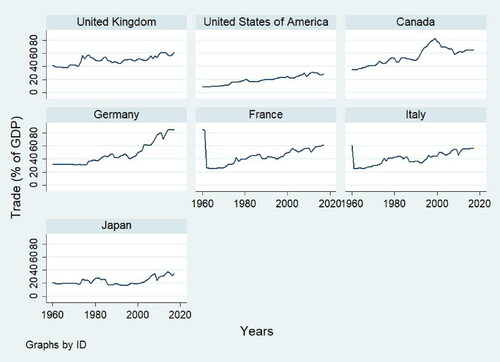
With the rising trend in globalization, technological advancement, and regional connectivity, international trade is on the rise since the last two decades, i.e., from 2005 till 2015, approximately 62% increase is recorded. In 1960 trade contribution as a percentage of GDP accounted merely for 23% but now reached a new high with 58% in the year 2017 as per World Bank estimations (WB, 2017)Footnote1. Similar to developed and developing counties, the Group of Seven (G-7) countries' trade intensity too is on the rise; international trade in terms of goods and services has increased significantlyFootnote2. This rising trend in international trade is helping many developed and developing countries; however, it cost repairable damage to the environment (Halicioglu, Citation2009; Michieka et al., Citation2013).
Territory based and consumption-based carbon emissions (CCO2 emissions hereafter) are the two approaches used to calculate carbon emission. The studies of Halicioglu (Citation2009) mainly traced the effect of production-based carbon emissions (PCO2 emissions hereafter), which does not take into account the production process, which involves many countries and ignored consumption-based carbon emissions. It helps to locate the production of commodities and services in one country and its consumption in other countries. The conventional measure is territory-based carbon emissions, which do not consider imports and exports. Thus, a new consumption-based database has been developed, which calculates carbon emission based on domestic use of fossil fuel and also adds embodied emission from the import minus export (Peters et al., Citation2011). Studies based on comparison of territory based and consumption-based emissions have established an insignificant relation between international trade and territory-based emissions. In contrast, a significant association is established between international trade and consumption-based emissions. Moreover, to analyze the factors affecting PCO2 and CCO2 emissions, both imports and exports can be examined distinctly (Liddle, Citation2018).
Developed countries might reduce carbon emissions through trade with developing countries by transferring carbon emissions to the territory from where the product/services originate. If a country is consuming more carbon emissions than producing, the ratio of CCO2 to TCO2 emissions will be greater than one; on the other hand, if a country is producing more carbon emissions than consuming, the ratio will be less than one. The average ratios of CCO2 to TCO2 emissions and the difference between CCO2 emissions and TCO2 emission for G-7 countries are given in .
Table 1. Average ratios and difference for CCOPC2 & TCOPC2.
reports the ratios of all the G7 countries. The average ratios for all G-7 countries are greater than one, and its difference is also positive, implying that G-7 countries are net importers of emissions. The possible reason of G-7 countries being the net importers depends on its import-export mix.Footnote3
Energy productivity—the total factor energy efficiency by Atalla and Bean (Citation2017) ration among economic output and energy input — wang et al 2017. Productivity is usually considered as a characteristic of the territorial production in a region. It measures the economic output per unit of production inputs required (Simas et al. Citation2015). In this study we focused on energy productivity, if the country is efficient in the production process it will use less energy in the process and have negative impact on consumption-based carbon emission. Thus, energy productivity is expected to have negative impact on consumption-based carbon emission (Khan et al., Citation2020b, Ahmad et al., Citation2019). Moreover, suggests that energy productivity “has a more positive association than energy intensity and is more intuitive. Furthermore, on energy productivity focus has increases rapidly in recent years, like UK and Germany they set goals for 2030 and 2020 respectively to double their energy productivity (DOE, 2014). In G-7 group – Canada and the US having the highest per capita while Italy having the lowest which are up to 7 tonnes and 2 tonnes respectively by Galeotti et al. (Citation2016).
This study contributes to the existing literature in several ways. First, this study traces the effect of energy productivity and international trade (by separately treating exports and imports) on consumption based carbon emissions (which calculates carbon emission based on domestic use of fossil fuel and also adds embodied emission from the import minus export (Peters et al., Citation2011) in G-7 countries. Second, the present study also traces the effect of technological innovation on CCO2 as it has not been tested by any single study so far. Third, the study uses lately developed econometric methods in this area of study for testing unit root, this study uses third generation tests for unit roots, cointegration, CS-ARDL, AMG, CCEMG long and short-run results estimations,. This article is organized as; the first part covers introduction, the second part explains relevant existing literature, the third part data sources, and methodology, the fourth part covers results and discussions, the final section provides conclusion and policy recommendations.
2. Literature review
In the existing literature on the determinants of CO2 emissions, the variable such as GDP, trade, financial development, energy prices, energy consumption, and energy productivity have been highlighted as potentially important determinants of CO2 emissions. However, the role of technological innovation, along with international trade, has attained less importance from the researchers. Few studies have been conducted to investigate the role of international trade, technological innovation and GDP on carbon emissions (Ahmad et al., Citation2018, Omri & Kahouli, Citation2014; Jayanthakumaran et al., Citation2012; Jebli et al., Citation2016; Lu, Citation2017; Michieka et al., Citation2013; Sadorsky, Citation2012; Solarin et al., Citation2017). These studies have used production-based carbon emissions (PCO2) as a measure of environmental degradation. Recently, researchers use consumption-based carbon emissions (CCO2) as a measure of environmental degradation. On the determinants of CCO2 emissions, there are hardly few studies exist, i.e., Hasanov et al. (Citation2018); Chen (2018); Liddle (Citation2018); Knight and Schor (Citation2014) by using different approaches and linking different variables. The study of Hasanov et al. (Citation2018) analyse the impact of international trade on CO2 emissions in the case of nine oil-exporting countries by using a panel cointegration approach from 1995-2013. The author’s fond no significant impact of exports and imports on TCO2 emissions, however, exports and imports have a significant impact on CCO2 emissions, both in the long and short run with opposite signs. Similarly, the study of Knight and Schor (Citation2014) examine CCO2 and TCO2 emissions for 29 rich countries of the world. The results showed that the effect of CCO2 emissions compare to TCO2 is higher on GDP growth. Moreover, the results also revealed a correlation between TCO2 emissions and GDP growth, on the other and no correlation was found between CCO2 and GDP growth. Chen (2018) studied CCO2 emissions accounting for fast-emerging economies of the world for r the duration of 1995–2009. Chen results revealed existence consumption determined of global emission in new model as related to the traditional model. Another study recently by Liddle (Citation2018) investigates the trade-carbon emissions nexus and consumption-based accounting for (102 countries) non-OECD and OECD countries, from 1990-2013. This study reveals that China is liable for more than 50% of world carbon emissions, determined that not for TCO2 emissions but for CCO2 emissions trade was significant and vice versa for vestige fuel content of a country's energy mix.
Li et al. (Citation2020) investigated energy productivity with renewable energy consumption for OECD economies over the period 1990–2017. The results show that they have positive relation with each other, while Attala and bean (2017) studied Determinants of energy productivity for 39 countries for 1995–2009. The finding shows that increases in sectoral energy productivity were the primary driver behind economy-wide energy productivity improvements.
On the role of other determinants such as technological innovations, exports, imports and gross domestic production, several studies exist. The study of Horbach et al. (Citation2012) investigates the environmental impact of economic revolutions. The results show that government regulation is mainly important factor for concerning self-assured firms to reduce the impact of air (e.g. SO2, CO2, or NOx) pollutant. For economic innovation taxation is the key point as well as raw material prices and pointing to the role of energy. Moreover, material use and reducing energy is essential key for cost savings. Another important factor for economic innovation is customer factor, for increasing material efficiency particularly regards to product innovation process and improvement of environmental performance. Moreover, uses dangerous substances and waste. For innovations, product of environment is expected for firms confirm high importance. The empirical findings of Zhu et al. (Citation2016) revealed a positive relation between energy consumption and carbon emissions in The Association of Southeast Asian Nations from 1981 to 2001 by using panel quintile regression model and fully modified OLS, further, the results show that FDI diminish carbon emissions in aforementioned countries. The empirical findings of Omri and Kahouli (Citation2014) revealed that bi-directional causality exist among FDI, GDP growth, and energy consumption for sixty-five different categories of economies in terms of income level. Further, Solarin et al. (Citation2017) employing ARDL for the data from 1980 to 2012, the empirical results show that institutional quality reduces carbon emissions, while technological revolutions and output growth is responsible for the increase in carbon emissions in Ghana. Hossain (Citation2011) examined the linkage between CCO2 emissions, trade openness, energy consumption, and urbanization for the period of 1971-2007 of industrial economies. The results of Hossain (Citation2011) suggest no long-run association among the concern variables, however, the results show causality among the variables in the short run. The findings further specify that in longer period of time energy consumption shown high responsiveness to carbon emissions compare to shorter period of time, causing more damage to the environment.
The study of Al-Mulali and Sheau-Ting (Citation2014) explores the nexus between imports, energy consumption, imports, and carbon emissions in 189 countries for the period of 1990–2011. The results show that trade variables such as imports and exports carbon emissions and energy consumption for all sampled regions without Eastern Europe. At the country level, positive feedback relationship exists between energy consumption, imports, and carbon emissions especially for countries with high trade to GDP ratio. Michieka et al. (Citation2013) investigate China’s export role on CO2 emissions through vector autoregressive and Granger causality. They find that that there is unidirectional connection from export to CO2 emissions. The study of Shahbaz et al. (Citation2013) employing ARDL and Granger causality estimators to the set of data from 1975Q1 to 2011Q1 in case of Indonesia. The results show that the quality of financial institutions and trade with other countries lower carbon emissions in Indonesia, while output growth and an increase in energy usage lead to an increase in carbon emissions. Dedeoğlu and Kaya (Citation2013) investigate exports, imports, GDP and energy use relationships in the case of twenty-five economies of the world for the period of 1980-2010. The empirical results of the said study show that energy use-imports, energy use-GDP, and energy use-exports possess direct relationships and have bidirectional causality between each of the two variables. Jayanthakumaran et al. (Citation2012) made a comparative analysis of India and china from 1971-2007 using ARDL and bound test to cointegration. The empirical results of Jayanthakumaran et al. (Citation2012) revealed that in case of China, structural changes, per capita income, and energy usage leads to carbon emissions. However, in case of India, these findings are opposite and cannot be established. The study of Lau et al. (Citation2014) examines the effect of FDI and trade openness on environmental quality for the period of 1970–2008 in Malaysia. The empirical results of Bound testing show that both foreign direct investment and international trade leads to worsen the quality of environment in Malaysia. Lu (Citation2017) investigates energy, output growth and CO2 in the case of twenty-four Asian countries using panel cointegration method from 1990 to 2012. According to study in China, Iraq, Pakistan, Saudi Arabia, Yemen, and Philippines CO2 emissions positively affect energy usage. Furthermore, output growth causes energy to increase and it’s determined mainly by GDP in countries like Turkey, Sri Lanka, United Arab Emirates, Malaysia, Jordan, Thailand, India, Mongolia and Saudi Arabia. Further, there is bidirectional causality among variables. Jebli et al. (Citation2016) investigate energy consumption and trade in the presence of the environmental Kuznets curve hypothesis to the data set of 25 countries by using Granger causality test. They find bidirectional causality between energy consumption and trade; there is also unidirectional causality from trade to CO2 emissions.
3. Methodology
3.1. Data sources and theoretical framework
This paper explores the effect of global trade on CCO2 emissions in the presence of Energy Productivity, technological innovation and gross domestic product. This study uses different approach not only by using Energy Productivity, technological innovation as new explanatory variables but also employing recently developed econometric approaches to get the results. Moreover, the selected sample area for this country is G-7 countries, indicated by for the period of 1996-2017 indicated through
Data for (CCO2i,t) and (TCO2i,t), which is measured in kgCO2 is obtained from the Global Carbon Atlas (GCA) by Peters et al. (Citation2011). While real gross domestic product (GDPi,t) is measured in USA dollars (USD), exports (EXi,t) and imports (IMi,t) as a percentage of gross domestic product similar, technological innovation (TIi,t) which is measured as patents obtained by both residents and non-residents individuals and population data is obtained from the World Bank's World Development Indicators (WDI, 2018). Moreover, Productivity is usually considered as a characteristic of the territorial production in a region. It measures the economic output per unit of production inputs required (Simas et al. Citation2015). In this study we focused on energy productivity, if the country is efficient in the production process it will use less energy in the process and have negative impact on consumption-based carbon emission. Thus, energy productivity is expected to have negative impact on consumption-based carbon emission (Khan et al., Citation2020b). Energy Productivity (
obtained from OECD (2019). Data converted into log and per capita form. The model specification is given as:
(1)
(1)
The basic econometric equation for data estimation is given as
(2)
(2)
The rationale behind using the selected variables given in EquationEquation (2)(2)
(2) is mainly due to the current and past literature with a strong theoretical motivation. The earlier studies by Ren et al. (Citation2014) use TCO2 emissions ignoring CCO2 emissions which embodied trade such as goods and services produced in one country and consumed in the others. It is imperative to take into account the effect of trade to identify the factors that increase or decreases CCO2 emissions in G-7 countries. Unlike conventional carbon emissions approach, exports are negatively linked with CCO2 emissions. Following Peters et al. (Citation2012), the association of exports with CCO2 emissions is expected to be negative such as
Similarly, imports produced in other countries and consumed in recipient countries such as
Gross domestic product which contains significant portion of consumption is expected to be directly related with CCO2 emissions. Following Seker et al. (Citation2015), GDP is expected to have positive impact on CCO2 emissions, i.e.
Technological innovation which is crucial for controlling CO2 is expected to be inversely linked with CCO2 emissions such as
Energy productivity which is also vital for controlling CO2 is expected to be inversely linked with CCO2 emissions such as
In order to deal with long-time panel data, it is essential to check for different issues in the model. To begin our analysis this study initially tests cross-section dependence between units followed by testing slope coefficient heterogeneity. In the presence of both aforementioned issues this study avoids first-generation unit root tests because we may get biased cointegration and stationary results by employing first-generation tests with size distortion and spurious outcomes (Jalil, Citation2014; Salim et al., Citation2017; Westerlund, Citation2007). Therefore, it is important to employing the test of Pasaran and Yamagta (2008) to check heterogeneous slope coefficients and the test of Pasaran (2015) for cross-section dependence. Once these issues are confirmed, the next step is the use of relevant stationary test. This study implements the cross-sectional augmented (CIPS) unit root test of Pesaran (Citation2007) to deals with the problem of cross-section dependence and heterogeneous slope coefficients, this study implements the cross-sectional augmented Pesaran and Shin (CIPS) unit root test of Pesaran (Citation2007) and the unit root test of Bai & Carrion-I-Silvestre (Citation2009). The use of panel cointegration tests of Westerlund (Citation2005) and Pedroni (Citation2004) does not provide efficient results with distortion of size and the possibility of structural breaks in the model. Although, Westerlund (Citation2007) deals with both cross-section dependence and heterogeneity in slope coefficients; however, it cannot deal with the possible structural breaks in the model and even serial correlation in errors. Therefore, to overcome the above-mentioned issues, this study utilizes the Westerlund and Edgerton (Citation2008) panel based cointegration test. This study use CS-ARDL test to check the long-run and short-run relationship among CCO2, EX, IM, GDP, EP and TI. The use of conventional method is likely to provide biased results, Thus to analyse the short-run and long-run effect of imports, exports, gross domestic product, energy productivity and technological innovation on CCO2 for G-7 countries, we applied CS-ARDL estimator in this study. The equation is given as
(3)
(3)
To solve the issue of cross sectional dependency and slope heterogeneity, the extended version of EquationEquation (3)(3)
(3) is given as
(4)
(4)
In EquationEquation (4)(4)
(4) ,
Provide the averages, similarly lags are shown through
is dependent variable such as CCO2, followed by
for all the independent variables like EX, IM, GDP, EP and TI
is dummy for time period.
The long-run coefficients is provided through EquationEquation (5)(5)
(5)
(5)
(5)
Whereas EquationEquation (6)(6)
(6) shows the mean group
(6)
(6)
Likewise, the short-run coefficients is given in EquationEquation (7)(7)
(7)
In CS-ARDL, the ECM should be statistically significant, as it shows the speed of adjustment towards equilibrium. Additionally, this study will use AMG by Eberhardt and Teal (Citation2010), and CCEMG by Pesaran (Citation2006) to check for robustness, Moreover, both of these tests provides better results with unobserved common factors, non-stationary, cross-section dependence, and heterogeneous slope.
4. Empirical findings and discussions
Since the main objective of this study is to capture the effect of Energy productivity, international trade especially by treating exports and imports distinctly with technological innovation and GDP on CCO2. We use the cross-section dependence and slope heterogeneity test. The results of both these tests are stated in , indicate the existence of cross-section dependence between the units with highly statistically significant. Therefore, the unit root and co-integration test cannot be applied. The reasons for cross-section dependence are the local and universal economic shocks, globalization, economic integrations, and trade interaction within different economies of the world.
Table 2. Cross-section dependence and slope heterogeneity test.
Similarly, the results of heterogeneity test show that the coefficient slopes are for model under consideration in this study are heterogeneous with statistically significant results. Based on these results with cross-section dependence and heterogeneous slope coefficients, the present study employs the unit root tests of Carrion-i-Silvestre (2009), co-integration test, CS-ARDL, AMG and CCEMG tests.
contains the results of unit root test. The results confirm that GDP is stationary at level, while the other time series variables are non-stationary at level, findings given in the lower part of . To remove the non-stationarity from each series, we took the first difference of the variables and it is important to mention that the times series variables seem stationary at first difference with different levels of statistical significance. Therefore, we can conclude that the time series variables are integrated of order one, I(1).
Table 3. Panel unit root tests.
shows the results of panel co-integration test. For mean shift, the result with high level of statistical significance confirms that there exists co-integrating association among the variables. Similarly, for regime shift, the results verified the existence of co-integrating association with structural breaks among the variables. After verifying for co-integration among variables, the next stage is to use CS-ARDL test to analyse both long run and short-run association with magnitude of each variable.
Table 4. Westerlund and Edgerton (Citation2008) Panel Cointegration Test.a
shows results for CS-ARDL test. The results reveal that exports, imports, gross domestic product, energy productivity and technological innovation have statistically significant relationship with CCO2 emissions. The negative values in short and long-run (CS-ARDL) of exports, energy productivity and technological innovation shows that increase in these variables deceased carbon emission in G-7 countries. On the other hand, positive values in short and long-run (CS-ARDL) of imports and GDP suggests that if there is increase in these variables there will be increase in Carbon emission in G-7 countries. As expected, in the G-7 countries, energy productivity and technological innovation aims to promote energy-efficient or energy-saving production process which reduces CO2 emissions. also reports that exports have negative relation with carbon emission while imports is linked with increasing CCO2 in the G-7 countries which needs explanation. G-7 countries are highly developed, and they are trying to reduce their carbon emission, this results in an environmentally safe production sample shift Commodities. Moreover, G-7 countries imports environmental friendly products which apply positive effect over carbon emission. This finding can be supportive evidence for the findings of Wong et al. (Citation2013); Zhang et al. (Citation2017), Wurlod and Noailly (Citation2018) and Alvarez-Herranz et al. (Citation2017).
Table 5. CS-ARDL Results.
In addition, GDP have positive impact on carbon emission. GDP per capita record an average rise of 0.0047% (long-run) and 0.0079% (short-run) in CCO2 emissions. Explanation for this is, there is an increase in economic activity which increase energy demand. Which adds more carbon emission, therefore increase in GDP exert positive impact on carbon emission. The results supported by Safi et al. (Citation2020), Zhang and Da (Citation2015) and Destek and Sarkodie (Citation2019).
The finding in also mirrors that on average Technological innovation in the G-7 countries cause −0.083% in long-run and −0.158% in short-run decline in CCO2 emissions. Meanwhile, technological innovation is vital factor for transmitting the economy to further sustainable source of energy, therefore, carbon emission decline by improving environmental friendly technology. With low taxes on firm can improve environmental performance and with thus a country can reduced their consumption based carbon emission. These study supported the results of Khan et al. (Citation2020a), Alvarez-Herranz et al. (Citation2017) and Zhang et al. (Citation2017).
Likewise, energy productivity is inversely linked with CCO2 emissions; One per cent increase in energy productivity decline CCO2 emission in an average of −0.18% in long-run and −0.14%. Energy productivity enhances renewable energy, with an increase in productivity energy consumption decreases. There is a negative relation between energy productivity and consumption based carbon emission as productivity is directly linked with consumption. An efficient production system have high productivity and make use of less energy and thus reduces carbon emission this study. This finding can be supportive evidence for the findings of Khan et al. (2020c). The results for ECM (-1) shows that around 86% disequilibrium is corrected every year. The result in further indicates that all the variables are statistically significant with mixed level of integration.
As robust estimators, provides the results of AMG and CCEMG. The results shows that both AMG and CCEMG verify the adverse effect of energy productivity, technological innovation and exports on CCO2 emissions. In contrast, imports and GDP shows direct effect on CCO2 emissions. The results for this study are accordance to the outcomes of Khan et al. (2020). It is noteworthy to mention that the results of CS-ARDL are in line with the outcomes of AMG and CCEMG.
Table 6. Robustness check.
5. Conclusion and policy recommendations
The present study attempts to examine the relationship between CCO2 emissions and international trade by separately taking exports and imports per capita with technological innovation, energy productivity and GDP per capita as additional explanatory variables for G-7 economies in the period of 1996-2017. This study employs cross-section dependence, slope heterogeneity, unit root, co-integration, CS-ARDL, AMG and CCEMG tests. To test for the co-integrating relationship with structural breaks among the time series variables, this study applies Westerlund and Edgerton (Citation2008) test to tackle heterogeneous slope coefficients, structural breaks and cross-section dependence issues. The results from Westerlund and Edgerton co-integration test confirm co-integrating relationships among time series variables for both level and regime shift. The outcomes of CS-ARDL, AMG and CCEMG estimators reveal that CCO2 are directly affected by imports and GDP per capita, energy productivity, imports and technological innovation in the G-7 countries have negative or inverse relationship with CCO2 emissions.
In the lights of our outcomes, this study recommends that:
To promote environmental friendly technology is helpful to reduce CO2 emissions.
Governors should put a carbon tax on emissions-intensive products on both imported materials for production and consumption.
Governors should restrict the consumption of emissions-intensive products through environmental regulations.
According to the results to decrease the impact of GDP and Imports over CO2 emission, they should targeted domestic consumption, especially more energy intensive or those sectors which is the main cause to increase CO2 emissions.
According to results, these countries are highly energy consumption countries so these economies need seek to balance over energy productivity, GDP, international trade and technology innovation.
For further research work, the gap in this area can be filled by checking the linkage between green finance and CCO2 emissions. Moreover, the present study identify strong empirical outcomes, further studies should be conducted in a different group of countries.
Disclosure statement
No potential conflict of interest was reported by the author(s).
Notes
1 World Merchandise trade percent to GDP and total World Trade as a percent of GDP are given in Appendix-I
2 Trade as Percentage of GDP for G-7 Countries are given in Appendix-I
3 Thoroughly analyzing the imported products of these countries, in the last five years, the United States mainly imported 30% machines,16% transportation produce, and 9.1% mineral products which is a major share of the total import. For Japan imports of machinery is 25% and minerals 23%, for Germany 27% machinery, 14% transportation products and 12% Chemical products. For U.K, the total imports are led by machines which account for 21%, 16% transportation, 9.7% chemical products and mineral products represent 9% of the total imports. Similarly, France's total imports are led by 22% machinery, 15% transportation, 11% Chemical and 9.9% mineral products. Italy imports mainly contains 18% machinery, 12% Chemical and mineral products, while transportation represents 12% of the total imports. For Canada Imports covers major shares with 24% machines products, 20% transportation products, and 9.5% mineral products 9.5% (Simoes et al.). These figures suggest that majority of products imported by G-7 countries.
References
- Ahmad, M., Khan, Z., Rahman, Z. U., Khattak, S. I., & Khan, Z. U. (2019). Can innovation shocks determine CO2 emissions (CO2e) in the OECD economies? A new perspective. Economics of Innovation and New Technology, 1–21.
- Ahmad, M., Khan, Z., Ur Rahman, Z., & Khan, S. (2018). Does financial development asymmetrically affect CO2 emissions in China? An application of the nonlinear autoregressive distributed lag (NARDL) model. Carbon Management, 9(6), 631–644. https://doi.org/https://doi.org/10.1080/17583004.2018.1529998
- Al-Mulali, U., & Sheau-Ting, L. (2014). Econometric analysis of trade, exports, imports, energy consumption and CO2 emission in six regions. Renewable and Sustainable Energy Reviews, 33, 484–498. https://doi.org/https://doi.org/10.1016/j.rser.2014.02.010
- Alvarez-Herranz, A., Balsalobre-Lorente, D., Shahbaz, M., & Cantos, J. M. (2017). Energy innovation and renewable energy consumption in the correction of air pollution levels. Energy Policy, 105, 386–397. https://doi.org/https://doi.org/10.1016/j.enpol.2017.03.009
- Atalla, T., & Bean, P. (2017). Determinants of energy productivity in 39 countries: An empirical investigation. Energy Economics, 62, 217–229. https://doi.org/https://doi.org/10.1016/j.eneco.2016.12.003
- Bai, J., & Carrion-I-Silvestre, J. L. (2009). Structural changes, common stochastic trends, and unit roots in panel data. Review of Economic Studies, 76(2), 471–501. https://doi.org/https://doi.org/10.1111/j.1467-937X.2008.00530.x
- Dedeoğlu, D., & Kaya, H. (2013). Energy use, exports, imports and GDP: New evidence from the OECD countries. Energy Policy, 57, 469–476. https://doi.org/https://doi.org/10.1016/j.enpol.2013.02.016
- Destek, M. A., & Sarkodie, S. A. (2019). Investigation of environmental Kuznets curve for ecological footprint: the role of energy and financial development. Science of the Total Environment, 650, 2483–2489.
- Eberhardt, M., & Teal, F. (2010). Productivity analysis in global manufacturing production. DEGIT, Dynamics, Economic Growth, and International Trade.
- Galeotti, M., Howarth, N., & Lanza, A. (2016). Energy productivity in the GCC: evidence from an international Kuznets curve analysis (No. ks–1648-mp043a). King Abdullah Petroleum Studies and Research Center.
- Halicioglu, F. (2009). An econometric study of CO2 emissions, energy consumption, income and foreign trade in Turkey. Energy Policy, 37(3), 1156–1164. https://doi.org/https://doi.org/10.1016/j.enpol.2008.11.012
- Hasanov, F. J., Liddle, B., & Mikayilov, J. I. (2018). The impact of international trade on CO2 emissions in oil exporting countries: Territory vs consumption emissions accounting. Energy Economics, 74, 343–350. https://doi.org/https://doi.org/10.1016/j.eneco.2018.06.004
- Horbach, J., Rammer, C., & Rennings, K. (2012). Determinants of eco-innovations by type of environmental impact—The role of regulatory push/pull, technology push and market pull. Ecological economics, 78, 112–122.
- Hossain, M. S. (2011). Panel estimation for CO2 emissions, energy consumption, economic growth, trade openness and urbanization of newly industrialized countries. Energy Policy, 39(11), 6991–6999.
- Jalil, A. (2014). Energy–growth conundrum in energy exporting and importing countries: Evidence from heterogeneous panel methods robust to cross-sectional dependence. Energy Economics, 44, 314–324. https://doi.org/https://doi.org/10.1016/j.eneco.2014.04.015
- Jayanthakumaran, K., Verma, R., & Liu, Y. (2012). CO2 emissions, energy consumption, trade and income: a comparative analysis of China and India. Energy Policy, 42, 450–460. https://doi.org/https://doi.org/10.1016/j.enpol.2011.12.010
- Jebli, M. B.,Youssef, S. B., &Ozturk, I. (2016). Testing environmental Kuznets curve hypothesis: The role of renewable and non-renewable energy consumption and trade in OECD countries. Ecological Indicators, 60, 824–831.
- Khan, Z., Ali, M., Jinyu, L., Shahbaz, M., & Siqun, Y. (2020b). Consumption-based carbon emissions and trade nexus: Evidence from nine oil exporting countries. Energy Economics, 89, 104806. https://doi.org/https://doi.org/10.1016/j.eneco.2020.104806
- Khan, Z., Ali, S., Umar, M., Kirikkaleli, D., & Jiao, Z. (2020a). Consumption-based carbon emissions and international trade in G7 countries: The role of environmental innovation and renewable energy. Science of the Total Environment, 730, 138945. https://doi.org/https://doi.org/10.1016/j.scitotenv.2020.138945
- Knight, K., & Schor, J. (2014). Economic growth and climate change: A cross-national analysis of territorial and consumption-based carbon emissions in high-income countries. Sustainability, 6(6), 3722–3731. https://doi.org/https://doi.org/10.3390/su6063722
- Lau, L. S., Choong, C. K., & Eng, Y. K. (2014). Investigation of the environmental Kuznets curve for carbon emissions in Malaysia: Do foreign direct investment and trade matter? Energy Policy, 68, 490–497. https://doi.org/https://doi.org/10.1016/j.enpol.2014.01.002
- Li, J., Zhang, X., Ali, S., & Khan, Z. (2020). Eco-innovation and energy productivity: New determinants of renewable energy consumption. Journal of Environmental Management, 271, 111028.
- Liddle, B. (2018). Consumption-based accounting and the trade-carbon emissions nexus. Energy Economics, 69, 71–78. https://doi.org/https://doi.org/10.1016/j.eneco.2017.11.004
- Lu, W.-C. (2017). Renewable energy, carbon emissions, and economic growth in 24 Asian countries: evidence from panel cointegration analysis. Environmental Science and Pollution Research, 24(33), 26006–26015. https://doi.org/https://doi.org/10.1007/s11356-017-0259-9
- Michieka, N. M., Fletcher, J., & Burnett, W. (2013). An empirical analysis of the role of China’s exports on CO2 emissions. Applied Energy, 104, 258–267. https://doi.org/https://doi.org/10.1016/j.apenergy.2012.10.044
- Omri, A., & Kahouli, B. (2014). Causal relationships between energy consumption, foreign direct investment and economic growth: Fresh evidence from dynamic simultaneous-equations models. Energy Policy, 67, 913–922. https://doi.org/https://doi.org/10.1016/j.enpol.2013.11.067
- Pedroni, P. (2004). Panel cointegration: asymptotic and finite sample properties of pooled time series tests with an application to the PPP hypothesis. Econometric theory, 597–625.
- Pesaran, M. H. (2006). Estimation and inference in large heterogeneous panels with a multifactor error structure. Econometrica, 74(4), 967–1012. https://doi.org/https://doi.org/10.1111/j.1468-0262.2006.00692.x
- Pesaran, M. H. (2007). A simple panel unit root test in the presence of cross‐section dependence. Journal of Applied Econometrics, 22(2), 265–312. https://doi.org/https://doi.org/10.1002/jae.951
- Pesaran, M. H., & Yamagata, T. (2008). Testing slope homogeneity in large panels. Journal of Econometrics, 142(1), 50–93.
- Peters, G. P., Davis, S. J., & Andrew, R. (2012). A synthesis of carbon in international trade. Biogeosciences , 9(8), 3247–3276. https://doi.org/https://doi.org/10.5194/bg-9-3247-2012
- Peters, P., Minx, J. C., Weber, L., & Edenhofer, O. (2011). Growth in emission transfers via international trade from 1990 to 2008. Proceedings of the National Academy of Sciences USA, 108(21), 8903–8908. Updated from Peters, G (2011). https://doi.org/https://doi.org/10.1073/pnas.1006388
- Ren, S., Yin, H., & Chen, X. (2014). Using LMDI to analyze the decoupling of carbon dioxide emissions by China's manufacturing industry. Environmental Development, 9, 61–75. https://doi.org/https://doi.org/10.1016/j.envdev.2013.11.003
- Sadorsky, P. (2012). Energy consumption, output and trade in South America. Energy Economics, 34(2), 476–488. https://doi.org/https://doi.org/10.1016/j.eneco.2011.12.008
- Safi, A., Chen, Y., Wahab, S., Ali, S., Yi, X., & Imran, M. (2020). Financial Instability and Consumption-based Carbon Emission in E-7 Countries: The Role of Trade and Economic Growth. Sustainable Production and Consumption, 27, 383–391.
- Salim, R., Yao, Y., & Chen, G. S. (2017). Does human capital matter for energy consumption in China? Energy Economics, 67, 49–59. https://doi.org/https://doi.org/10.1016/j.eneco.2017.05.016
- Seker, F., Ertugrul, H. M., & Cetin, M. (2015). The impact of foreign direct investment on environmental quality: A bounds testing and causality analysis for Turkey. Renewable and Sustainable Energy Reviews, 52, 347–356. https://doi.org/https://doi.org/10.1016/j.rser.2015.07.118
- Shahbaz, M., Hye, Q. M. A., Tiwari, A. K., & Leitão, N. C. (2013). Economic growth, energy consumption, financial development, international trade and CO2 emissions in Indonesia. Renewable and Sustainable Energy Reviews, 25, 109–121. https://doi.org/https://doi.org/10.1016/j.rser.2013.04.009
- Simas, M.,Wood, R., &Hertwich, E. (2015). Labor embodied in trade: The role of labor and energy productivity and implications for greenhouse gas emissions. Journal of Industrial Ecology, 19(3), 343–356.
- Solarin, S. A., Al-Mulali, U., Musah, I., & Ozturk, I. (2017). Investigating the pollution haven hypothesis in Ghana: an empirical investigation. Energy, 124, 706–719. https://doi.org/https://doi.org/10.1016/j.energy.2017.02.089
- Swamy, P. A. (1970). Efficient inference in a random coefficient regression model. Econometrica, 38(2), 311–323. https://doi.org/https://doi.org/10.2307/1913012
- Westerlund, J. (2005). New simple tests for panel cointegration. Econometric Reviews, 24(3), 297–316. https://doi.org/https://doi.org/10.1080/07474930500243019
- Westerlund, J. (2007). Testing for error correction in panel data. Oxford Bulletin of Economics and Statistics, 69(6), 709–748. https://doi.org/https://doi.org/10.1111/j.1468-0084.2007.00477.x
- Westerlund, J., & Edgerton, D. L. (2008). A simple test for cointegration in dependent panels with structural breaks. Oxford Bulletin of Economics and Statistics, 70(5), 665–704. https://doi.org/https://doi.org/10.1111/j.1468-0084.2008.00513.x
- Wong, S. L., Chang, Y., & Chia, W. M. (2013). Energy consumption, energy R&D and real GDP in OECD countries with and without oil reserves. Energy Economics, 40, 51–60.
- Wurlod, J. D., & Noailly, J. (2018). The impact of green innovation on energy intensity: An empirical analysis for 14 industrial sectors in OECD countries. Energy Economics, 71, 47–61. https://doi.org/https://doi.org/10.1016/j.eneco.2017.12.012
- Zhang, Y. J., & Da, Y. B. (2015). The decomposition of energy-related carbon emission and its decoupling with economic growth in China. Renewable and Sustainable Energy Reviews, 41, 1255–1266.
- Zhang, Y. J., Peng, Y. L., Ma, C. Q., & Shen, B. (2017). Can environmental innovation facilitate carbon emissions reduction? Evidence from China. Energy Policy, 100, 18–28. https://doi.org/https://doi.org/10.1016/j.enpol.2016.10.005
- Zhu, H., Duan, L., Guo, Y., & Yu, K. (2016). The effects of FDI, economic growth and energy consumption on carbon emissions in ASEAN-5: evidence from panel quantile regression. Economic Modelling, 58, 237–248. https://doi.org/https://doi.org/10.1016/j.econmod.2016.05.003
Appendices
Figure A1. CCO2 to TCO2 Emissions. Source: Authors own Calculations based on Peters et al. (2012) database.
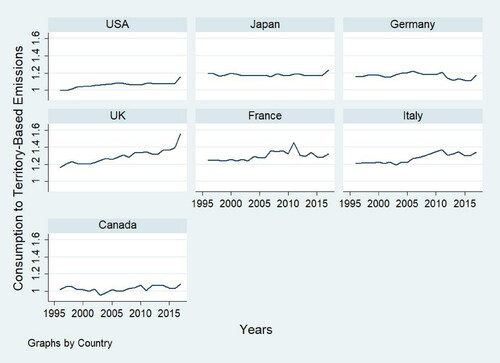
Figure A2. Difference between CCO2 and TCO2Emissions.
Source: Authors own Calculations based on Peters et al. (Citation2012) database.
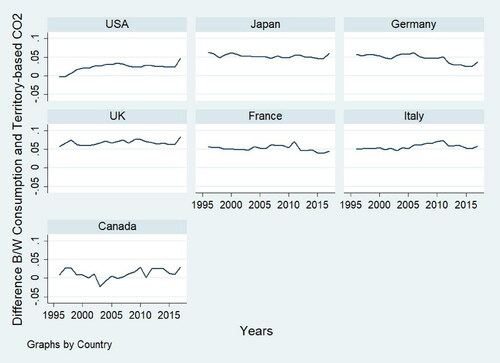
Figure A3. Trade as a percentage of GDP and Merchandise of Goods for World.
Source: Calculations based on World Bank database.
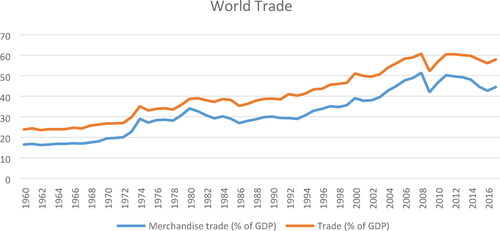
Figure A4. Trade as a percentage of GDP and Merchandise of Goods for World.
Source: Authors own Calculations based on World Trade Organization (WTO, 2017) database.