
 ?Mathematical formulae have been encoded as MathML and are displayed in this HTML version using MathJax in order to improve their display. Uncheck the box to turn MathJax off. This feature requires Javascript. Click on a formula to zoom.
Abstract
In this paper, a nonparametric method is used to measure the total factor productivity (TFP) growth index in Chinese agriculture from 1981 to 2017, and the factor bias of technological progress is identified based on the theory of induced technological progress. Then, according to the degree of dependence of technological progress on fertiliser, biased technological progress is divided into green-biased technological progress and pollution-biased technological progress, and then empirical test the factors allocation structure that induce and promote green-biased technological progress. The results show that China's agricultural TFP has undergone three stages of accelerated growth, negative growth and fluctuation, and the growth momentum has undergone three transformations, which are jointly driven by technological efficiency and technological progress, dominated by technological progress and dominated by technological efficiency. Biased technological progress has contributed to the long-term growth of agricultural TFP in most regions of China, but it is mainly biased towards capital-using and fertiliser-using. The labour/capital ratio and the capital/fertiliser ratio are increased, reducing the capital/soil ratio, which can induce and promote green-biased technological progress while suppressing pollution-biased technological progress. The mechanism test results show that increasing labour input can indirectly promote green technological progress by reducing mechanisation.
JEL CODES:
1. Introduction
Since the ‘green revolution’ in agriculture, the invention and adoption of new technologies have effectively contributed to increased food production in Asian countries. In the case of China in particular, less than 10% of the world’s arable soil supports 1/5 of the world’s population (Fei & Lin, Citation2016) and even achieved a ‘twelve consecutive increase’ in food production between 2003 and 2015, responding strongly to the question of ‘who feeds China’. In terms of the reasons for China’s rapid agricultural growth, it is generally accepted in the academic community that it comes from, on the one hand, the heavy use of agrochemicals such as fertiliser and pesticide (Gong, Citation2018a; Wu et al., Citation2018). On the other hand, the increase in TFP brought by agricultural technology innovation and extension (Gong, Citation2018b, Citation2020; Li et al., Citation2018).
From 1978 to 2016, China’s total fertiliser-using increased by nearly six times (Wang et al., Citation2019), accounting for more than 1/3 usage of global fertiliser, but the utilisation rate was less than half of the world average (Wu et al., Citation2018), and long-term excessive use of agrochemicals has caused inestimable damage to environmental quality, agroecology, food security and human health (Savcı, Citation2012; Wang et al., Citation2019; Wu et al., Citation2018; Xiang et al., Citation2020). While it is possible to break the growth bottleneck of relying solely on increased factor inputs by increasing total factor productivity, such technological advances, with the primary objective of maximising agricultural output, still need to be applied to the agricultural production chain through specific factors of production, such as fertiliser and pesticide, which can have a negative impact on the ecosystem. This has raised academic concerns about the sustainability of agricultural development in China. At the same time, it has also stimulated extensive discussion in the academic community on what is the theoretical logic and practical basis for China to embark on the path of chemical agriculture as a traditional agricultural country with a large number of people and little land. How should the current overuse of chemical farming be transformed and technological progress induced to favour the green side, while ensuring agricultural growth?
According to Hicks (Citation1932), the relative changes in the prices of production factors will induce technological innovation or invention, as well as the saving of expensive or scarce factors and using of cheap or abundant factors in the form of technological innovation (Ahmad, Citation1966). On this basis, Hayami and Ruttan (Citation1970) further applied the induced innovation theory to agriculture, arguing that changes in the relative endowment of soil and labour are the key factors that determine the direction of agricultural technological change. It is deduced that agricultural technology can be divided into mechanical technology and biochemical technology, the former can save labour, while the latter can increase the yield of crops per unit of soil area, that is, the ‘induced innovation hypothesis’ (Binswanger, Citation1974; Hayami & Ruttan, Citation1985). The ‘Induced Innovation Hypothesis’ has been proven in many countries once it was proposed. It is more consistent that, in the context of the general rise in labour costs, agricultural technological progress in various countries has shown labour-saving, and machinery- and fertiliser-using (Bailey et al., Citation2004; Baležentis & Oude Lansink, Citation2020; Klump & Cabrera, Citation2008; Managi & Karemera, Citation2004; Yamauchi, Citation2016). At the same time, some scholars have tested whether China ‘s agriculture follows the ‘Induced Innovation Hypothesis’ and found that under the dual constraints of soil shortage and rising labour costs, Chinese agriculture generally uses machinery to replace labour, and uses a large amount of fertiliser to make up for soil shortages (Gong, Citation2018a, Citation2020; Wang et al., Citation2019). The direction of technological progress is consistent with that of most countries with similar endowment structures, which are represented by labour- and soil-saving, machinery- (capital), and fertiliser-using (Ito, Citation2010; Li et al., Citation2018; Zhu et al., Citation2016).
Undoubtedly, this technology structure that matches the factor endowment structure can enhance agricultural output and TFP (Antonelli & Quatraro, Citation2010). However, if producers blindly pursue the maximisation of private profits and excessive use of cheaper dirty factors, then technological progress will be biased towards pollution-biased technological progress, causing severe environmental pollution (Acemoglu et al., Citation2012). Particularly under China’s current household registration system, rural labourers entering urban employment still maintain arable soil and work part-time in agricultural production activities, which makes it difficult to transfer and concentrate soil and limits the substitution of machinery for labour (Ito, Citation2010; Li et al., Citation2017). In order to maintain food production, farmers often tend to add more fertiliser per unit area of soil to make up for the lack of labour input (Liu et al., Citation2014; Wang et al., Citation2019), which further induces agricultural technology progress towards the fertiliser-using, aggravating agricultural non-point source pollution (Xiang et al., Citation2020). At the same time, however, scholars have found that there is a negative correlation between land and fertiliser, with a significant 0.5% reduction in fertiliser and pesticide use for every 1% expansion of land area (Wu et al., Citation2018). Moreover, while the scale of the soil is expanding, it can also increase the use of labour and capital (mechanical) with a cost-benefit advantage (Baležentis & Oude Lansink, Citation2020), thereby inducing technological progress-biased capital (mechanical) using and fertiliser-saving (Ito, Citation2010; Yamauchi, Citation2016). So, does it mean that the current fertiliser-using biased technological progress can be reversed by optimising the factor allocation structure? In order to induce technological progress to be green, what is the specific relationship between the four factors of labour, capital, soil and fertiliser? The answers to these questions not only help us to understand more clearly the process of allocation the factors that induce green technological progress in Chinese agriculture, but also provide important theoretical guidance and practical implications for reconciling food security and ecological security.
Compared with the existing literature, the main contributions of this paper are summarised as follows. Firstly, the measurement methods of technological progress can be roughly divided into parametric methods and nonparametric methods. The parametric method has a good economic theory foundation, and can be used to decompose TFP and biased technological progress based on economic theory. However, due to the need to set functional forms, such as the constant elasticity substitution (CES) production function (Zha et al., Citation2017), the Cobb–Douglas production function (Antonelli & Quatraro, Citation2010; Ito, Citation2010), and the translog cost function (Karanfil & Yeddir-Tamsamani, Citation2010; Zhu et al., Citation2016) and stochastic frontier approach (Shao et al., Citation2016; Yang et al., Citation2018), there is a greater risk of incorrect production function setting. In contrast, nonparametric methods do not need to set specific production functions, can include multiple inputs and multiple outputs, can be decomposed into multiple indicators, and other advantages, which have increasingly been favoured by more and more scholars (Baležentis & Oude Lansink, Citation2020; Briec et al., Citation2011; Li et al., Citation2018; Song & Wang, Citation2016). In view of this, this paper uses a nonparametric method to measure TFP, and based on the ideas of Fare et al. (Citation1997) and Li et al. (Citation2018), decomposes and identifies biased technological progress. However, it is different from the existing nonparametric methods in order to eliminate the degradation of the pseudo-technology of the traditional DEA method; that is, the current output set has nothing to do with the previous feasible technology. Based on the method of Shestalova (Citation2003), this paper uses the output-biased sequential data envelopment analysis (DEA) method to construct the technological frontier, and based on the biased Malmquist index, it decomposes input-biased technological progress from TFP.
Secondly, the existing literature on biased technological progress in agriculture is mainly focused on descriptive research and only regards the direction of technological progress as a simple response to the process of factor endowment structural change. This obviously ignores the logical relationship of adjusting the technological progress direction by manipulating the factors allocation structure in the specific production process. According to Hayami and Ruttan (Citation1970), Binswanger (Citation1974) and Hayami and Ruttan (Citation1985), the relative changes in the factor endowment structure determine the direction of technological change. Therefore, when this technological progress direction has serious pollution characteristics, the government can adjust the factor allocation structure through policy tools or market methods, and induce green-biased technological progress (Acemoglu et al., Citation2012). Based on this logic, this paper divides technological progress into green-biased technological progress when technological progress is biased towards fertiliser-saving (labour-using/fertiliser-saving, capital-using/fertiliser-saving and soil-using/fertiliser-saving) and pollution-biased technological progress when technological progress is biased towards fertiliser-using (labour-saving/fertiliser-using, capital-saving/fertiliser-using and soil-saving/fertiliser-using), and then use econometric models to explore the factors allocation structure that induce and promote green technological progress.
Thirdly, the influence mechanism of factor allocation structure on biased technological progress is an important and complicated issue. Many studies have shown that labour scarcity (Gong, Citation2018a; Qiao, Citation2017) and land scale (Gong, Citation2018a; Qiao, Citation2017) are important factors affecting the agricultural mechanisation. Qiao (Citation2017) and Gong (Citation2018a) suggest that as the wage rate increased, agricultural machinery became more widely used as an important substitute for labour input, which can reverse the current situation of intensive use of fertilisers by farmers due to insufficient labour (Wu et al., Citation2018). According to data, the mechanisation rate of China’s three major staple foods (rice, wheat and corn) will exceed 80% in 2020. In addition, Baležentis and Oude Lansink (Citation2020) believe that the expansion of land scale can also use large-scale machinery at a cost advantage, thereby reversing the bias in the use of fertilisers towards technological progress, and inducing technological advances in favour of capital (machinery) using and fertiliser saving (Ito, Citation2010; Yamauchi, Citation2016). Based on this, this paper adopts the level of mechanisation as an intermediary variable to further explore the influence mechanism of factor allocation structure on biased technological progress.
The rest of this paper is organised as follows. Section 2 introduces the research methods. Section 3 is research design, including variable setting, data source and processing, descriptive statistics, and empirical model. Section 4 presents the Malmquist and decomposition results, biased technological progress identification results, basic empirical, and mechanism test. The research conclusions and policy implications are shown in the finally.
2. Methods
2.1. Output-oriented sequential DEA
This paper uses each province as a decision module (DMU) to construct the production frontier. Assuming that each DMU uses inputs,
Where
represents the
-th province and has obtained
non-negative outputs,
At the same time, in order to eliminate the degradation of the pseudo-technology of the traditional DEA method, that is, the current output set has nothing to do with the previous feasible technology, this paper uses the method of Shestalova (Citation2003) and uses the output-oriented sequential DEA to construct the technological frontier.
(1)
(1)
where
is the weight,
and
is the first period, for which observations on inputs and outputs are available. However, the construction of the last set would require information on inputs and outputs before any time
Since this information is missing, we have to truncate set
at some
and define.
(2)
(2)
The corresponding production set will be the set Therefore, the linear program that defines the distance function relative to the sequential frontier becomes.
(3)
(3)
In this case, the optimal solution is denoted by with the constrains ensuring that
belongs to
2.2. Malmquist index and decomposition
According to Chambers et al. (Citation1996), the productivity index between -period and
-period based on output biased Malmquist Index (
) is as follows:
(4)
(4)
The MI index is further decomposed into an efficiency change index () and a technology change index (
).
(5)
(5)
(6)
(6)
(7)
(7)
and
greater than (less than) 1 represent productivity growth (decrease), technical efficiency is improved (decreased), and technological progress, if equal to 1, it means that the period from
to
is unchanged. It should be noted that
is greater than or equal to 1 except that the base period
may be less than 1.
According to the method of Fare et al. (Citation1997), neutral technology progress () and biased technology progress (
) are decomposed from technological progress (
).
(8)
(8)
(9)
(9)
(10)
(10)
The and
indexes greater than (less than) 1 indicate neutral technological progress (regression) and biased technological progress (regression). If the two indexes are equal to 1, it means that the period from
to
is unchanged.
In particular, based on the ideas of Fare et al. (Citation1997) and Li et al. (Citation2018), this paper further decomposes the biased technology progress index () into output-biased technology progress (
) and input-biased technology progress (
).
(11)
(11)
(12)
(12)
(13)
(13)
Among them, measures the effect of technological progress on different proportions of output in the case of multiple outputs. Since this paper considers only a single output,
is 1.
measures the change in the marginal substitution rate of different input factors by technological progress, indicating that the input-biased technological progress lead to further increase (greater than 1) or decrease (less than 1) in TFP on the basis of proportional savings on inputs.
Finally, the can be decomposed to the following forms.
(14)
(14)
EquationEquation (13)(13)
(13) shows that the source of TFP can be decomposed to technical efficiency (
), neutral technological progress (
), each output-biased technical progress and input-biased technical progress.
2.3. Biased technological progress identification method
Furthermore, this paper refers to the approach of Li et al. (Citation2018) to determine the factor bias and output bias of technological progress based on the changes in the factor ratios during periods and
different combinations of
Suppose that from the period to
the input has changed to technical change (biased technical change can be technical change or technological retrogression), there are two kinds of inputs
and
When
means that the biased technological progress is
using and
saving.
means that the biased technological progress is to
saving and
using. When
means that the biased technological progress is
saving and
using.
means that the biased technological progress is the
using and the
saving. The details are shown in .
3. Research design
3.1. Data and variables
The data used in this study are provincial-level agricultural outputs and inputs of 28 provinces (Eastern: Beijing, Tianjin, Hebei, Liaoning, shanghai, Jiangsu, Zhejiang, Fujian, Shandong, Guangdong. Central: Shanxi, Jiangxi, Jilin, Anhui, Heilongjiang, Henan, Hubei, Hunan, Inner Mongolia. Western: Sichuan, Guangxi, Guizhou, Yunnan, Shaanxi, Gansu, Qinghai, Ningxia, Xinjiang) in mainland China for 1981–2017. In order to keep the data consistent, Tibet is not included in this paper. Hainan was included in Guangdong, and Chongqing was included in Sichuan. Twenty-eight provinces were eventually obtained. The data comes from History of China’s Gross Domestic Product Accounting, New China’s Sixty Years of Agricultural Statistics, China Statistical Yearbook, China Agricultural Yearbook and the provincial-level statistical yearbooks. This paper follows the traditional literature (e.g., Gong, Citation2018a, Citation2018b, Citation2020) in selecting inputs and outputs.
3.1.1. Input and output variables
The output variable is the gross value of agricultural output () and deflated by the 1978 primary industry output value price index.
is measured as the size of the labour force (in millions) in the agriculture.
is agricultural capital stock, but as the existing statistical data does not provide agricultural capital stock data, this paper refers to the practices of Fei and Lin (Citation2016) and Zha et al. (Citation2017) uses the perpetual inventory method to calculate agricultural capital stock,
The investment
in that year was measured by the gross fixed capital formation of the primary industry. The base period capital stock refers to the method of Zha et al. (Citation2017) and is calculated using
where
is the capital depreciation rate and is set to 5% according to Dekle and Vandenbroucke (Citation2010) and Cao and Birchenall (Citation2013),
is the geometric average growth rate of real agricultural output value from 1978 to 2017. As for the investment price index, the existing statistics do not provide the agricultural investment price index. For this purpose, the price index of agricultural means of production is used to convert the capital stock into a capital stock calculated at a constant price in 1978.
refers to the sown area (in million hectares) reflecting the actual utilisation of the cultivated soil.
refers to the sum of the gross weight of nitrogen, phosphate, potash and complex fertiliser (in million tons).
3.1.2. Empirical variables
The dependent variables.
is the input-biased technology progress index, and
represents the logarithm.
is the dummy variable matrix of green technological progress. According to the aforementioned method of identifying the direction of technological progress, if technological progress is labour-using/fertiliser-saving, then
otherwise 0. If technological progress is capital-using/fertiliser-saving, then
If the technological progress is soil-using/fertiliser-saving, then
otherwise 0.
is the dummy variable matrix of pollution technological progress. If the technological progress is fertiliser-using/labour-saving,
otherwise it is 0. If technological progress is fertiliser-using/capital-saving, then
If the technological progress is fertiliser-using/soil-saving, then
otherwise it is 0.
Independent variables. The labour/capital allocation structure () is expressed as the ratio of labour to capital. The labour/soil allocation structure (
) is expressed as the ratio of labour to soil. Labour/fertiliser allocation structure (
) is expressed as the ratio of labour to fertiliser. Capital/soil allocation structure (
) is expressed as the ratio of capital to soil. Capital/fertiliser allocation structure (
) is expressed as the ratio of capital to fertiliser. Soil/fertiliser allocation structure (
) is expressed as the ratio of soil to fertiliser.
Control variables. In recent years, China’s agricultural structure has undergone tremendous changes. The planting area of staple food crops (rice, wheat and corn) that use more fertilisers has declined, and some areas have even been encouraged to return farmland to forests. Thus, the adverse effects of agricultural production on the environment can be alleviated. This paper refers to Skokanová et al. (Citation2020) use the ratio of the crop area to the area of arable land to express the agricultural structure (). Existing studies generally use per capita GDP to represent the level of regional economic development and suggest that the regions with higher level of economic development will have great advatages in inputting elements of agricultural production, such as capital, agricultural science & technology and management policies of cultivated land, thus improving the conditions of agricultural production (Kuang et al., Citation2020; McGowan & Vasilakis, Citation2019). Based on this, this paper uses the per capita agricultural output value (
) to express the level of agricultural development in a country, and believes that the higher the level of agricultural development, the more favourable it is to technological progress. It is generally believed that modern agriculture is fed back by industry, and the continued high yield of agriculture depends on the continuous input of industry. However, countries with a high degree of agriculturalisation lack the input of modern production factors (agricultural machinery, fertilisers, pesticides and grains), which is not conducive to the progress of agricultural technology. This paper refers to Gong (Citation2018b) and Xiang et al. (Citation2020) use the value-added share of agriculture in GDP to express the agricultural level (
). Per capita income reflects to some extent the ability of farmers to pay for environmental protection facilities. This paper refers to Xiang et al. (Citation2020) use the per capita net income of rural residents to express the per capita income of rural residents (
). According to Hicks (Citation1932), relative price changes are the direct cause of biased technological progress. This paper uses the ratio of the rural consume price index to the agricultural data price index to express the relative price change (
). Descriptive statistics of variables are shown in .
3.2. Empirical model
In order to clarify the optimal factor allocation structure to promote agricultural green technology progress and pollution control technology progress, this paper sets formula (15).
(15)
(15)
where
is the time, and
is the
-th province,
and
are the parameters to be estimated,
represent the province, the time-fixed effect and the residual error.
4. Empirical results
4.1. Malmquist index and decomposition results
Based on the aforementioned methods and data, this paper measures China’s agricultural TFP growth index from 1981 to 2017, and decomposes its sources, as shown in and .
Figure 1. Changing of the Malmquist, EFFCH, TECH and MTECH across time.
Source: the author based on the original data and empirical results.
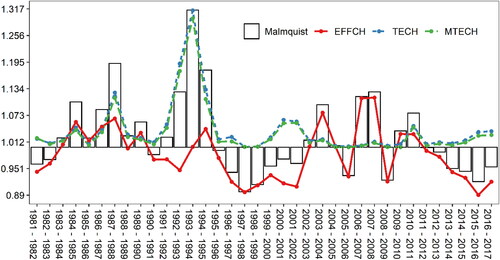
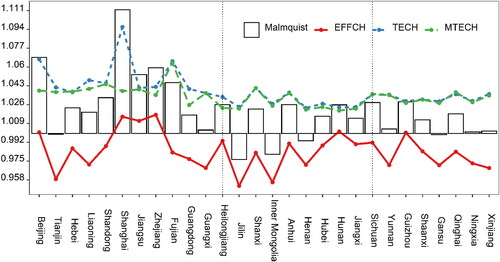
Figure 2. Changing of the average Malmquist, EFFCH, TECH and MTECH across provinces.
Source: the author based on the original data and empirical results.
It can be seen from that from 1981 to 2017, China’s agricultural TFP showed an increasing trend in most years. Specifically, 1981–1994 was a stage of accelerated growth. On the one hand, the continuous increase in technological efficiency (EFFCH) and technological progress (TECH) from 1981 to 1988 jointly driven the TFP growth. On the other hand, despite the continuous deterioration of EFFCH in 1989–1994, the rate of TECH has been significantly accelerated, thereby pushing the TFP growth index to its peak in 1994. 1995–2002 and 2012–2017 was the decay phase. The main reason is that the technical efficiency has deteriorated significantly and the speed of TECH has slowed down, which has led to a negative growth in the TFP growth index. From 2003 to 2011, it was a volatile phase. During this period, the TECH index approached 0, and the technical efficiency showed a large fluctuation state, which also caused the TFP index to show severe fluctuations. The reasons are mainly from two aspects: Firstly, this paper adopts serial DEA. This method does not allow technological decline and regards TECH as a stable process; thus, all the reasons for the decline in TFP growth index and severe fluctuations are attributed to insufficient technical efficiency and changes (Shestalova, Citation2003). Secondly, many studies have shown that the insufficient promotion of agricultural technology in China and the small-scale and fragmented agricultural soil management pattern are the primary factors that cause inefficient technology and hinder the growth of TFP (Brümmer et al., Citation2006; Wu et al., Citation2018).
In addition, it is worth noting that the neutral technological progress (MTECH) almost coincides with the TECH, indicating that China’s agricultural technological progress is dominated by neutral technological progress, and the contribution of biased technology is minimal. Therefore, in the follow-up research, this paper focuses only on the analysis of factors biased by technological progress rather than their contribution to TFP growth.
As can be seen in , except for Tianjin, Jilin, Inner Mongolia, Henan and Gansu from 1981 to 2017, the Malmquist index of most provinces is greater than 1, and mainly from TECH. Eastern provinces have the fastest TFP growth, with Shanghai ranking highest. However, it is worth noting that the gap between TECH and MTECH is relatively large, indicating that a large part of the driving force for the TFP growth in Shanghai comes from biased technological progress. In the central and western provinces, except Hunan and Guizhou, the EFFCH of the remaining provinces is less than 1, indicating that low EFFCH is the main factor hindering the TFP growth of. Moreover, TECH and MTECH almost completely overlap, indicating that MTECH is the main source of TFP growth.
4.2. Biased technological progress identification results
shows the results of the agricultural technology progress direction from 1981 to 2017. Except the base period (1982), the input-biased technological progress index (IBTECH) was greater than 1, indicating that input-biased technological progress has contributed to the long-term growth of agricultural TFP.
Table 3. The agricultural technology progress direction from 1981 to 2017.
Comparing labour and capital, except for the technological progress several years, it is biased towards labour-using/capital-saving, and the rest of the period is biased towards labour-saving/capital-using. This shows that under the situation of rising labour costs, agricultural production also tends to replace labour through capital, and the ‘capitalisation’ trend in agriculture is very obvious. Comparing labour and soil, these two inputs are competitive in technological progress, which is manifested by a period of labour-using/soil-saving technology progress, and then turned to labour-saving/soil-using technological progress. Comparing labour and fertiliser, the overall preference is for labour-saving/fertiliser-using technological progress. In the context of accelerated labour force transfer to non-agricultural employment, farmers tend to apply more fertiliser instead of labour (Li et al., Citation2018; Wang et al., Citation2019). Comparing capital and land, most years show capital use/land saving. It shows that under small-scale and fine-grained agricultural conditions, increasing investment in capital goods such as irrigation facilities, machinery and greenhouses has become a feasible path to promote the growth of agricultural productivity. In terms of capital and fertiliser comparison, it can be roughly divided into capital-saving/fertiliser-using technology progress stages and capital-using/fertiliser-saving stage. This shows that the contribution of fertiliser to agricultural growth can be replaced by increasing capital investment, which is beneficial to the improvement of the ecological environment. Comparing soil and fertiliser, except for 1982, 2015 and 2016, which showed technical progress in soil-using/fertiliser-saving, the remaining years were technical progress in soil-saving/fertiliser-using.
To sum up, under the special agricultural conditions in China, fertiliser and capital together constitute a source of factors that promote the continuous growth of agricultural TFP. Excessive use of fertiliser will cause serious agricultural non-point source pollution (McArthur & McCord, Citation2017), but it is possible to suppress the use of fertiliser through capital-using biased technological progress (Ito, Citation2010).
shows the results of agricultural technology progress direction from 1981 to 2017. From the perspective of input-biased technological progress index, except for Hebei and Qinghai, which are smaller than 1, the other provinces are all greater than 1, indicating that input-biased technological progress contributes to the improvement of agricultural TFP in most provinces in China, and From the perspective of the factors of technological progress, China’s agriculture is mainly manifested in a variety of technological progress such as capital-using, fertiliser-using, soil-using and labour-saving.
Table 4. Results of agricultural technology progress direction by region from 1981 to 2017.
In the comparison of labour and capital, only Hebei and Qinghai are biased towards technological progress in labour-using/capital-saving, and other provinces are technological progress in labour-saving/capital-using. In the comparison of labour and soil, the eastern, central and western regions all show labour-saving/soil-using technological progress, but in terms of the proportion of each region, it is expressed as . In the comparison of labour and fertiliser, capital and soil, except for Hebei and Qinghai, the other provinces are labour-saving/fertiliser-using technology progress, and capital-using/soil-saving. In the comparison of capital and fertiliser, Hebei, Guizhou and Qinghai show capital-saving/fertiliser-using, and the remaining provinces show capital-using/fertiliser-saving. From the comparison of soil and fertiliser pairs, Hebei, Shanghai and Qinghai show soil-using/fertiliser-saving, and the remaining provinces are soil-using/fertiliser-saving.
Judging from the biased ranking of technological progress factors, Hebei and Qinghai have biased technological progress more towards labour-using, soil-using, fertiliser-using and capital-saving (), and Yunnan and Guizhou have biased technological progress more towards fertiliser-using, capital-using, soil-using and labour-saving (
). In addition, the remaining provinces favour capital-using, fertiliser-using, labour-using, and soil-saving (
), or capital-using, fertiliser-using, soil-using, and labour-saving (
).
4.3. Benchmark regress results
The first step for the investigation of causality is to determine whether the series has any integration orders. For this purpose, this paper first carries out a panel unit root test for each variable. At present, the panel unit root test method is mainly divided into two types. One is the same unit root test based on Levin et al. (Citation2002) (LLC test), Breitung and Das (Citation2005) (Breitung test) and Hadri and Larsson (Citation2005) (Hadri test) tests. The other is unit root test based on Im et al. (Citation2003) (IPS test) and Choi (Citation2001) (Fisher). For the sake of robustness, this paper conducts four panel unit root tests for LLC, Breitung, Fisher and IPS. The results are reported in . It can be seen from the table that all variables have passed the significance test at least at the 5% level, which indicates that all variables are stationary series.
Table 5. Panel unit root tests results.
In addition, according to the cointegration test of panel data Persyn and Westerlund (Citation2008), the results () show that all statistics reject the null hypothesis at the 1% significance level. It is indicating that there is a stable cointegration relationship between the dependent variable and the independent variable.
Table 6. Panel cointegration tests results.
shows the regression results of this paper. Among them, model (1) is the benchmark regression result of this paper, and the dependent variables of model (2)–model (4) are green-biased technological progress (labour-using/fertiliser-saving, capital-using/fertiliser-saving and soil-using/fertiliser-saving). The dependent variable of model (5)–model (7) are pollution-biased technological progress (labour-saving/fertiliser-using, capital-saving/fertiliser-using and soil-saving/fertiliser-using).
Table 7. Benchmark regress results.
It can be known from (1) that, except that the coefficient of is significantly negative, the effects of other factor mix on the biased technological progress index are all promoting effects. It shows that in the allocation of labour and fertiliser, it is necessary to relatively reduce labour or increase the input of fertiliser in order to promote biased technological progress. The coefficients of
and
are significantly positive, and although the coefficients of
and
are also positive, they are not significant at a significance level of 10%. This shows that it is necessary to optimise the combination of factors selectively. Among them, increasing the labour/capital ratio, labour/soil ratio and soil/fertiliser ratio will help promote biased technological progress.
The coefficients of are significant only in (3) and (4) and are positive. It shows that a relative increase in labour or a relative reduction in capital will help promote capital-using/fertiliser-saving and soil-using/fertiliser-saving. It is generally suggested that there is a substitute relationship between labour and fertilisers. When labour is shortage, in order to maintain food production, farmers often tend to add more fertiliser per unit area of soil to make up for the lack of labour input (Liu et al., Citation2014; Wang et al., Citation2019), which further induces agricultural technology progress towards the fertiliser-using, aggravating agricultural non-point source pollution (Xiang et al., Citation2020). On the contrary, increasing the labour capital ratio will promote fertiliser-saving technological progress. The
and
coefficients are significantly positive in (2)–(4) and (6), but the coefficients in (6) are relatively small. It shows that increasing the labour on the unit soil will significantly promote green-biased technological progress, but at the same time, it will also bring slight capital-saving-/fertiliser-using biased technological progress. This is because, although increasing labour is conducive to green technological progress (fertiliser-saving), if the soil input is not increased accordingly, then due to insufficient soil scale, farmers tend to apply a lot of fertiliser (Wu et al., Citation2018). Similarly, if other factors remain unchanged and simply increase soil, although it is conducive to green technological progress, it will also cause relative abuse of fertilisers due to insufficient labour and capital input. The coefficients of
are just the opposite. In (2)–(4) and (6), they are significant negative effects. It shows that although a relative increase in labour or a relative reduction in fertiliser input can curb capital-saving/fertiliser-using pollution-biased technological progress, it also inevitably causes a decline in green technology. More complicated is that the coefficients of
are significantly positive in (2) and significantly negative in (4), indicating that although a relative increase in capital or a relative reduction in soil is beneficial to labour-using/fertiliser-saving that is green-biased technological progress. But at the same time, soil-using/fertiliser-saving green-biased technology will decline due to soil reduction. In addition, the coefficients of
are also very significant in (5)–(7), indicating that increasing the ratio of capital to soil will lead to more serious pollution-biased technological progress. That is to say, there is no substitution relationship between capital and soil. The relationship between the two is more likely to be a complementary relationship; that is, adding a certain amount of soil will inevitably increase a certain proportion of capital investment, so as to be able to simply play the role of promoting the progress of green technology. The coefficients of
are significantly positive in (3)–(4) and significantly negative in (5)–(7). It shows that increasing the ratio of capital to fertiliser can not only increase the green bias towards technological progress, but also suppress the pollution bias towards technological progress. This is because perfect irrigation facilities can dilute fertilisers and help crops absorb nutrients (Singh & Narayanan, Citation2015). At the same time, the use of large machinery can return crop waste to the field, which is a green technological advancement.
4.4. Further anaylsis: mechanism test
In order to further explore the influence mechanism of factor allocation structure on biased technological progress. This paper refers to Qiao (Citation2017) using the natural logarithm of the total power of agricultural machinery to express the level of mechanisation and uses this as an intermediate variable. The results are shown in .
Table 8. Mechanism test results.
In (8)–(14), the coefficients of the element placement results are consistent with those in in direction and significance, but there are differences in size. This shows that the added intermediary variable () has a disturbing effect on the effect of the factor configuration variable, but this disturbance is relatively small. Specifically, the coefficients of
are only significant in (8), (10) and (11), but they are negative. This means that agricultural mechanisation is not only detrimental to biased technological progress, but also restrains technological progress from favouring fertiliser-saving. In (15), any relative increase in the share of labour input will lead to a decrease in the level of mechanisation, which is consistent with the conclusion of most studies, that is, there is a substitution relationship between machinery and labour (Baležentis & Oude Lansink, Citation2020; Gong, Citation2018a; Ito, Citation2010; Qiao, Citation2017). In addition, from the influence coefficient of
and
on
it can be seen that a relative increase in the share of soil input will promote the rise of the level of mechanisation.
This shows that increasing the share of labour input relative to capital and soil cannot only directly promote biased technological progress and green technological progress, but also can play an indirect role by reducing the level of mechanisation. Increasing the share of soil input relative to capital and fertilisers can directly promote biased technological progress and green technological progress, and inhibit technological progress in the use of fertilisers, but it will indirectly inhibit biased technological progress and green technological progress by increasing the level of mechanisation.
5. Conclusions and policy implications
This paper uses the output-oriented sequential DEA method and the Malmquist index to measure and characterise China’s agricultural TFP growth trend and its source contribution from 1981 to 2017, and further identifies the input-biased technological progress based on this. Then, this paper divides technological progress into green-biased technological progress when technological progress is biased towards fertiliser-saving (labour-using/fertiliser-saving, capital-using/fertiliser-saving and soil-using/fertiliser-saving) and pollution-biased technological progress when technological progress is biased towards fertiliser-using (labour-saving/fertiliser-using, capital-saving/fertiliser-using and soil-saving/fertiliser-using), and then use econometric models to explore the factors allocation structure that induce and promote green technological progress. The research conclusions of this paper can be summarised as follows.
China’s agricultural TFP has undergone three stages of accelerated growth, negative growth and fluctuation; the growth momentum has undergone three transformations, which are jointly driven by technological efficiency and technological progress, dominated by technological progress and dominated by technological efficiency. In the first stage, it is not only a stage of accelerating the growth of agricultural TFP, but also a stage where technical efficiency and technological progress are jointly driven. The possible reason is that the Chinese government formally implemented the Household Responsibility Contract System nationwide in 1978, and the reform dividends brought about by it helped boost the growth of China’s agricultural TFP. In the second stage, agricultural TFP entered a period of decline, mainly due to the deterioration of technological progress and technological efficiency, but mainly dominated by technological progress. This paper suggests that the reasons may come from these aspects. Firstly, the first-stage reform dividend has been fully released, and agricultural production has entered a new round of adjustment period (Gong, Citation2018a). Secondly, farmers began to move away from the soil to the coast to engage in non-agricultural work. In addition, the small-scale and decentralised operation of agricultural soil is not suitable for mechanised farming, resulting in insufficient investment in agricultural production and hindering the further improvement of agricultural productivity. Finally, for a long time, China’s agricultural growth has mainly been at the expense of the ecological environment, which has resulted in insufficient motivation for the subsequent development of agriculture. In the third stage, China’s agricultural TFP growth index entered a long-term period of fluctuation, mainly caused by fluctuations in technical efficiency. On the one hand, China’s industrialisation and urbanisation have further deepened. A large amount of high-quality arable soil has been replaced with industrial and construction soil, farmers have accelerated their separation from agricultural production, and the small-scale and decentralised situation of agricultural soil has not been fundamentally improved. As a result, the superposition of many unfavourable factors hinders the further improvement of agricultural TFP. On the other hand, agriculture, as the foundation of the development of the national economy, is highly valued by the Chinese government and has given preferential treatment in terms of policies, which also contributes to the improvement of the agricultural productivity growth index. The see-saw of the above resistance and help eventually caused China’s agricultural TFP growth index to enter a long-term state of fluctuation.
Factor-biased technological progress has contributed to the long-term growth of agricultural TFP in most areas of China, but it is mainly biased towards capital use and fertiliser use. As we all know, China’s arable soil resources are relatively scarce. To ensure food production, farmers tend to apply more fertilisers per unit area to make up for the lack of soil input. In addition, under the background of accelerating labour transfer to non-agricultural employment, on the one hand, farmers tend to use more fertilisers to replace labour, and the larger the labour transfer scale, the more fertilisers are used (Li et al., Citation2018; Wang et al., Citation2019). On the other hand, in recent years, China has carried out a series of arable soil reconstruction plans, which converts uneven soil with a slope of less than 15 degrees into soil suitable for mechanical farming. This is conducive to the substitution of machinery for labour, making agricultural technological progress biased towards the use of capital. It is worth noting that the contribution of biased technological progress to the TFP of agriculture is regionally heterogeneous, presenting the eastern > central > western. The reason mainly comes from the following two aspects. Firstly, compared with the west, the eastern and central soil is relatively flat and suitable for input of technological elements. Secondly, both the economic development level and the level of science and technology in the east are significantly higher than those in the central and western regions, thus condensing more technological content in the production factors.
The empirical results show that optimising the allocation structure of factors is conducive to promoting biased technological progress. Specifically, increasing the ratio of labour/capital, labour/soil, soil/fertiliser and lowering the ratio of labour/fertiliser are conducive to promoting biased technological progress. This means that relative to capital and soil, the share of labour factors should be increased, and relative to fertiliser, the share of labour factors should be reduced. Firstly, a large number of rural labourers in China have been transferred to non-agricultural sectors. This process is conducive to improving man-soil relations. However, considering the existence of the household contract responsibility system, even farmers who go to work in cities will still retain their soil and part-time agricultural production activities, resulting in relatively scarce labour (Gong, Citation2018a; Wang et al., Citation2019). Secondly, the status quo of small-scale, decentralised and fragmented agricultural operations in China makes it difficult to use mechanical (capital) input (Ito, Citation2010; Liu et al., Citation2014), and therefore requires increased labour input. Thirdly, under the dual constraints of labour loss and the inability to expand the scale of soil, farmers are more inclined to use fertilisers to replace relatively insufficient labour and soil in order to save time and cost and ensure food production (Wang et al., Citation2019). In addition, in order to induce and enhance green preference for technological progress (fertiliser-saving), the ratio of labour/capital, labour/soil, capital/fertiliser and soil/fertiliser should be increased, and the ratio of labour/fertiliser and capital/soil should be reduced. However, if the purpose is to curb pollution-biased technological progress (fertiliser-using), the ratio of labour/capital, labour/fertiliser and capital/fertiliser should be increased, while the ratio of labour/soil, capital/soil and soil/fertiliser should be reduced. This shows that increasing the ratio of labour/capital and capital/fertiliser, and reducing the ratio of capital/soil, can induce and promote green-biased technological progress while suppressing pollution-biased technological progress. Recently, the Chinese government has paid more and more attention to investment in rural infrastructure (irrigation, power facilities and roads). Barbier (Citation2020) suggested that a sound agricultural infrastructure is conducive to the absorption of nutrients such as fertilisers, thereby reducing non-point source pollution. However, compared with capital investment, labour and land investment are still insufficient. Only by relatively increasing labour and land investment and realising refined and large-scale management can it induce and strengthen green-biased technological progress and curb pollution-biased technological progress.
The mechanism test results show that increasing the labour input share relative to capital and soil cannot only directly promote biased technological progress and green technological progress, but also can play an indirect role by reducing the level of mechanisation. Increasing the share of soil input relative to capital and fertilisers can directly promote biased technological progress and green technological progress, and inhibit technological progress in the use of fertilisers, but it will indirectly inhibit biased technological progress and green technological progress by increasing the level of mechanisation. This may be because, on the one hand, although rural labour is transferred to the non-agricultural sector, the scale of soil has not been transferred and concentrated simultaneously. As a result, the agricultural machinery is too small, the operation efficiency is low and it cannot fundamentally stimulate the progress of fertiliser conservation technology. On the other hand, the expansion of the soil scale is undoubtedly beneficial to the use of large-scale machinery, but if the necessary labour is not increased while the soil is expanded, resulting in a lack of management of agricultural production, it will also cause the abuse of polluting elements such as fertilisers.
The above research conclusions imply corresponding policy enlightenment. Firstly, strengthening agricultural green technology innovation and extension. Most of China’s agricultural technology innovation and promotion are based on fertiliser and pesticide technologies (Ito, Citation2010). Although it helps to increase food production, it also causes severe environmental pollution (Expósito & Velasco, Citation2020; McArthur & McCord, Citation2017; Xiang et al., Citation2020), which limits the sustainable development potential of China’s agriculture. Therefore, the Chinese government should play a leading role in agricultural green innovation. On the one hand, encourage scientific research institutions to pay more attention to the impact of technology on the environment in agricultural technology research and development, and promote green technology innovation. On the other hand, strengthen scientific fertilisation propaganda and technical guidance, and popularise soil testing formula technology. In 2005, the Ministry of Finance of China arranged a special subsidy of 200 million yuan to conduct pilot soil tests and formula fertilisation in 200 major grain-producing counties across the country, which increased the fertiliser utilisation rate by 3% to 5% (http://news.sohu.com/20050917/n226983689.shtml). Secondly, the flow of agricultural land and large-scale operations should be encouraged. More people and less soil are China’s basic national conditions, but with the rapid advancement of urbanisation and industrialisation, a large number of surplus rural labour forces have been transferred to cities and non-agricultural sectors, thus providing a feasible space for improving the contradiction between man and soil. The Chinese government should seise this opportunity. On the one hand, it will promote the integrated development of urban and rural areas, and realise the local employment and entrepreneurship of migrant workers, so as to provide farmers with income while further transferring rural surplus labour. On the other hand, large farm farmers and experts are encouraged to contract idle soil, promote the concentration of agricultural soil transfer and realise soil scale management. Thirdly, increasing subsidies for small and medium-sized agricultural machinery. The expansion of the soil scale is conducive to the use of large machinery, thereby reducing the use of fertiliser and pesticide while making up for the labour shortage, but the concentration of soil transfer is difficult to complete in a short time, and small-scale operations will still be the basic status quo of agricultural operations in China (Liu et al., Citation2014). Therefore, the Chinese government can promote technological progress-biased machinery by increasing subsidies for small- and medium-sised agricultural machinery and developing the market for agricultural machinery services.
This paper may have the following limitations and directions for further research in the future. Firstly, in terms of methods, this paper uses the serial DEA and Malmquist index to measure and identify the direction of China’s agricultural technology progress. However, the productivity of specific production factors cannot be decomposed, so that it is impossible to judge whether factor-biased technological progress is also factor-enhanced technological progress. In the future, it can be explored to decompose the productivity of specific production factors from nonparametric methods. Secondly, in the research sample, this study uses regional aggregate data, which can directly reflect the temporal and spatial differences of agricultural biased technological progress. However, the aggregated data will smooth out the differences in farmers’ preference for production factors, and it is difficult to reveal the micro-mechanisms that induce technological progress. In the future, sample data at the level of farmers or agricultural products can be used to in-depth explore the micro-mechanism that induces technological progress.
Acknowledgements
The authors are grateful to the anonymous referees who provided valuable comments and suggestions to significantly improve the quality of the paper.
Disclosure statement
No potential conflict of interest was reported by the authors.
Table 1. Input mix and input bias towards technological progress.
Table 2. Descriptive statistics of variables.
Additional information
Funding
References
- Acemoglu, D., Aghion, P., Bursztyn, L., & Hemous, D. (2012). The environment and directed technical change. American Economic Review, 102. https://doi.org/https://doi.org/10.2139/ssrn.1668575
- Ahmad, S. (1966). On the theory of induced invention. The Economic Journal, 76(302), 344. https://doi.org/https://doi.org/10.2307/2229720
- Antonelli, C., & Quatraro, F. (2010). The effects of biased technological change on total factor productivity: Empirical evidence from a sample of OECD countries. The Journal of Technology Transfer, 35(4), 361–383. https://doi.org/10.1007/s10961-009-9134-2
- Bailey, A., Irz, X., & Balcombe, K. (2004). Measuring productivity growth when technological change is biased—A new index and an application to UK agriculture. Agricultural Economics, 31(2–3), 285–295. https://doi.org/https://doi.org/10.1016/j.agecon.2004.09.020
- Baležentis, T., & Oude Lansink, A. (2020). Measuring dynamic biased technical change in Lithuanian cereal farms. Agribusiness, 36(2), 208–218. https://doi.org/https://doi.org/10.1002/agr.21623
- Barbier, E. B. (2020). Is green rural transformation possible in developing countries? World Development, 131, 104955. https://doi.org/https://doi.org/10.1016/j.worlddev.2020.104955
- Binswanger, H. (1974). The measurement of technical change biases with many factors of production. American Economic Review, 64(6), 964–976. http://www.jstor.org/stable/1815245.
- Brümmer, B., Glauben, T., & Lu, W. (2006). Policy reform and productivity change in Chinese agriculture: A distance function approach. Journal of Development Economics, 81(1), 61–79. https://doi.org/https://doi.org/10.1016/j.jdeveco.2005.04.009
- Breitung, J., & Das, S. (2005). Panel unit root tests under cross sectional dependence. Statistica Neerlandica, 59(4), 414–433. https://doi.org/https://doi.org/10.1111/j.1467-9574.2005.00299.x
- Briec, W., Peypoch, N., & Ratsimbanierana, H. (2011). Productivity growth and biased technological change in hydroelectric dams. Energy Economics, 33(5), 853–858. https://doi.org/https://doi.org/10.1016/j.eneco.2011.01.011
- Cao, K. H., & Birchenall, J. A. (2013). Agricultural productivity, structural change, and economic growth in post-reform China. Journal of Development Economics, 104, 165–180. https://doi.org/https://doi.org/10.1016/j.jdeveco.2013.06.001
- Chambers, R. G., Fāure, R., & Grosskopf, S. (1996). Productivity growth in Apec countries. Pacific Economic Review, 1(3), 181–190. https://doi.org/https://doi.org/10.1111/j.1468-0106.1996.tb00184.x
- Choi, I. (2001). Unit root tests for panel data. Journal of International Money and Finance, 20(2), 249–272. https://doi.org/https://doi.org/10.1016/S0261-5606(00)00048-6
- Dekle, R., & Vandenbroucke, G. (2010). Whither Chinese growth? A sectoral growth accounting approach. Review of Development Economics, 14(3), 487–498. https://doi.org/https://doi.org/10.1111/j.1467-9361.2010.00566.x
- Expósito, A., & Velasco, F. (2020). Exploring environmental efficiency of the European agricultural sector in the use of mineral fertilizers. Journal of Cleaner Production, 253, 119971. https://doi.org/https://doi.org/10.1016/j.jclepro.2020.119971
- Fare, R., Grifell-Tatje, E., Grosskopf, S., & Lovell, C. A. K. (1997). Biased technical change and the Malmquist productivity index. The Scandinavian Journal of Economics, 99(1), 119–127. https://doi.org/https://doi.org/10.1111/1467-9442.00051
- Fei, R., & Lin, B. (2016). Energy efficiency and production technology heterogeneity in China's agricultural sector: A meta-frontier approach. Technological Forecasting and Social Change, 109, 25–34. https://doi.org/https://doi.org/10.1016/j.techfore.2016.05.012
- Gong, B. (2018a). Agricultural reforms and production in China: Changes in provincial production function and productivity in 1978–2015. Journal of Development Economics, 132, 18–31. https://doi.org/https://doi.org/10.1016/j.jdeveco.2017.12.005
- Gong, B. (2018b). The impact of public expenditure and international trade on agricultural productivity in China. Emerging Markets Finance and Trade, 54(15), 3438–3453. https://doi.org/https://doi.org/10.1080/1540496X.2018.1437542
- Gong, B. (2020). Agricultural productivity convergence in China. China Economic Review, 60, 101423. https://doi.org/https://doi.org/10.1016/j.chieco.2020.101423
- Hadri, K., & Larsson, R. (2005). Testing for stationarity in heterogeneous panel data where the time dimension is finite. The Econometrics Journal, 8(1), 55–69. https://doi.org/https://doi.org/10.1111/j.1368-423X.2005.00151.x
- Hayami, Y., & Ruttan, V. W. (1970). Factor prices and technical change in agricultural development: The United States and Japan, 1880-1960. Journal of Political Economy, 78(5), 1115–1141. https://doi.org/https://doi.org/10.1086/259694
- Hayami, Y., & Ruttan, V. W. (1985). Agricultural development: An international perspective. Economic Development & Cultural Change, 33(2), 123–141. https://doi.org/https://doi.org/10.2307/1242686
- Hicks, J. (1932). The theory of wages. London: Palgrave Macmillan. https://doi.org/https://doi.org/10.1007/978-1-349-00189-7
- Im, K. S., Pesaran, M. H., & Shin, Y. (2003). Testing for unit roots in heterogeneous panels. Journal of Econometrics, 115(1), 53–74. https://doi.org/https://doi.org/10.1016/S0304-4076(03)00092-7
- Ito, J. (2010). Inter-regional difference of agricultural productivity in China: Distinction between biochemical and machinery technology. China Economic Review, 21(3), 394–410. https://doi.org/https://doi.org/10.1016/j.chieco.2010.03.002
- Karanfil, F., & Yeddir-Tamsamani, Y. (2010). Is technological change biased toward energy? A multi-sectoral analysis for the French economy. Energy Policy, 38(4), 1842–1850. https://doi.org/https://doi.org/10.1016/j.enpol.2009.11.061
- Klump, R., & Cabrera, C. M. (2008). Biased technological change in agriculture: The Hayami-Ruttan Hypothesis Revisited. In DEGIT Conference Papers. Dynamics, Economic Growth, and International Trade.
- Kuang, B., Lu, X., Zhou, M., & Chen, D. (2020). Provincial cultivated land use efficiency in China: Empirical analysis based on the SBM-DEA model with carbon emissions considered. Technological Forecasting and Social Change, 151, 119874–119872. https://doi.org/https://doi.org/10.1016/j.techfore.2019.119874
- Levin, A., Lin, C.-F., & James Chu, C.-S. (2002). Unit root tests in panel data: Asymptotic and finite-sample properties. Journal of Econometrics, 108(1), 1–24. https://doi.org/https://doi.org/10.1016/S0304-4076(01)00098-7
- Li, J., Rodriguez, D., & Tang, X. (2017). Effects of land lease policy on changes in land use, mechanization and agricultural pollution. Land Use Policy, 64, 405–413. https://doi.org/https://doi.org/10.1016/j.landusepol.2017.03.008
- Li, T., Baležentis, T., Cao, L., Zhu, J., Štreimikienė, D., & Melnikienė, R. (2018). Technical change directions of China’s grain production: Application of the bias-corrected Malmquist indices. Technological and Economic Development of Economy, 24(5), 2065–2082. https://doi.org/https://doi.org/10.3846/20294913.2017.1352050
- Liu, Y., Hu, W., Jetté-Nantel, S., & Tian, Z. (2014). The influence of labor price change on agricultural machinery usage in Chinese agriculture. Canadian Journal of Agricultural Economics/Revue Canadienne D'agroeconomie, 62(2), 219–243. https://doi.org/https://doi.org/10.1111/cjag.12024
- Managi, S., & Karemera, D. (2004). Input and output biased technological change in US agriculture. Applied Economics Letters, 11(5), 283–286. https://doi.org/https://doi.org/10.1080/1350485042000221526
- McArthur, J. W., & McCord, G. C. (2017). Fertilizing growth: Agricultural inputs and their effects in economic development. Journal of Development Economics, 127, 133–152. https://doi.org/https://doi.org/10.1016/j.jdeveco.2017.02.007
- McGowan, D., & Vasilakis, C. (2019). Reap what you sow: Agricultural technology, urbanization and structural change. Research Policy, 48(9), 103794. https://doi.org/https://doi.org/10.1016/j.respol.2019.05.003
- Persyn, D., & Westerlund, J. (2008). Error-correction–based cointegration tests for panel data. The Stata Journal: Promoting Communications on Statistics and Stata, 8(2), 232–241. https://doi.org/https://doi.org/10.1177/1536867X0800800205
- Qiao, F. (2017). Increasing wage, mechanization, and agriculture production in China. China Economic Review, 46, 249–260. https://doi.org/https://doi.org/10.1016/j.chieco.2017.10.002
- Savcı, S. (2012). An agricultural pollutant: Chemical fertilizer. International Journal of Environmental Science and Development, 73–80. https://doi.org/https://doi.org/10.7763/IJESD.2012.V3.191
- Shao, S., Luan, R., Yang, Z., & Li, C. (2016). Does directed technological change get greener: Empirical evidence from Shanghai's industrial green development transformation. Ecological Indicators, 69, 758–770. https://doi.org/https://doi.org/10.1016/j.ecolind.2016.04.050
- Shestalova, V. (2003). Sequential Malmquist indices of productivity growth: An application to OECD industrial activities. Journal of Productivity Analysis, 19(2/3), 211–226. https://doi.org/https://doi.org/10.1023/A:1022857501478
- Singh, A. P., & Narayanan, K. (2015). Impact of economic growth and population on agrochemical use: Evidence from post-liberalization India. Environment, Development and Sustainability, 17(6), 1509–1525. https://doi.org/https://doi.org/10.1007/s10668-015-9618-1
- Skokanová, H., Netopil, P., Havlíček, M., & Šarapatka, B. (2020). The role of traditional agricultural landscape structures in changes to green infrastructure connectivity. Agriculture, Ecosystems & Environment, 302, 107071. https://doi.org/https://doi.org/10.1016/j.agee.2020.107071
- Song, M., & Wang, S. (2016). Can employment structure promote environment-biased technical progress? Technological Forecasting and Social Change, 112, 285–292. https://doi.org/https://doi.org/10.1016/j.techfore.2016.02.016
- Wang, X., Shao, S., & Li, L. (2019). Agricultural inputs, urbanization, and urban-rural income disparity: Evidence from China. China Economic Review, 55, 67–84. https://doi.org/https://doi.org/10.1016/j.chieco.2019.03.009
- Wu, Y., Xi, X., Tang, X., Luo, D., Gu, B., Lam, S. K., Vitousek, P. M., & Chen, D. (2018). Policy distortions, farm size, and the overuse of agricultural chemicals in China. Proceedings of the National Academy of Sciences, 115(27), 7010–7015. https://doi.org/https://doi.org/10.1073/pnas.1806645115
- Xiang, T., Malik, T. H., & Nielsen, K. (2020). The impact of population pressure on global fertiliser use intensity, 1970–2011: An analysis of policy-induced mediation. Technological Forecasting and Social Change, 152, 119895. https://doi.org/https://doi.org/10.1016/j.techfore.2019.119895
- Yamauchi, F. (2016). Rising real wages, mechanization and growing advantage of large farms: Evidence from Indonesia. Food Policy, 58, 62–69. https://doi.org/https://doi.org/10.1016/j.foodpol.2015.11.004
- Yang, Z., Shao, S., Yang, L., & Miao, Z. (2018). Improvement pathway of energy consumption structure in China's industrial sector: From the perspective of directed technical change. Energy Economics, 72, 166–176. https://doi.org/https://doi.org/10.1016/j.eneco.2018.04.003
- Zha, D., Kavuri, A. S., & Si, S. (2017). Energy biased technology change: Focused on Chinese energy-intensive industries. Applied Energy, 190, 1081–1089. https://doi.org/https://doi.org/10.1016/j.apenergy.2016.11.001
- Zhu, S., Xu, X., Ren, X., Sun, T., Oxley, L., Rae, A., & Ma, H. (2016). Modeling technological bias and factor input behavior in China's wheat production sector. Economic Modelling, 53, 245–253. https://doi.org/https://doi.org/10.1016/j.econmod.2015.11.027