
 ?Mathematical formulae have been encoded as MathML and are displayed in this HTML version using MathJax in order to improve their display. Uncheck the box to turn MathJax off. This feature requires Javascript. Click on a formula to zoom.
Abstract
Behavioural finance literature explains that investment decisions are subject to ‘investor sentiment’ and, consequently, may affect the pricing of various asset classes. Our study examines the 12 major equity markets amid the COVID-19 pandemic disease outbreak in relation to returns and volatility behaviour. Empirical results show that the number of new cases and deaths recorded daily because of COVID-19 has disrupted investors’ sentiments globally, and also, the market has experienced an unparalleled negative return. Market connectedness and volatility spillover deliberate on the increased risk of emergent pandemic crises, which has become more pronounced during the first quarter of 2020. Further, after the global financial crisis, the volatility index has appeared at its highest level for the very first time. The unprecedented rise in the volatility index level indicates more significant pressure on put options as a hedge against the pandemic uncertainty.
1. Introduction
The recent outbreak of novel coronavirus (COVID-19), pneumonia of an unidentified source, was spotted in Wuhan, China, and its first news was published by the World Health Organization (WHO) on 31 December 2019. The WHO acknowledged this disease outbreak to be a public health emergency of international apprehension on 30 January 2020. Subsequently, on 11 March 2020, the organisation declared the COVID-19 a global pandemic event. The contagious spread of COVID-19 has emerged as one of the threats to the equity market participants and has increased stock market volatility around the globe. Hence, our purpose of the study is to uncover the effects of ‘disease outbreak news’ (DONs) for COVID-19 concerning the global equity market returns and the volatility index (VIX) in the time series and panel data setting. We further aim to uncover the market connectedness and volatility spillover among the major equity market based on the vector autoregression (VAR) framework of Diebold and Yilmaz (Citation2012).
The COVID-19 pandemic outbreak has many consequences: infectious diseases impact not only future investment but also labour productivity and economic activity, and further risk management (Laxminarayan & Malani, Citation2011). There has been a close relationship between economic crises and pandemic infectious diseases transmission, for example, Global Finance Crisis 2008–2009 that prevailed because of contagious disease H1N1. Many studies report long-run effects of such financial crises on the global health system (Suhrcke et al., Citation2011). Hence, Sands et al. (Citation2016) provide a conceptual framework to account for the likely impact of infectious diseases on the macroeconomy and insist necessary database for the forecasting. They also assert on health authorities for providing digestible input data to perform economic forecasting. Henceforth, the macroeconomy and sustainable economic growth depends on robust financial and health systems (Batrancea et al., Citation2018; Ioan, Malar Kumaran, et al., Citation2020; Ioan, Mozi, et al., Citation2020; Larissa, et al., Citation2020).
In this article, we take the opportunity to deal with the recent pandemic infection COVID-19, which has disrupted the global equity market. Our aim of the study is to show the effects of the number of infections and the number of deaths on the return and volatility concerning the major equity markets. As per empirical hypothesis, ‘the growth of COVID-19 infection affects equity market adversely and raises the expected stock market volatility’. The preliminary statistical analysis and empirical results pronounce the effects of a pandemic on the equity market. The exponential rise in the number of COVID-19 cases disrupted the global equity market sentiment and surge in the expected stock market volatility. The peak of investor fear stood at 86.01% for Germany and was the lowest for Australia. The association between the growth of COVID-19 and stock market development appears to be negative and statistically significant. The fact that negative estimates across all facets of pandemic outbreaks appear to be statistically significant implies that diseases outbreak among all countries has raised the stock market uncertainty. The essential findings of the study show that the announcement of an international emergency from the WHO has drawdown the equity market performance globally. The total connectedness index (TCI) shows that volatility spillover has increased and that markets appear to be more connected during the pandemic outbreak.
Section 2 of this article presents the literature evidence; Section 3 explains the data, preliminary analysis and empirical model building with the model for market connectedness; Section 4 offers results and discussion; and Section 5 ends with the conclusion.
2. Literature evidence
Some of the pioneering works (e.g., Baker & Wurgle, Citation2007; Cen et al., Citation2013; Lucey & Dowling, Citation2005) examine the impact of tail events on the investor’s psychology and overconfidence, investors’ biases, mood swings and anxiety on market returns and volatility. Several studies (e.g., Cen et al., Citation2013; Kamstra et al., Citation2003; Kaplanski & Levy, Citation2012) find that sunshine, public holidays and investors’ anxiety and mood swings affect the returns and asset pricing. Moreover, another strand of studies (e.g., Donadelli et al., Citation2017; Kaplanski & Levy, Citation2010; Yuen & Lee, Citation2003) explains that unexpected and natural events impact investors’ sentiments. Subsequently, they affect the risk-taking behaviour and fear for trading and lowers the willingness to participate in a risky investment. Conversely, disease outbreaks show a positive effect on pharma stocks. Hence, our study extends the previous works on the relationship between investor sentiment and DONs, taking into account various growth indicators of COVID-19, such as new COVID-19 cases and new deaths, total infections of COVID-19 and total death.
Following studies provide crucial information on the relation between equity market and infectious diseases outbreak studies: Chen et al. (Citation2007) find that due to SARS, Taiwan’s hospitality stock fell by about 29%; Chen et al. (Citation2009) report that SARS made a positive impact on the pharma and biotechnology stock in Taiwan Stock Exchange; Wang et al. (Citation2013) further extend work in terms of effects of pandemics such as Enterovirus 71, dengue fever, SARS and H1N1 on the biotech firms in Taiwan in terms of operational efficiency.
Some of the important recent studies on tail events, for example, Ebola outbreak and geographical proximity effects, Ichev and Marinč (Citation2018) find stock were more volatile of origin of West Africa and the United States located. Bash and Alsaifi (Citation2019) studied the impact of the murder of Jamal Khashoggi on the Saudi Stock Exchange and found that the event has raised a high risk of uncertainty with abnormal cumulative returns. Unlike the previous studies, Kowalewski and Śpiewanowski (Citation2020) studied the effects of mining disaster on the mining stock and found that media coverage on the mining disaster resulted in a decline of 1.15% firm value.
There has been some recent descriptive documentation on the effects of the COVID-19 outbreak on the U.S. economy. Baker, Bloom, Davis, Kost, et al. (Citation2020) employ a text-based quantitative framework to bring some insights into the recent COVID-19 outbreak in the U.S. equity market. The text-based archival analysis shows that recent stock market volatility has surpassed the ex post volatility level of October 1987, GFC 2008 and the Great Depression 1929–1930. Authors have presented excellent work on infectious disease outbreaks such as COVID-19 development and COVID-19-induced uncertainty. On the comparative analysis among several pandemic developments in the past, none of the pandemic events has affected the performance of the stock market as significantly as COVID-19. Likewise, Baker, Bloom, Davis, and Terry (Citation2020) present one more piece of work on COVID-19-induced economic uncertainty. As the question has been raised by Sands et al. (Citation2016) about economic forecasting induced by an infectious disease outbreak, Baker, Bloom and Terry (Citation2020, henceforth BBT) took this opportunity to build text-based forward-looking measures of economic uncertainty induced by COVID-19. BBT forecast the US real GDP using uncertainty shock and find contraction of output about 11% as of Q4 2020, which implies that COVID-19 persuades adverse effects. Hence, in our empirical model, we add COVID-19-induced economic uncertainty as one of the factors to explain the future level of implied volatility.
The recent media coverage and analyst attention include: for example, Larry (Citation2020) depicts the likely impact of the coronavirus on financial markets, whether it is equity or commodity or FX market. COVID-19-induced volatility and uncertainty have put much pressure on the well-developed and emerging markets. It is an uncontained epidemic: just wait and watch! Telford and Heath (Citation2020) and Karabell (Citation2020) also explain the current development in the equity market on the declaration of COVID-19 as a pandemic disease outbreak from the WHO, and they report that Dow Jones industrial average has slanted into a bear market and is the lowest over the last 11 years. Further, Kirby (Citation2020) and Perry and Zweifel (Citation2020) show concern about the uncertainty of global recession-induced COVID-19 and depict other crises due to growing fear of oil price decline, supply chain disruptions, Fed rate cut and contagious effects on travel and tourism companies.
Recently, Al-Awadhi et al. (Citation2020) investigated the impact of COVID-19 on the Chinese stock market using panel data regression. The authors in their research show that death and contagious infectious diseases impact the Chinese equity market and also reveal that daily new cases and the total number of deaths due to the illnesses exhibited negative stock returns among all companies. The work of Al-Awadhi et al. (Citation2020) and the research agenda set by Goodell (Citation2020) demonstrate the fatal and contagious effects of COVID-19 across global equity markets. Moreover, Bakas and Triantafyllou (Citation2020) studied the commodity price and pandemic uncertainty and found a substantial adverse impact on the commodity market. The effect was more pronounced in the crude oil market. Ali et al. (Citation2020) examine the effect of the COVID-19 global financial market and report that the Chinese market remains more stable after the outbreak. Still, the global financial system has disrupted due to a Coronavirus outbreak across other countries, mainly followed by Europe and the United States. Haroon and Rizvi (Citation2020) further deliberate on the relation between COVID-19 media coverage and financial market reactions, and find overwhelming panic produced by news media coverage and increased volatility in equity markets. Further, Zhang et al. (Citation2020) analysed rapid growth of COVID-19 across the globe and its impact on the financial market; they found that zero percent interest rate and unrestricted quantitative easing (QE) can help to recover the recent loss in the financial markets. Hence, our study contributes in terms of infectious diseases and market sentiment (VIX) and further bring some empirical evidence on the market connectedness.
3. Data sources, preliminary analysis and model building
3.1. Data, descriptive statistics and empirical model
In the studies of DONs, we consider major 12 equity markets and their VIX.Footnote1 We set our estimation window for the period January 2018 to March 2020, in which the DONs COVID-19 event window ranges from January 2020 to March 2020.Footnote2 We take daily prices of the VIX along with their underlying equity index. Furthermore, the information concerning the consequences of the infectious disease, for example, new confirmed cases (NC), new deaths (ND), total cases (TC) and total deaths (TD), had been considered from European Centre for Disease Prevention and Control (ECDPC) across all 12 countries.Footnote3
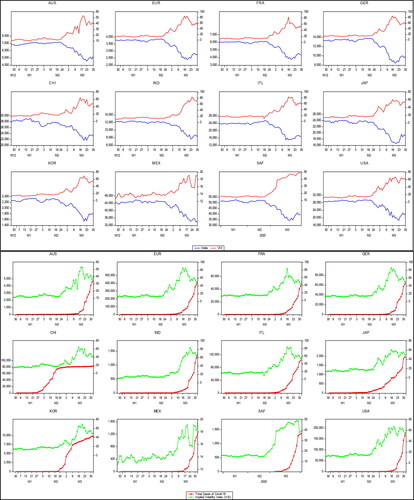
(the first panel) shows the time series plot of the implied VIX along with the respective country’s equity index. It is apparent that in the first quarter of 2020, there was not much deviation between the two indexes from January to February. However, there has been a significant fall in the stock indexes during March, followed by an exponential growth in the market volatility. The disease outbreak was more pronounced across the global equity market during March 2020. The second panel of the figure exhibits the plot of the VIX following the total cases of COVID-19 through February and March 2020. It is visible that a sudden rise in the COVID-19 positive cases disrupted the global equity market sentiment. Thus, there was a significant surge in the expected stock market volatility during March.
Figure 1. Temporal plot of stock index, implied volatility index and COVID-19 cases.
Source: Author's calculation.
displays the summary statistics on the returns and VIX, and further COVID-19 daily new cases and daily deaths. First, looking at the VIX level of respective countries’ average, the index levels of China and Italy are found to be higher than the other countries, and corresponding underlying stock index returns appear to be negative. For the stated sample period, the peak of investor fear stood at 86.01% for Germany and was the lowest for Australia. Second, the number of cases confirmed daily for COVID-19 on average are found to be 1102.34: the maximum cases being 35,252 for Europe, followed by the United States, with about 28,819. Third, daily deaths, conversely, as a consequence of the disease, have been observed to be 67.14 on average: with maximum mortality of 3424 in Europe, the second-highest, 1059, in the United States and third in Italy (839).
Table 1. Descriptive statistics.
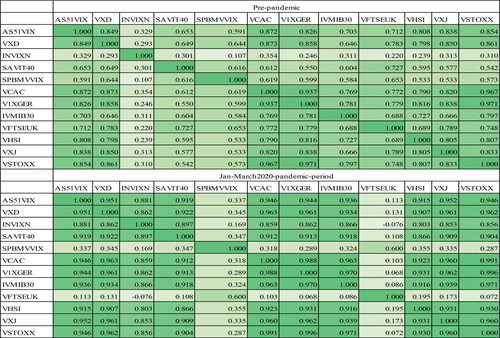
depicts the heatmap correlation matrix across global equity markets. We can see that prior to the pandemic spread, the equity markets were connected globally. Still, during the COVID-19 outbreak, the degree of connectedness between pairs of countries has increased and appears very close to 0.99. One of the interesting facts that we observe is that the Chinese equity market exhibited a low negative association with Asia-Pacific and the U.S. markets, which becomes more pronounced and encouraging during the pandemic spread. also displays the heatmap correlation for major VIXs; one can see that volatility connectedness was found to be very close among the European and Asian markets. During the pandemic period, the degree of volatility spillover (further statistical evidence reported in the next section) remains more visible between the United States and European markets, and similar patterns are seen for the Asian and Asia-Pacific markets.
Figure 2. Heatmap correlation matrix (Major equity market indexes).
Source: Author's calculation.
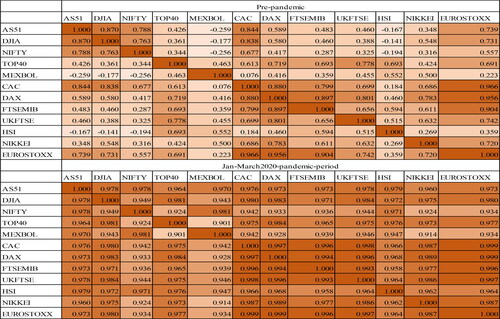
Figure 3. Heatmap correlation matrix (Major equity volatility indexes-VIX).
Source: Author's calculation.
summarises the correlation coefficient of various facets of COVID-19 and indicators of the equity market. We can see that the association between the growth of COVID-19 cases and stock market development appears to be negative and statically significant. One can also see that the VIX and the increase in the COVID-19 cases exhibit a strong positive association. Hence, these are the prima facie evidence of the effects of the pandemic outbreak on the financial markets. The impact of COVID-19 on the global equity market can be presented as,
(1)
(1)
(2)
(2)
Table 2. Correlation coefficients.
We further establish the empirical relation between investors’ fear and COVID-19 DONs in panel data framework as follows:
(3)
(3)
(4)
(4)
where
is the daily log-transformed values of the implied volatility index (VIX) of
country in period
it is regressed over
corresponding equity index returns and various indicators of this outbreak. Here,
indicates various growth indicators of disease outbreak with one period lag, where j = NC, new cases; ND, new death; TC, total cases and TD, total death.
has been measured as an index of a disease outbreak by taking the
of
and is similarly calculated for others (Eckstein & Tsiddon, Citation2004).
is a dummy variable that measures the contagious effects of infectious disease outbreak through January and March 2020. The empirical specification shown in EquationEq. (1)
(1)
(1) is the baseline model that reveals the causal relation between pandemic outbreak and returns behaviours across the global equity market, and EquationEq. (2)
(2)
(2) is an augmented regression model expressed as interaction between COVID-19 cases and DONs period. EquationEquations (1)
(1)
(1) and Equation(2)
(2)
(2) are exclusively designed to address equity returns based on a single factor affecting amid COVID-19. However, Chipeta and Szczygielski (Citation2015) and Szczygielski et al. (Citation2020) present excellent empirical evidence on the underspecification and residual market factor with factor omission and likely consequences on the return behaviour. Szczygielski et al. (Citation2020) consider monthly returns from the Johannesburg Stock Exchange (JSE) addressing several industries in a time series framework with a multifactor model. Our single factor return model is based on the equity index of daily data obtained from 12 countries in the panel data framework; it is not possible to add multiple macroeconomic factors across the countries with different frequencies. However, the work of Szczygielski et al. (Citation2020) can be extended using COVID-19 data and return behaviour across the global equity market using a multifactor time series model. Moreover, EquationEq. (3)
(3)
(3) is the basic COVID-19 specification that reveals the likely impact of various outbreak cases on the future stock market volatility. EquationEquation (4)
(4)
(4) is the augmented regression model that measures the effects of DONs on financial markets on the fear of COVID-19 fatality. Our empirical hypothesis is that ‘COVID-19 infectious disease outbreak affects the global financial market adversely’.
3.2. Volatility spillover and market connectedness
Market uncertainty results in a sharp increase in volatility and spillover of the global market. Pandemic and economic crises lead to instability in the financial system and show contagion impact across various markets. The VAR framework is frequently used to deal with the endogenous nature of economic variables and their relations. Diebold and Yilmaz (Citation2009) develop a framework from VARs for the volatility spillover measure based on forecast error variance decompositions. Diebold and Yilmaz (Citation2012) further extend their previous work and study daily volatility spillovers across Stock, Bond, FX and commodities markets addressing the global financial crisis. VAR estimation is all about impulse response function and variance decomposition. DY extend their work to decompose the total spillover in directional spillover using generalised VAR. To deal with market connectedness pre- and post-COVID-19, we employ the DY generalised VAR mechanism in which error variance decompositions are invariant among variable ordering and allow us to discover directional volatility spillover.
Considering there is a covariance stationary N-variable VAR(p) {}, variance decomposition needs orthogonal innovations; cholesky factorisation process allows us to achieve orthogonality. DY define the variance shares as
-ahead error variance decompositions
for
hence,
(5)
(5)
where
denotes variance matrix for the error vector ɛ,
shows the standard deviation for the error term for the jth equation and
is the section vector, with one as the ith element and zeros otherwise. Hence, the variance decompositions matrix based on the sum of the row is given as follows:
(6)
(6)
and total spillover index for volatility is calculated as
(7)
(7)
The total spillover index explains the spillover of volatility innovations among the 12 major equity markets. Further, we calculate directional spillovers based on the generalised variance decompositions matrix. The directional volatility spillover triggered by market ‘from’ all other markets
is given as follows:
(8)
(8)
Likewise, volatility spillover transmitted by market ‘to’ all other markets
is given as
(9)
(9)
and a further net spillover of volatility from market
to all other markets
is calculated as
(10)
(10)
Hence, EquationEq. (10)(10)
(10) is the difference amid the gross volatility innovations communicated TO and those acknowledged FROM all other markets. In order to analyze market connectedness and volatility spillover, we calculate log-transformed returns for each market and express volatility as absolute values of returns. For example, there are some studies (Ederington & Guan, Citation2000; McKenzie, Citation1999; Taylor, Citation1986) that use absolute returns-based models and show that it produces better volatility forecasts than models that are based on squared returns.
4. Results and discussion
4.1. Returns and ex-ante volatility amid COVID-19
displays the panel regression results of EquationEq. (1)(1)
(1) , and through it we can see that returns and COVID-19 crisis are negatively associated. The negative slopes across all facets of pandemic outbreaks appear to be statistically significant at a 1% level. It implies that disease outbreak among all countries has raised the stock market uncertainty. The tail event caused the adverse yield to the equity market participant and raised more concern about portfolio risk management. Hence, summarises the investors’ sentiment amid COVID-19, shows the panel regression output of EquationEq. (3)
(3)
(3) and establishes a causal relationship between infectious disease outbreak and investor sentiment. There are mainly four growth indicators of COVID-19 measured as an index of the disease outbreak. In our regression model,
acts as a control variable. By convention, stock returns and volatility are inversely associated; hence, one can see that the slope of the benchmark index returns appears negative and statistically significant. Moreover, the intercept term measures the effects of other uncertain political and economic events; therefore, it should be positive and significant. Through all models, we can see that the intercept term is positive and statistically significant (Nikkinen & Sahlström, Citation2004). Hence, during the period of ambiguity, investors are unaware of the future consequences of the market and keep on buying put options. Consequently, the VIX level increases (e.g., Shaikh, Citation2017, Citation2019). For example, the majority of the equity stock exchange replicates the method of CBOE VIX to calculate investors’ sentiment in the near term. During the initial period of the pandemic outbreak, market was shocked with the likely impact of COVID-19. Hence, investors rushed for hedge funds. On March 18, 2020 the put/call ratio of SPX index options appeared to be 2.48, and OEX options showed a value of 3.08, which is more than unity and implies to excessive trading volume in the put options. Consequently, it led to a higher premium on the put options resulting in higher implied volatility. The put/call ratio was found to be more than unity during the first quarter of 2020, post which the WHO announced COVID-19 as an international health emergency. The put/call ratio is the gauge of the market sentiment: a higher ratio indicates greater fear in the market. Now looking at the coefficient of the COVID-19 outbreak growth index, it seems that all indicators calculated positive and significant at a 1% level. Hence, one can say that COVID-19 has disrupted the investor sentiment gauged into the VIX (e.g., Al-Awadhi et al., Citation2020; Cen et al., Citation2013; Donadelli et al., Citation2017; Goodell, Citation2020; Ichev & Marinč, Citation2018; Kamstra et al., Citation2003; Kaplanski & Levy, Citation2012).
Table 3. Panel regression of equity market returns and COVID-19.
Table 4. Panel regression of investor fear and COVID-19.
shows the equity market performance amid COVID-19 during the first quarter of 2020. We can see that the estimates of the interaction term (i.e., a dummy of the months January, February and March) across various indicators of disease outbreak appear to be adverse and statistically significant. We set our estimation window from January 2018 to March 2020, in which the event window starts from 31 December 2019, a date on which the Chinese administration informed the WHO about pneumonia/viral flu symptoms among people of Wuhan, Hubei. After the occurrence of the suspicious death of those infected people, the WHO declared a public health emergency of international apprehension on 30 January 2020. Hence, we set three dummies
and
to measure the contagious effects of an infectious disease outbreak (e.g., Donadelli et al., Citation2017). The essential findings from the statistical evidence are that the growth of the pandemic since the announcement of international emergency from the WHO has drawdown the performance of the equity market. exhibits the empirical outcome of EquationEq. (4)
(4)
(4) depicting the effects of DONs on the global equity market. The augmented COVID-19 regression output has been reported in with four panels. In all four panel regressions, the intercept coefficient and benchmark returns appear to be positive and significant as hypothesised. One can see through all panels that, on average, the slope of
estimated about 4.2% concerning the growth of the cases of COVID-19 but did not show it to be significant. It indicates that in January 2020, the COVID-19 virus outbreak epicentre was Wuhan only, and the cases were marginal; hence, investors across the globe took it very frivolously. However, the estimated slope of dummy
was found to be 3.3% marginally lower. The plausible reason for this is that the WHO declared COVID-19 as a health emergency on 30 January 2020, once the number of cases increased exponentially in China and in its other major trading partners. exhibits that the VIX level has spiked following the rise of cases of COVID-19 globally. Hence, dummy
depicts the effects of an increase in the number of positive cases during March 2020. One can see that the slope of the March dummy appears to be 13.11% on average and is significant at a 1% level, which implies that COVID-19-induced uncertainty has been gauged into the VIX and that it is a forward-looking measure of the stock market volatility and the most promising measure of investors’ fear and nervousness. The jump in the VIX level indicates that the overburden on the put options results in hedging and demanding a higher premium for portfolio protection.
Table 5. Panel regression with disease outbreak news (DONs) and equity market returns.
Table 6. Panel regression with disease outbreak news (DONs) and investors' fear.
exhibits equity market return behaviour during the DONs period; one can see that new cases and new deaths during the pandemic outbreak reveal an adverse impact on stock market returns. Moreover, presents the regression result on the augmented dummy panel regression on the investors’ fear index (VIX) set for the first quarter of calendar year 2020 as the disease’s outbreak period. It is the period with the full amount of uncertainty in the financial markets, as highlighted by Goodell (Citation2020). Yet, the further implications of the COVID-19 outbreak remain unknown (Larry, Citation2020). The regression outcome indicates that the uncertain period from January to March 2020, with exponentially increasing COVID-19 cases has disrupted the investors’ sentiments globally.
Table 7. Panel regression with disease outbreak news (DONs-Q12020) and equity market returns.
Table 8. Panel regression with disease outbreak news (DONs-Q12020) and equity market volatility (VIX).
4.2. Volatility spillover during pandemic crises
summarises volatility spillover among major 11 equity markets amid the COVID-19 pandemic. It is also classified as the ijth entry and shows the forecast error variance of market shocks to the
In order to perform generalised VAR estimations, VAR consists of order 4 with 10-day ahead volatility forecast errors. More specifically, the total spillover index remains insensitive to various VAR orders ranging from 4 to 10 days. gives an insight into the decomposition of the overall volatility in an input–output mechanism. Panel A of explains the total volatility spillover between the major equity market before the global pandemic crisis and Panel B during the outbreak of COVID-19. The sum of the gross directional volatility spillovers to other from each of the worldwide equity market appears to be 446.35 pre pandemics and 927.29 during the outbreak period. One can see that from the ‘directional contribution to others’ the column of gross directional volatility spillovers France-CAC is relatively highest among all, at 101.16%. Next following is the German equity market (DAX) that explains about 82.95% of the forecast error variance. Looking at the pandemic period, the degree of connectedness is more enhanced to other markets. The TCI appears to be 40.58% (TCI = 446.35/1100), while during the pandemic period, it has increased by 84.30% (TCI = 927.29/1100). It implies that volatility forecast error variance based on volatility spillover remains more connected following the crisis period. Further, we see that based on the net volatility spillover, France and Germany exhibited the largest volatility spillover among all equity markets. The plausible reason for this outcome may be that these countries have reported the highest number of cases of COVID-19 during the pandemic period.
Table 9. Volatility spillover among global equity markets.
5. Conclusion
In this article, we presented some early evidence on the effects of COVID-19 as a contagious infectious disease across the global equity market, gauged into the VIX. The empirical work has been demonstrated using longitudinal data and generalised VAR. The adverse slopes estimated across all facets of pandemic outbreaks appear to be statistically significant and imply that disease outbreak among all countries has raised the stock market uncertainty. The essential findings from the statistical evidence are that the growth of the pandemic since the announcement of the WHO as an international health emergency has drawdown the equity market performance.
The COVID-19-induced uncertainty has been gauged into the VIX; subsequently, it is a forward-looking measure of the stock market volatility and the most promising measure of investors’ fear and nervousness. Yet, the further implications of the COVID-19 outbreak remain unknown: Just wait and watch! The regression outcome indicates that the uncertain period from January to March 2020, with exponentially increasing COVID-19 cases, has disrupted the investors’ sentiment globally. The TCI further signals that the markets are closely associated and the volatility spillover remains more pronounced from the European counterpart to other markets. The upsurge of the investor fears index during the DONs period provides evidence that investors are worried about portfolio rebalancing, hedging and alternative safe investment. The plausible reason for such market disruption is the deterioration of public health, temporal and diffusional long-lived effects, global economy and interconnectedness, social distancing, travel ban and lack of put protection. The exponential rise in the VIX level indicates overburden on the put options, which results in hedging and demanding a higher premium for portfolio protection. The considerable rise in the put/call ratio (e.g., SPX/OEX options, 2.48/3.08) post the announcement of COVID-19 being a global pandemic (11 March 2020) by the WHO has increased the fear and anxiety among equity traders, and demand of portfolio protection in the near term has increased the risk premium.
Disclosure statement
No potential conflict of interest was reported by the author.
Notes
1 Refer to ‘White Paper Cboe Volatility Index’ for more details. (https://www.cboe.com/micro/vix/vixwhite.pdf).
2 For example, Ichev and Marinč (Citation2018) studied the effects of tail event Ebola Outbreak on the firm’s stocks located in West Africa and in the United States for the estimation window 2014–2016.
3 Refer to ‘COVID-19 outbreak data’ at https://www.ecdc.europa.eu/en/publications-data/download-todays-data-geographic-distribution-covid-19-cases-worldwide.
References
- Al-Awadhi, A. M., Alsaifi, K., Al-Awadhi, A., & Alhammadi, S. (2020). Death and contagious infectious diseases: Impact of the COVID-19 virus on stock market returns. Journal of Behavioral and Experimental Finance, 27, 100326. https://doi.org/https://doi.org/10.1016/j.jbef.2020.100326
- Ali, M., Alam, N., & Rizv, S. A. (2020). oronavirus (COVID-19)–An epidemic or pandemic for financial markets. Journal of Behavioral and Experimental Finance, 27, 100341. https://doi.org/https://doi.org/10.1016/j.jbef.2020.100341
- Bakas, D., & Triantafyllou, A. (2020). Commodity price volatility and the economic uncertainty of pandemics. Economics Letters, 193, 109283. https://doi.org/https://doi.org/10.1016/j.econlet.2020.109283
- Baker, M., & Wurgler, J. (2007). Investor sentiment in the stock market. Journal of Economic Perspectives, 21(2), 129–152. https://doi.org/https://doi.org/10.1257/jep.21.2.129
- Baker, S., Bloom, N., Davis, S. J., & Terry, S. J. (2020). COVID-induced economic uncertainty. National Bureau of Economic Research, w26983. https://doi.org/https://doi.org/10.3386/w26983.
- Baker, S. R., Bloom, N., Davis, S. J., Kost, K., Sammon, M., & Viratyosin, T. (2020). The unprecedented stock market reaction to COVID-19. White paper-Becker Friedman Institute for Economics at UChicago, 1–12.
- Baker, S. R., Bloom, N., & Terry, S. J. (2020). Does uncertainty reduce growth? Using disasters as natural experiments. NBER. http://people.bu.edu/stephent/files/BBT.pdf.
- Bash, A., & Alsaifi, K. (2019). Fear from uncertainty: An event study of Khashoggi and stock market returns. Journal of Behavioral and Experimental Finance, 23, 54–58. https://doi.org/https://doi.org/10.1016/j.jbef.2019.05.004
- Batrancea, L., Nichita, A., Batrancea, I., & Gaban, L. (2018). The strenght of the relationship between shadow economy and corruption: Evidence from a worldwide country-sample. Social Indicators Research, 138(3), 1119–1143. https://doi.org/https://doi.org/10.1007/s11205-017-1696-z
- Cen, L., Lu, H., & Yang, L. (2013). Investor sentiment, disagreement, and the breadth–return relationship. Management Science, 59(5), 1076–1091. https://doi.org/https://doi.org/10.1287/mnsc.1120.1633
- Chen, C.-D., Chen, C.-C., Tang, W.-W., & Huang, B.-Y. (2009). The positive and negative impacts of the SARS outbreak: A case of the Taiwan industries. The Journal of Developing Areas, 43(1), 281–293.
- Chen, M.-H., Jang, S. S., & Kim, W. G. (2007). The impact of the SARS outbreak on Taiwanese hotel stock performance: An event-study approach. International Journal of Hospitality Management, 26(1), 200–212. https://doi.org/https://doi.org/10.1016/j.ijhm.2005.11.004
- Chipeta, C., & Szczygielski, J. J. (2015). Risk factors in returns of the South African stock market. Studies in Economics and Econometrics, 39(1), 47–70.
- Diebold, F. X., & Yilmaz, K. (2009). Measuring financial asset return and volatility spillovers, with application to global equity markets. The Economic Journal, 119(534), 158–171. https://doi.org/https://doi.org/10.1111/j.1468-0297.2008.02208.x
- Diebold, F. X., & Yilmaz, K. (2012). Better to give than to receive: Predictive directional measurement of volatility spillovers. International Journal of Forecasting, 28(1), 57–66. https://doi.org/https://doi.org/10.1016/j.ijforecast.2011.02.006
- Donadelli, M., Kizys, R., & Riedel, M. (2017). Dangerous infectious diseases: Bad news for Main Street, good news for Wall Street? Journal of Financial Markets, 35, 84–103. https://doi.org/https://doi.org/10.1016/j.finmar.2016.12.003
- Eckstein, Z., & Tsiddon, D. (2004). Macroeconomic consequences of terror: Theory and the case of Israel. Journal of Monetary Economics, 51(5), 971–1002. https://doi.org/https://doi.org/10.1016/j.jmoneco.2004.05.001
- Ederington, L., & Guan, W. (2000). Forecasting volatility. Working paper. University of Oklahoma.
- Goodell, J. W. (2020). COVID-19 and finance: Agendas for future research. Finance Research Letters, 35, 101512. https://doi.org/https://doi.org/10.1016/j.frl.2020.101512
- Haroon, O., & Rizvi, S. A. (2020). COVID-19: Media coverage and financial markets behavior—A sectoral inquiry. Journal of Behavioral and Experimental Finance, 27, 100343. https://doi.org/https://doi.org/10.1016/j.jbef.2020.100343
- Ichev, R., & Marinč, M. (2018). Stock prices and geographic proximity of information: Evidence from the Ebola outbreak. International Review of Financial Analysis, 56, 153–166. https://doi.org/https://doi.org/10.1016/j.irfa.2017.12.004
- Ioan, B., Malar Kumaran, R., Larissa, B., Anca, N., Lucian, G., Gheorghe, F., Horia, T., Ioan, B., & Mircea-Iosif, R. (2020). A panel data analysis on sustainable economic growth in India, Brazil, and Romania. Journal of Risk and Financial Management, 13(8), 170. https://doi.org/https://doi.org/10.3390/jrfm13080170
- Ioan, B., Mozi, R. M., Lucian, G., Gheorghe, F., Horia, T., Ioan, B., & Mircea-Iosif, R. (2020). An empirical investigation on determinants of sustainable economic growth. Lessons from Central and Eastern European Countries. Journal of Risk and Financial Management, 13(7), 146. https://doi.org/https://doi.org/10.3390/jrfm13070146
- Kamstra, M. J., Kramer, L. A., & Levi, M. D. (2003). Winter blues: A SAD stock market cycle. American Economic Review, 93(1), 324–343. https://doi.org/https://doi.org/10.1257/000282803321455322
- Kaplanski, G., & Levy, H. (2010). Exploitable predictable irrationality: The FIFA World Cup effect on the US stock market. Journal of Financial and Quantitative Analysis, 45(2), 535–553. https://doi.org/https://doi.org/10.1017/S0022109010000153
- Kaplanski, G., & Levy, H. (2012). The holiday and yom kippur war sentiment effects: The Tel Aviv Stock Exchange (TASE). Quantitative Finance, 12(8), 1283–1298. https://doi.org/https://doi.org/10.1080/14697688.2010.504225
- Karabell, Z. (2020, March 02). A stock market crash was coming, coronavirus was just the spark. https://time.com/57,93,506/a-stock-market-crash-was-coming-coronavirus-was-just-the-spark/
- Kirby, J. (2020, March 09). Will coronavirus cause a global recession? We still don’t know. https://www.vox.com/2020/2/28/21153492/coronavirus-recession-china-stock-market-economy
- Kowalewski, O., & Śpiewanowski, P. (2020). Stock market response to potash mine disasters. Journal of Commodity Markets, 20, 100124. https://doi.org/https://doi.org/10.1016/j.jcomm.2020.100124
- Larissa, B., Maran, R. M., Ioan, B., Anca, N., Mircea-Iosif, R., Horia, T., Gheorghe, F., Ema Speranta, M., & Dan, M. I. (2020). Adjusted net savings of CEE and Baltic Nations in the context of sustainable economic growth: A panel data analysis. Journal of Risk and Financial Management, 13(10), 234. https://doi.org/https://doi.org/10.3390/jrfm13100234
- Larry, C. (2020, March 03). Coronavirus’ impact on financial markets. Refinitiv Perspectives. https://www.refinitiv.com/perspectives/market-insights/coronavirus-impact-on-financial-markets/
- Laxminarayan, R., & Malani, A. 2011. Economics and finance, health, education, and welfare, public economics and policy. In Sherry Glied & Peter C. Smith (eds.), The Oxford Handbook of Health Economics. https://doi.org/http://doi.org/10.1093/oxfordhb/9780199238828.013.0009.
- Lucey, B. M., & Dowling, M. (2005). The role of feelings in investor decision‐making. Journal of Economic Surveys, 19(2), 211–237. https://doi.org/https://doi.org/10.1111/j.0950-0804.2005.00245.x
- McKenzie, M. D. (1999). Power transformation and forecasting the magnitude of exchange rate changes. International Journal of Forecasting, 15(1), 49–55. https://doi.org/https://doi.org/10.1016/S0169-2070(98)00066-1 https://doi.org/https://doi.org/10.1016/S0169-2070(98)00066-1
- Nikkinen, J., & Sahlström, P. (2004). Impact of the federal open market committee’s meetings and scheduled macroeconomic news on stock market uncertainty. International Review of Financial Analysis, 13(1), 1–12. https://doi.org/https://doi.org/10.1016/j.irfa.2004.01.001
- Perry, S., & Zweifel, P. (2020, January). The economic cost of the coronavirus. https://www.am.pictet/en/globalwebsite/global-articles/2020/expertise/multi-asset/impact-of-coronavirus-on-financial-markets
- Sands, P., Turabi, A. E., Saynisch, P. A., & Dzau, V. J. (2016). Assessment of economic vulnerability to infectious disease crises. The Lancet, 388(10058), 2443–2448. https://doi.org/https://doi.org/10.1016/S0140-6736(16)30594-3
- Shaikh, I. (2017). The 2016 U.S. presidential election and the Stock, FX and VIX markets. The North American Journal of Economics and Finance, 42, 546–563. https://doi.org/https://doi.org/10.1016/j.najef.2017.08.014
- Shaikh, I. (2019). On the relationship between economic policy uncertainty and the implied volatility index. Sustainability, 11(6), 1628. https://doi.org/https://doi.org/10.3390/su11061628
- Suhrcke, M., Stuckler, D., Suk, J. E., Desai, M., Senek, M., McKee, M., Tsolova, S., Basu, S., Abubakar, I., Hunter, P., Rechel, B., & Semenza, J. C. (2011). The impact of economic crises on communicable disease transmission and control: A systematic review of the evidence. PLoS One, 6(6), e20724. https://doi.org/https://doi.org/10.1371/journal.pone.0020724
- Szczygielski, J., Brummer, L., & Wolmarans, H. (2020). Underspecification of the empirical return-factor model and a factor analytic augmentation as a solution to factor omission. Studies in Economics and Econometrics, 44(2), 133–165. https://doi.org/https://doi.org/10.2139/ssrn.3380244 https://doi.org/https://doi.org/10.1080/10800379.2020.12097365
- Taylor, S. J. (1986). Modelling financial time series. Wiley.
- Telford, T., Heath, T. (2020, March 12). Dow enters bear market after coronavirus declared pandemic. https://www.washingtonpost.com/business/2020/03/11/markets-economy-today-oil-coronavirus/
- Wang, Y.-H., Yang, F.-J., & Chen, L.-J. (2013). An investor's perspective on infectious diseases and their influence on market behavior. Journal of Business Economics and Management, 14(Supplement_1), S112–S127. https://doi.org/https://doi.org/10.3846/16111699.2012.711360
- Yuen, K. S., & Lee, T. M. (2003). Could mood state affect risk-taking decisions? Journal of Affective Disorders, 75(1), 11–18. https://doi.org/https://doi.org/10.1016/S0165-0327(02)00022-8
- Zhang, D., Hu, M., & Ji, Q. (2020). Financial markets under the global pandemic of COVID-19. Finance Research Letters, 36, 101528. https://doi.org/https://doi.org/10.1016/j.frl.2020.101528