
 ?Mathematical formulae have been encoded as MathML and are displayed in this HTML version using MathJax in order to improve their display. Uncheck the box to turn MathJax off. This feature requires Javascript. Click on a formula to zoom.
Abstract
This paper aims to discover a suitable combination of contemporary feature selection techniques and robust prediction classifiers. As such, to examine the impact of the feature selection method on classifier performance, we use two Chinese and three other real-world credit scoring datasets. The utilized feature selection methods are the least absolute shrinkage and selection operator (LASSO), multivariate adaptive regression splines (MARS). In contrast, the examined classifiers are the classification and regression trees (CART), logistic regression (LR), artificial neural network (ANN), and support vector machines (SVM). Empirical findings confirm that LASSO's feature selection method, followed by robust classifier SVM, demonstrates remarkable improvement and outperforms other competitive classifiers. Moreover, ANN also offers improved accuracy with feature selection methods; LR only can improve classification efficiency through performing feature selection via LASSO. Nonetheless, CART does not provide any indication of improvement in any combination. The proposed credit scoring modeling strategy may use to develop policy, progressive ideas, operational guidelines for effective credit risk management of lending, and other financial institutions. The finding of this study has practical value, as to date, there is no consensus about the combination of feature selection method and prediction classifiers.
1. Introduction
The term credit or lending and borrowing system is old as human civilization (Thomas et al., Citation2002). Therefore it has a long history connected with the history of trade and commerce. Even though it has a very long history of credit, credit scoring is not as long as credit. It is assumed that the credit or lending and borrowing system has started 2000 BC or before, whereas the starting period of credit scoring is about six decades ago. In the early period, credit scores of potential customers were prepared via lending institutions from their respective applications (Hand & Jacka, Citation1998; Lewis, Citation1992; Thomas et al., Citation2002). Afterward, the area of credit scoring has been extended in diverse sectors with more new applications. At the beginning of the 21st century, the application of credit scoring had been developed more than before. This remarkable technological development was mainly announcing advanced, sophisticated approaches like artificial intelligent methods and prediction measures, for instance, GINI and area under the ROC (receiver operating characteristic) curve. In addition, the massive computational capacity of related technologies makes credit risk modeling considerably easier and efficient in compared to the earlier period (Chang et al., Citation2018; Chi et al., Citation2019a,b; Jiang & Jones, Citation2018; Jones et al., Citation2015, Citation2017; Jones & Wang, Citation2019; Uddin et al., Citation2020a,Citationb).
Besides, additional and irrelevant features may create computational difficulties in the credit data modeling process and require extra effort and cost to deal with this issue. To solve this problem, in pattern recognition and data mining, feature selection playing a significant role in identifying optimal feature sets, reducing data dimensionality, and modeling complexity. It selects a subset of only significant predictors for use in the model evaluation, enhances reliability, enlarges generalization power, and reduces overfitting. As such, a lot of recent studies developed on different feature selection approaches (such as Maldonado et al., Citation2017; López & Maldonado, Citation2019; Kozodoi et al., Citation2019; Arora & Kaur, Citation2020; Tian et al., Citation2015; Tian & Yu, Citation2017; Ala'raj & Abbod, Citation2016a). However, there is no consensus for the feature selection technique; each study applies a different strategy. Besides, the least absolute shrinkage and selection operator (LASSO) and multivariate adaptive regression splines (MARS) are the new feature selection methods used in other study fields. Nevertheless, there is no comprehensive study in the credit scoring literature to identify suitable combinations of those methods with potent contemporary classifiers like artificial neural networks (ANN), support vector machines (SVM). Moreover, these methodologies have never been tested in different study fields, such as small and mid-size enterprises (SME), agricultural credit, general credit, or other data dimensions, such as balanced, imbalanced, high, and low dimensional.
Against this backdrop, this paper employs two robust feature selection methods LASSO and MARS, with four trendy statistical and machine learning approaches, the Classification and regression trees (CART), logistic regression (LR), ANN, and SVM to evaluates the performance of classifiers with feature selection methods. We have chosen these methods because in data mining, CART, ANN, and SVM are considered broadly applied and best-supervised machine learning approaches (Lin et al., Citation2012; Wu et al., Citation2008). On the other hand, we also use LR as a conventional statistical approach, because Jones et al. (Citation2017) stated that most previous credit risk studies relied on this technique. This model is still the most used method is an industry-standard (Lessmann et al., Citation2015).
Two Chinese datasets are used for model training, and three other public datasets are also utilized for robustness check and validation. The Chinese SME, Chinese agricultural, and German datasets are imbalanced; the Australian and Japanese datasets are balanced. Therefore, in the beginning, this study used the balancing technique SMOTE (synthetic minority over-sampling technique) to make datasets balanced. Moreover, we also divided datasets as high dimensional and low dimensional based on the number of features. We considered high dimensional when the number of features is more than 30. Otherwise, the dataset is denoted as low dimensional. Thus, this paper's first research objective is to evaluate how baseline classifiers perform with different data dimensions. Afterward, the second objective is to determine the impact of feature selection approaches on classification performance; in other words, which combination can provide the best classification result in credit risk modeling performance. Finally, this paper intends to evaluate the degree of improvement and whether the progress is enough to use the new combined method instead of existing approaches.
Our empirical results confirm that a contemporary feature selection method LASSO followed by robust classifier SVM offers tremendous performance and outperforms other competitive classifiers. However, the classification efficiency is not equivalent for all types of datasets. In the balanced datasets, SVM with MARS accuracy is slightly better than the top classifiers SVM combined with feature selection method LASSO. Besides, the ANN also offers improved accuracy with feature selection methods, but the CART does not indicate any development. The industry standard LR can improve classification efficiency when performing feature selection by LASSO; however, according to average outcomes, the MARS undervalued LR's baseline model accuracy.
This paper provides a comprehensive analysis of using four widely used sophisticated statistical and machine learning approaches with two contemporary, robust feature selection methods. This paper also validates all classifiers with five different types of datasets, like balanced, imbalanced, high dimensional, low dimensional, SME, agricultural, and general credit. Therefore the most suitable approach for each particular field is identified, and these findings are applicable for the baseline methods of the future study. This study also allows us to know which classifiers are more sensitive to feature selection methods. These can provide a direction for potential credit risk research. This study recommends the LASSO feature selection method with robust machine learning classifier SVM according to the examined findings. Using LASSO has some benefits, such as LASSO, which naturally handle multicollinearity problems; it is also considered stable, efficient, and easily implemented. Conversely, SVM is regarded as the best algorithm for classification due to its massive computational capacity, easy construction, and advanced properties compared to other techniques.
Our paper is somewhat similar to existing studies (Tian et al., Citation2015; Tian & Yu, Citation2017), as these two studies also used LASSO and for the practical application. However, these two studies related to time series bankruptcy analysis. Conversely, our research is designed for credit risk modeling of Chinese SME and agricultural credit approval datasets; besides, we also used three public datasets for comparison and proper validation. Moreover, this study also divided datasets into different dimensions for a specific indication, such as balanced, imbalanced, and high dimensional, low dimensional. Finally, this study provides a new gesture for academic research and practical fields with general and specific findings in each area via comprehensive data modeling.
The balance of the paper is summarized as follows. Section 2 presents a related literature review. Section 3 describes data and methods. Section 4 discusses and presents empirical findings, and section 5 concludes the paper.
2. Literature review
In credit risk modeling, neural networks and support vector machines are considered robust and mostly used classifiers. The neural network is a numerical method provoked via the human brain's procedures, which is significant in problem-solving systems. Gately (Citation1996) described neural networks as "an artificial intelligence problem-solving computer program that learns through a training process of trial and error." Thus, for a better decision-making outcome, neural networks' structures involve a training process, and the linear or non-linear variables in the training process support differentiating predictors. In credit risk modeling, intelligent method neural networks somewhat different compared to other statistical methods. Such as, Al Amari (Citation2002) distinguished NN from regression models; he mentioned that the regression model used the "inverse matrix" to construct applicant's scores, whereas "applicant's profiles" were utilized by neural networks to prepare relative applicants scores. In addition, during the modeling process of neural networks, the process altered the findings until the most favorable outcome. In recent times neural network has emerged as a practical technology, with successful applications in default, bankruptcy, and failure prediction of the bank. Gately (Citation1996) also suggested that a neural network can be simply used in other financial sectors, such as mortgage submission, option pricing, and others. Some other researchers (such as Bishop, Citation1995; Masters, Citation1995) addressed many different types of neural networks: pattern recognition feed-forward net's architecture, the multilayer feed-forward neural networks, and the probabilistic neural networks are mostly used. A small number of credit scoring studies applied probabilistic neural networks (Master, 1995; Zekic-Susac et al., Citation2004). In contrast, most studies have been utilized multilayer feed-forward networks (Bishop, Citation1995; Desai et al., Citation1996; Dimla & Lister, Citation2000; Reed & Marks, Citation1999; Trippi &Turban, 1993, Chi et al., Citation2019b; West, Citation2000).
On the other hand, Cortes and Vapnik (Citation1995) developed SVM, which is considered popular and mostly used machine learning technology in different real-world study fields. In credit risk modeling it has widely been utilized due to its advanced classification ability and comparatively easy construction than its close counterpart ANN and other classifiers (Bao et al., Citation2019; Danenas & Garsva, Citation2015). The SVM is based on statistical learning theory. In contrast, the other traditional algorithm (such as NN) uses the empirical risk minimization (ERM) principle to minimize the sample's error, and it creates over-fitting. On the other hand, statistical learning theory implements structural risk minimization (SRM) theory, which reduces the upper bound of the classifier's generational error and the sample's error. These processes improve the classifier's generalization via minimizing structural risk. Due to its advanced properties, compared to other techniques, SVM considers the best algorithm for classification and regression (Ping & Yongheng, Citation2011). As such, a lot of recent studies also developed models based on robust classifier SVM (Al-Hadeethi et al., Citation2020; Jalal et al., Citation2020; Jiang et al., Citation2018; Kouziokas, Citation2020; Luo et al., Citation2020; Yu et al., Citation2018; Zheng et al., Citation2020). This paper also used industry-standard LR (Ohlson, Citation1980) and CART (Breiman et al., Citation1984) to compare with the above-mentioned trendy classifiers.
Besides, the original credit datasets may have numerous features; however, all features are not equally important. The additional features are reliable for extreme dimensionality as well as occupied the feature location. There are some benefits; however, it creates severe difficulties (Yu & Liu, Citation2003). In the practical field, it is complicated to run classifiers, and hence it is not capable of confine diverse affiliation of distinctiveness because this dataset might be different in dimension, characteristics, and inherent values (Ala'raj & Abbod, Citation2016a). Practically, the high dimensional datasets required maximum training time, but it produces minimum accuracy (Liu & Schumann, Citation2005).
Moreover, distinct unrelated and redundant characteristics in high-dimensional data are not beneficial to classification results but meaningfully increase the computational difficulties (Hu et al., Citation2018). To solve the challenges mentioned above, a lot of contemporary studies developed on feature selection approaches in different study fields (such as Maldonado et al., Citation2017; López & Maldonado, Citation2019; Kozodoi et al., Citation2019; Arora & Kaur, Citation2020; Tian et al., Citation2015; Tian & Yu, Citation2017; Ala'raj & Abbod, Citation2016a). As such, this paper makes feature selection as a pre-processing step for choosing the most influential variables and, therefore removing the redundant features. This paper employed the least absolute shrinking and selection operator (LASSO), multivariate adaptive regression splines (MARS) methods for feature selection. We utilized these models because recent findings confirm that these two methods are efficient and can provide superior selection outcomes compared to other related techniques (Ala'raj & Abbod, Citation2016a; Tian et al., Citation2015; Tian & Yu, Citation2017). This study selected three intelligent methods because of their respective efficiency, classification superiority, and application in the previous literature of credit scoring. Finally, the results of all three approaches are compared with industry-standard statistical method LR.
The related credit scoring studies used different types of modeling strategies, such as Huang et al. (Citation2004), applied SVM and multilayer perceptron (MLP) as a benchmark model and revealed that these two approaches consistently perform better than industry standard LR. In other perspectives, Huang et al. (Citation2007) recommend that the SVM classified default and non-default customers accurately. Invariably, some other studies (such as Min & Lee, Citation2005; Kim & Ahn, Citation2012; Shin et al., Citation2005) applied SVM on the Korean dataset, and few studies (Ding et al., Citation2008; Xie et al., Citation2011) exploited on Chinese listed company dataset. Nevertheless, both groups of studies provided similar ending about SVM's superiority over other counterparts, such as DA, LR, and NN. Furthermore, Boyacioglu et al. (Citation2009) mentioned that SVM and NN outperformed some other multivariate statistical approaches in the bank credit failure prediction. In addition, Zhong et al. (Citation2014) and Wang et al. (Citation2018) applied SVM, NN, and other technologies in rating distribution. They concluded that SVM is better in rating distribution, whereas NN is better than SVM on reliability.
Credit risk is crucial for financial organization; additional and irrelevant features may create computational difficulties and require extra effort and cost. However, the studies mentioned above did not use feature selection approaches to identify significant variables for model training and minimize error and cost. Therefore low modeling accuracy was reported without sufficient explanation. Also, there is no consensus in the existing literature for the feature selection technique; each study applies a different strategy. Besides, LASSO and MARS are the new feature selection methods used in other study fields. Still, there is no comprehensive study in the credit scoring literature to identify suitable combinations of those methods with potent contemporary classifiers like ANN and SVM.
3. Data and methods
3.1. Description of real-world databases
This paper utilizes five credit approval datasets from the real-world credit field to verify the efficacy and viability of the recommended credit scoring models. Two of our projects, high dimensional databases, are related to small and mid-size enterprises (SME), and agricultural credit was gathered from one of the top public Chinese commercial bank. These two historical data samples hold financial, nonfinancial, and macroeconomic variables from 28 major cities. In addition, three open datasets, namely, Australian, Japanese, and German credit data are available at the University of California, Irvine (UCI) Machine Learning Repository; however, the processed datasets are gathered from (Chi et al., Citation2017). A review of the five above mentioned databases is given in .
Table 1. Description of databases used in the experiment.
Any training set with a jagged allocation between the two classes can be considered imbalanced in the standard. Though, sample ratios 1:5 (minority samples: majority samples) or upper has generally been judged in the trail as insignificant datasets (He & Garcia, Citation2009). In our study, Australian and Japanese datasets are not imbalanced, German credit datasets are slightly imbalanced, and Chines SME and agricultural credit are mostly imbalanced. Therefore, in the beginning, this study employed the balancing technique SMOTE (synthetic minority over-sampling technique) to make datasets balanced. The experimental databases, consequently, are an excellent combination of balanced and imbalanced examples.
3.2. Data randomization
In the modeling, to reduce data redundancy and develop data reliability, it is significant to normalize data before construction and to train the models. It is better to transform data from different forms to common forms to escape bias and train the classifiers via uniform data instances. Some models like SVM and NN required input instances that scale from 0 to 1 and in a vector of a real number. Therefore, in this study, the min-max normalization method is used for data normalization. The new converted highest value is 1 (max_new), and the transformed lowest attribute is given a value of 0 (min_new). The transformation has done based on the following equation:
3.3. Data balancing
In the real-world business credit data, it is frequently found those maximum borrowers are non-default with a small percentage of default. Consequently, imbalanced ratios harm a model's evaluation performance. To solve this issue, synthetically under-sampling the majority class can boost modeling accuracy. Nevertheless, in this process, some virtual instances may be lost, and model over-fitting might happen.
To get possibly improved modeling efficiency without losing data, SMOTE (synthetic minority over-sampling technique) facilitates a data-miner to oversample the minority class (Chawla et al., Citation2002, Bifet et al., Citation2010). SMOTE produces new instances by working within the current feature space to avoid overfitting problems while expanding minority class regions. A new sample brings significance to the underlying data set as values are derived from interpolation rather than extrapolation. For every minority class instance, using a k-nearest neighbor technique SMOTE interpolates values and creates attribute values for new data instances (Drown et al., Citation2009). For each minority data, a novel synthetic data instance (I) is made by taking the distinction among the feature vector of I and its nearest neighbor (J) belonging to the equal group, multiply it by a random number between 0 and 1, and then adding it to I. This process generates a random line segment among all fair of existing features from instances I and J, resulting in forming a new sample contained by the dataset (Bifet et al., Citation2010). The procedure is recurring for the other k-1 neighbors of the minority instance I. As a result, SMOTE makes more general regions from the minority class, and decision tree classifiers can use for the data treatment for better generalizations.
3.4. Feature selection
Feature selection is an essential step to construct models proficiently. To enhance reliability, enlarge generalization power and reduce overfitting, it is the procedure of choosing a subset of only significant predictors for use in the model evaluation. Several methods have been applied for feature selection. However, this study used the following two robust feature selection techniques to provides more clean datasets to classifiers.
3.4.1. Least absolute shrinkage and selection operator (LASSO)
Previous studies (e.g., Altman, Citation1968; Beaver, Citation1966; Beaver et al., Citation2005; Campbell et al., Citation2008; Chava & Jarrow, Citation2004; Shumway, Citation2001) have presented various accounting ratios and market-related variables for the accurate modeling of credit and bankruptcy data. However, there is no standard variable or consensus regarding predictors to improve model accuracy. Variable selection is considered an essential and crucial part of the statistical literature to discover significant predictor variables and improve prediction accuracy. Contemporary development of feature selection literature shows the potential role of penalized shrinkage methods (Meier et al., Citation2008; Tibshirani, Citation1996; Zou, Citation2006); these approaches select relevant variables via shrunken coefficients under a pre-specified roughness penalty. This study applied the original method of least absolute shrinkage and selection operator (LASSO), recommend by Tibshirani (Citation1996), and contained by the shrinkage framework to pick a parsimonious set of the default set of default predictors. Amendola et al. (Citation2011) have introduced LASSO in the binary problem for the Italian data accounting variables. The LASSO can be presented by reducing the negative log-likelihood function subject to weighted constraints,
(1)
(1)
subject to
in the equation, n represents the number of instances, and p is the quantity of the predictors used in the respective model. The frequency of shrinkage can be control by the roughness penalty tuning parameter of s. It should be mentioned that the lower value of s generally indicates a more parsimonious set of the selected predictive variables.
The different penalizing coefficient with various weights in LASSO facilitates some desirable features. LASSO chooses predictors via zeroing some coefficients and shrinking others. The subset selection provides more interpretability than other models, and in the ridge regression, it also offers stability. LASSO assists in selecting significant predictors; selected variables can indicate the determinants of default. Some variables, especially some accounting variables, correlate with each other. LASSO automatically handle multicollinearity problem among the predictors. The efficiency of the shrinkage approach to solving multicollinearity problems, for example, ridge regression, is also mentioned in the earlier literature (Mahajan et al., Citation1977; Mason et al., Citation1991; Vinod, Citation1978). In addition, the LASSO is also mentionable for its computational efficiency (Efron et al., Citation2004).
The general user-friendly conventional feature selection method is the best-subset because of its interpretability. However, it has some limitations, such as any little modification in data that may reduce classification accuracy (Breiman, Citation1995, Citation1996; Tibshirani, 1996; Zou, Citation2006). It also assumes that the subset is not a feasible solution in the corporate bankruptcy or default prediction problem (Tian et al., Citation2015). In the practical field, the most used method is a stepwise subset, but it does not consider stochastic errors in the variable selection process (Fan & Li, Citation2001). Because of its heuristic algorithm, it may yield a local best solution rather than a global solution.
3.4.2. Multivariate adaptive regression splines (MARS)
Jerome H. Friedman develops multivariate adaptive regression splines (MARS) in 1991, which use for non–parametric and non-linear regression analysis. MARS can automatically perform the variable selection and other activities, such as variable transformation, interaction detection, and self-testing at high speed. The structure of MARS can be discussed in the following way:
(2)
(2)
where co is a constant coefficient, is the basis function, and ci is a coefficient of the basis function. In basis function, it gets various forms of independent variable's connections; the familiar functions used are the hinge functions that are used to discover variables, which are chosen as knots. Therefore the function obtains the following form (Friedman, Citation1991).
(3)
(3)
or,
(4)
(4)
where c is a constant, threshold, or knot location, X represents the independent variables. The purpose of the basis function is to convert the independent variables X into new variables (e.g., X'). Consistent with the EquationEq. (3)
(3)
(3) and Equation(4)
(4)
(4) , X' will take the value of X if X is larger than c, and it will take the value of zero if the value of X is less than c (Briand et al., Citation2004). For additional discussion about the MARS model, please refer to (Friedman, Citation1991 and Hastie et al., Citation2005).
3.5. Baseline classifiers
Four well-known classifiers, namely logistic regression (LR), classification and regression trees (CART), artificial neural network (ANN), and support vector machines (SVM), have been utilized to modeling credit approval data. The LR and CART methods are too popular to be described here. Therefore, this study only discusses the robust classifiers ANN and SVM are as follows:
3.5.1. Artificial neural network (ANN)
The structure of an artificial neural network (ANN) is developed based on the biological neural frameworks. ANN can effectively be applied in credit scoring and several other study fields, such as data classification and clustering, time series prediction, pattern recognition, signal processing, etc. ANN's training process is related to altering relations among the neurons. Feedforward neural network (FFNN) and feedback neural network (FBNN) are the two types of ANNs that depend on the system topology. In FFNN, the network's data stream is unidirectional with no response loops, whereas, in FBNN, the stream is bi-directional with response loops. Multilayer perceptron (MLP) belongs to FFNN, and it has three layers; input layer, hidden layer, and output layer. In the input layer, inputs are received, and the numbers of neurons are the same as the dataset's features. The hidden layer is the essential part of MLP used to map and transfer function between the input and output layer. Finally, the output layer is used to provide the outcome of the network.
In the MLP networks, neurons in the layer are completely interrelated by numeric weights; every neuron holds summation and activation functions. The summation function summarizes the product of inputs, weights, and bias as exposed in EquationEq. (5)(5)
(5) . Where wij is the relationship weight linking Ii to neuron j, βj is a bias term, and n is the entire quantity of neuron inputs. Activation functions will receive the output of the summation function as an input. Typically, the S-shapes curved sigmoid function is used as the non-linear activation function. The sigmoid function is shown in EquationEq. (6)
(6)
(6) . Consequently, the outcome of the neuron j can be described as in EquationEq. (7)
(7)
(7) .
(5)
(5)
(6)
(6)
(7)
(7)
While the formation of ANN is designed, this approach's learning procedure is functional to facilitate the network's parameters (set of weights). Alternatively, these weights are curved and modernized to estimate the outcomes and reduced the little error standard. One of the essential MLP training methods is supervised learning. The objective of supervised learning is to minimize the error among the expected and computed outcomes. Backpropagation is regarded as one of the general supervised learning algorithms based on the Gradient technique. It is a process of discovering the derivative of ANNs objective function regarding the weights and bias that replace among layers. This technique is ineffective when the search space is large, and the method is appropriate only for differentiable objective functions.
3.5.2. Support vector machines (SVM)
Cortes and Vapnik (Citation1995) developed SVM, which is considered popular and mostly used machine learning technology in different real-world study fields. The credit risk ground has been widely applied due to its advanced classification ability and comparatively easy construction than its close counterpart ANN and other classifiers (Bao et al., Citation2019; Danenas & Garsva, Citation2015). The SVM's purpose is to minimize the generalization error's upper bound depending on the structural risk minimization approach. In the SVM, it is initially necessary to utilize training instances to estimate a function for evaluation. The function presented in the following:
RN→ {1,-1}, which are k N-dimensional patterns Xi and class labels Yi, where
(8)
(8)
According to EquationEq (8)(8)
(8) , the SVM classifier should satisfy the following formulation:
(9)
(9)
(10)
(10)
This is the equivalent of the next equation.
(11)
(11)
The non-linear function φ will map the original space to a high-dimensional feature space. The hyperplane will be constructed by the mentioned inequalities, which is defined as
(12)
(12)
Its main idea is to project the input data into a high-dimensional feature space and then find a hyperplane supported by the support vectors to separate the two classes with a maximal margin. Based on the support vector's feature, the label of the new input sample can be predicted. Many functions (or called kernels) in SVM can be chosen to map the input data into the high-dimensional feature space, namely linear, polynomial, radial basis function (RBF), and sigmoid (Zhou et al., Citation2010).
3.6. Performance evaluation
Four popular credit scoring evaluation measures are adopted to predict the model's accuracy to reach the dependable and hearty ending. These are accuracy, area under the curve (AUC), type I error, type II error. The evaluation criteria are presented in the following manner:
(13)
(13)
(14)
(14)
(15)
(15)
(16)
(16)
TP, TN, FP, and FN are the main components of the confusion matrix are represent true positive, true negative, false positive, and false negative, respectively. Generally, accuracy (EquationEq. 13(13)
(13) ) is a widespread performance measure that appraises the model's general effectiveness by probable results. However, there are some limitations, like accuracy cannot distinguish default and non-default customers accurately. The area under the receiver operating characteristic (ROC) curve (EquationEq. 14
(14)
(14) ) is another universal classification accuracy measure in the literature (e.g., Jones, Citation2017; Jones et al., Citation2015; Swets et al., Citation2000). ROC curves are the alternative suitable option to evaluate the classifier's accuracy and are free of any threshold. Two types of performance measures are widely used to measure the error rates of the classifiers. These are type I (EquationEq. 15
(15)
(15) ) and type II error (EquationEq. 16
(16)
(16) ); when the respected classifier misclassified non-default customer as default one, it denoted as type I error. On the other hand, the default customer misclassified as the non-default customer is considered a type II error. The cost of type II is more than type I error.
3.7. Statistical significance tests
García et al. (Citation2015) recommend that through various classifiers that use unique splitting methods to reach a dependable ending, some hypothesis testing should be applied to determine the best model among the comparative models. Parametric and non-parametric are two types of statistical tests. However, it is assumed that the parametric tests hypothetically inappropriate and statistically apprehensive (Demšar, Citation2006). Non-parametric tests are also apposite to parametric tests for some statistical characteristics like the normality of the variance's data or homogeneity (Demšar, Citation2006).
Our paper used twelve classifiers, so the statistical significance test is essential to discover the top model from comparative classifiers. In this regard, we used a non-parametric test, known as Friedman's test, to ranks all the related approaches. Friedman's (Citation1940) test evaluates classifier performances separately; therefore, it provides rank according to classifier performances, like 1 for the best model, 2 for a close competitor of the best model, and so on. The Friedman statistics x2F is distributed based on x2 by K-1 degrees of freedom when N (number of databases) and K (number of approaches). In this paper, the following hypothesis is tested: H0: there is no difference between classifiers.
In case when the null hypothesis of the Friedman test is rejected, therefore we utilized a posthoc Bonferroni-Dunn's test (Dunn, Citation1961) to discover the specific pair-wise evaluations that create significant variances and to make the decision for comparative models (Demšar, Citation2006; Marqués et al., Citation2012a,b). According to this test, the outcomes of two or more approaches are considerably different if their normal position is different by at minimum the critical difference (CD), as follows:
where qα is measured as a standardized assortment value by confidence point, α/(k-1) divided by . In addition, K= figure of approaches contrasted to the best model and N= figure of datasets used in a particular study. Some recent studies (such as Ala'raj & Abbod, Citation2016a,b) also used Friedman and Bonferroni-Dunn's test to compare the classifiers and determine the best model.
4. Empirical results
present four classifiers' evaluation results from the base and two robust feature selection approaches on five real-world credit scoring datasets. Without any variable selection, the method is considered as a baseline. The outcomes which secured top position in all the respective criteria are used in bold font. The significant statistical rank and significant differences are measured by Friedman's and Bonferroni-Dunn's test. The modeling classifiers are optimized by using the default setting of programming software Python 3.5. The parameters of SVM based on Python 3.5 are: {kernel=‘Linear’; penalty=L2 regularization; loss function = squared hinge loss; loss tolerance = 0.0001; punishment slack coefficient C = 1.0; max iteration = 1000}. The parameters of ANN (also called Multi-Layer Perceptron, MLP) based on Python 3.5 are: {hidden layer sizes = 100; activation function=‘relu’, which is f(x)=max(0, x); slover=‘sgd’, which is Stochastic Gradient Descent algorithm; learning rate = 0.001; momentum = 0.9; L2 regularization parameter = 0.0001; loss tolerance = 0.0001; max iteration = 200}. The overall results confirm that LASSO based classifiers outperformed other models. However, to provide a specific scenario, we present our findings in the following different dimensions.
Table 2. Performance of classifiers over Australian data.
Table 3. Performance of classifiers over Chinese SME data.
Table 4. Performance of classifiers over Chinese agricultural data.
Table 5. Performance of classifiers over German data.
Table 6. Performance of classifiers over Japanese data.
4.1. Classification outcomes based on credit scoring datasets
Australian credit data: In the Australian dataset (), all classifiers show consistent improvement with two feature selection approaches; performing feature selection outperformed baseline classifiers in all four measures. In the accuracy and AUC, MARS improved the classification accuracy for LR by about 14% to 15%. From the perspective of type I and type II error LASSO can minimize classification error for the same classifier about 62% and 29%. However, MARS with SVM offered top scores in accuracy and AUC. The base classifier SVM performance is better than all other baseline models. In type I error, LASSO is followed by CART, and in type II error, SVM with MARS produces the minimum error.
Chinese SME credit data: The Chinese SME data classification results () are quite different from the Australian dataset. For the accuracy, feature selection method MARS undervalued classification performance of baseline models CART, ANN, and SVM. In the case of AUC, the results are the same for the CART and SVM. SVM followed by LASSO is outperformed other classifiers in accuracy and AUC. LASSO based SVM also minimizes type I and II error from baseline SVM; however, in type I error, MARS-based ANN and SVM offered minimum results.
Chinese agricultural credit data: In , the agricultural dataset's classification performances revealed that two classifiers, feature selection methods followed by LR and CART, do not indicate improvement in any case. ANN followed by LASSO, presents improvement in all the circumstances. However, SVM with LASSO outperformed all other classifiers in all the criteria.
German credit data: In the German data in , the classification outcomes confirm LASSO's supremacy, followed by SVM in all the performance measures. LASSO based LR and ANN also provide better results in maximum criteria. The feature selection based CART models undervalued its performance in all the criteria from baseline classifiers.
Japanese credit data: Looking for Japanese data in , ANN and SVM with feature selection methods outperform baseline models in accuracy, AUC, and type I error. The findings are unusual because feature selection improves classification performances in maximum cases; however, in the perspective of classification error, especially in type II error, SVM baselines outperform all other classifiers.
4.2. Best combination between feature selection methods and prediction classifiers
Balanced datasets: In our analysis, the Australian and Japanese datasets are balanced, low dimensional credit scoring datasets. The experimental outcomes confirm that MARS followed by SVM offers the utmost accuracy in the maximum criteria, whereas LASSO with SVM also provides competitive results. On the other hand, ANN, with two feature selection approaches, even present good outcomes.
Imbalanced datasets: In this study, the Chinese SME, Chinese agricultural credit, and German datasets are imbalanced. The SME and agricultural datasets are high dimensional, but the German dataset is low dimensional. The classification performances of imbalanced data sets are quite different from balanced datasets. The empirical findings demonstrate that LASSO, followed by SVM, significantly outperforms other classifiers. In the agricultural and German datasets, the accuracy is better than other counterparts, while in the SME dataset, it offers maximum accuracy in three out of four performance measures. Alternatively, MARS based approaches provide a minimal indication of improvement over the analysis.
4.3. The effect of feature selection on average outcomes of classifiers
According to the average results of five credit scoring datasets, the effect of feature selection on model classification accuracy is discussed in the following.
LR: The industry-standard LR with feature selection results are not consistent with all the models. The average effect of MARS based LR models does not provide any indication of improvement. It undervalues the base classifier outcomes, about 1.64%, 1.63% in the accuracy and AUC. It also increases classification error by 12.44% and 5.86% in type I and type II errors. However, LASSO followed by LR classifier presents significant improvement; it increases classification accuracy by 4.97%, 6.56% in accuracy, and AUC. It also minimizes about 23% and 30% in type I and type II error from the baselines model.
CART: There are no differences between the performances of the baseline and features selection based classifiers. The findings are consistent with the Liang et al. (Citation2015) recommendations; they mentioned that the feature selection technique is already used in the CART construction process. Therefore, feature selection may not be supportive of the development of performance for the CART.
ANN: Performing feature selection for ANN is helpful for the improvement of the classification performances. ANN improves its classification accuracy by 0.97%, 7.64% with MARS, and 2.45%, 8.73% with LASSO from the perspective of accuracy and AUC. It minimizes the type I error from baseline models at 9.65%, 4.81%, using MARS and LASSO. ANN also reduces type II error at 20.58%, 40.63% from the baseline model using MARS and LASSO. The findings were also supported by a previous study (Liang et al., Citation2015).
SVM: Combining a feature selection method with SVM significantly improves classification efficiency. Mainly, SVM combined with LASSO achieves an average of 95.19% and 97.59% scores for accuracy and AUC, beating by 6.35% and 9.94% of baseline SVM. It also reduces classification error by about 58% for type I and 56% for type II error. Our findings are slightly different from previous results in SVM's case (Liang et al., Citation2015). However, they used different feature selection approaches. Therefore, we can conclude that the LASSO variable selection method is more efficient than other traditional techniques, such as filter or wrapper methods.
In this paper, SVM and ANN are two robust classifiers. Empirical findings demonstrate that the SVM based model outperforms other models. The SVM model could obtain the global minimum solution as the SVM objective function can be transferred into convex quadratic programming to attain the global minimum solution. Different solution algorithms do not affect the optimal solution but only influence the convergence rate, which means the optimal solution's time cost.
Conversely, the ANN model's objective optimization function is non-convex and non-smooth, so there is a risk of obtaining a local minimum. To minimize this risk, we conduct the stochastic gradient descent (SGD) algorithm, which has been proved better than other solving algorithms (like batch gradient descent algorithm) and could attain almost zero training loss to find a global minimum (Du et al., Citation2019).
4.4. Statistical significance test results
According to García et al. (Citation2015), as the different approaches utilized distinct splitting methods, it is not sufficient to validate one model achieves results more significant to others. To evaluate performance thoroughly, it would appear appropriate to use a few hypotheses testing to highlight that the result's investigational differences are statistically significant.
This study measured the value of Friedman's ranks for accuracy and AUC. We have put only two statistical significance test results here. With α = 0.1and 0.05 significance levels, it has shown that LASSO based SVM is the best model according to accuracy and AUC. The post-hoc Bonferroni-Dunn's test in has expressed the level of differences with the best model to other models. If the test's P-value is lower than 5% or 10%, then the null hypothesis is rejected. Therefore, LASSO followed by SVM, is significantly better than corresponding models regarding accuracy. However, it has no statistically significant difference with SVM/MARS at 10% level and SVM/MARS and SVM baseline models with a 5% level. In the case of AUC with a 5% and 10% significant level, the results indicate no significant difference with ANN/MARS, ANN/LASSO, and SVM/MARS; nonetheless, there is a significant difference with other remaining models ().
Table 7. The result of statistical significance tests (Friedman and Bonferroni-Dunn's test).
4.5. Discussion
To achieve the major objectives described in Section 1, show the average performance of classifiers with feature selection methods on five real-world credit datasets. In addition, statistical significance test results are also presented to show differences among the classifiers ().
Figure 1. Average performances of classifiers on accuracy. Source: Authors' own calculations.
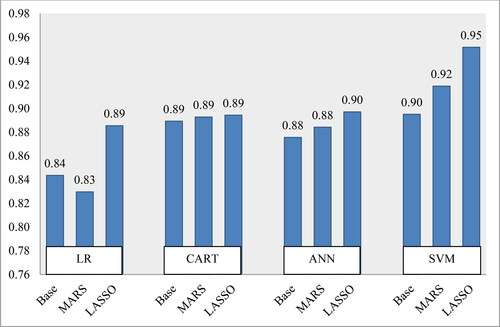
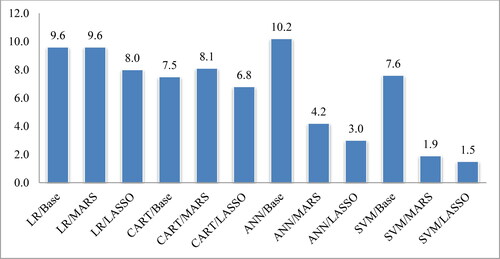
Figure 2. Average performances of classifiers on AUC. Source: Authors' own calculations.
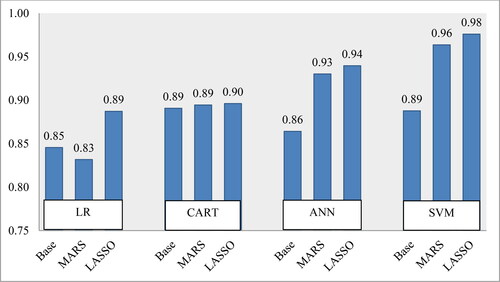
Figure 3. Average performances of classifiers on type I error. Source: Authors' own calculations.
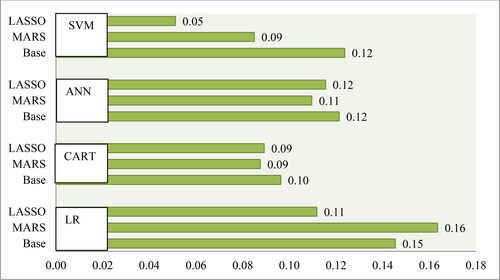
Figure 4. Average performances of classifiers on type II error. Source: Authors' own calculations.
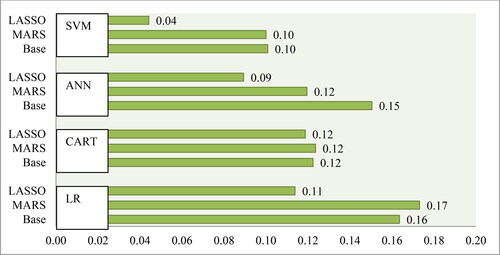
Figure 5. Statistical rank of classifiers (Friedman test) on accuracy. Source: Authors' own calculations.
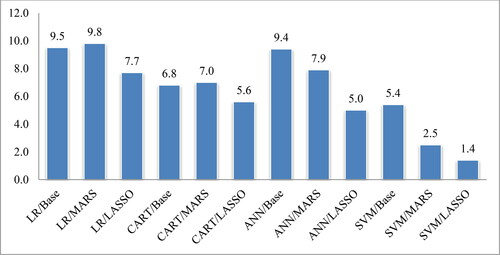
Figure 6. Statistical rank of classifiers (Friedman test) on AUC. Source: Authors' own calculations.
From the perspective of classification accuracy, on average, LASSO feature selection with SVM has the potential to perform better than other combinations from the viewpoint of classification accuracy (i.e., 95% for LASSO + SVM, 92% for MARS + SVM, and 90% for baseline SVM (without feature selection). In addition, LASSO with ANN also slightly improves classification accuracy from the baseline ANN model (i.e.90% for LASSO + ANN, 88% for baseline ANN). Furthermore, LASSO feature selection with LR can improve classification accuracy from the baseline model (i.e.89% for LASSO + LR, 84% for baseline LR). In the case of MARS with feature selection methods, there is no improvement from the baseline model. In a 5% significant level, according to the statistical significance test (Friedman and Bonferroni-Dunn's test), there is a significant difference in the classification performances of other models with LASSO + SVM, except for MARS + SVM. Therefore, LASSO + SVM would be a better choice than any other combination.
On the other hand, from the viewpoint of classification AUC on average, LASSO feature selection with SVM significantly outperforms baseline and other combinations (i.e., 98% for LASSO + SVM, 96% for MARS + SVM, and 89% for baseline SVM (without feature selection). Moreover, LASSO with ANN also improves classification accuracy from the baseline ANN model (i.e.94% for LASSO + ANN, 86% for baseline ANN). LASSO feature selection with LR also improves classification accuracy from the baseline model (i.e.89% for LASSO + LR, 85% for baseline LR). In MARS with feature selection methods, there is a minimal improvement from the baseline model (i.e.90% for LASSO + CART, 89% for baseline CART). From the viewpoint of the statistical significance test (Friedman and Bonferroni-Dunn's test) at a 5% significant level, there is a significant difference in other models' classification performances with LASSO + SVM, except MARS + SVM, LASSO + ANN, and MARS + ANN. Thus, LASSO + SVM would be a better option compared to other combinations.
Furthermore, if we consider type I error and type II, the LASSO feature selection method with SVM also significantly reduces classification error from the baseline model, and it outperforms other combinations. Therefore, according to four performance measures, the LASSO + SVM method is recommended. This is because it offers comparative classification accuracy; at the same time, it decreases the largest percentage of classification error.
5. Conclusions
This paper examines the impact of feature selection methods on the classifier's performances using several real-world credit datasets. More especially, we attempt to evaluate the sensitivity of the robust classifiers on different data dimensions. This issue has been studied extensively. However, there is still no consensus about the combination of feature selection method and prediction classifiers, which may be for data dimensionality and diversity. This paper aims to recommend a suitable combination by using robust methods on different datasets in this background.
5.1. Concluding remarks and relationship with previous findings
This paper has three major objectives; the first research objective is to evaluate how baseline modeling classifiers perform with different data dimensions. The second objective is to determine the impact of feature selection approaches on classification performance; alternatively, which combination can provide the best classification result in credit risk modeling. Finally, this paper intends to evaluate the degree of improvement and whether the progress is enough to use the new combined method instead of existing approaches.
Against these backdrops, this paper executes modeling classifiers LR, CART, ANN, and SVM as a baseline model on the original data samples of all five different datasets. Afterward, we shortlisted features of five respective datasets by using two feature selection approaches, LASSO and MARS. Then, we used four above-mentioned robust classifiers on selected features. Empirical findings are compared with the baseline classifiers to evaluate classification accuracy by feature selection methods. The predictive performance is evaluated against four performance measures: accuracy, AUC, type I error, and type II error. Finally, the average results of all datasets and statistical significance tests are carried out for every single model to compare and determine the most reliable model.
The overall empirical results and statistical ranking confirm that feature selection methods LASSO, followed by robust classifier SVM demonstrates remarkable improvement and outperforms other competitive classifiers. This combined top classifier offers 6.35% and 9.94% prediction improvement on the accuracy and AUC performance measures from the base classifiers. However, the classification efficiency is not equivalent for all types of datasets. In the imbalanced datasets, the recommended model significantly outperforms other classifiers. On the other hand, in the balanced datasets, the SVM with MARS accuracy is slightly better than the top classifiers SVM performing feature selection with LASSO. Besides, among the other classifiers, the ANN also offers improved accuracy with feature selection methods. Nevertheless, the CART does not provide any indication of improvement combined with LASSO and MARS. The industry standard LR can improve classification efficiency when performing feature selection by LASSO; however, according to average outcomes, the MARS undervalues the baseline model accuracy of LR.
This paper offers a comprehensive analysis of four widely used trendy statistical and machine learning approaches with two contemporary and robust feature selection methods. The appropriate combination of feature selection methods and prediction classifiers is recommended after proper validation of classifiers via different types of datasets (like balanced, imbalanced, high dimensional, low dimensional, SME, agricultural, and general credit). This mechanism can significantly improve prediction performances (such as accuracy and AUC) and minimize classification errors (type I and type II error). The outcomes of this paper also provide information about the sensitivity of classifiers with feature selection methods.
This paper's finding differs from existing similar studies (such as Tian et al., Citation2015; Tian & Yu, Citation2017), as this paper developed for Chinese SME and agricultural credit risk modeling. On the other hand, the above mentioned two papers related to time series bankruptcy analysis. In addition, for comparison and additional validation, our paper also used three public datasets. Moreover, for the particular assessment, the paper's findings are also divided based on datasets into different dimensions, such as balanced and imbalanced, as well as high dimensional and low dimensional. Therefore, this study provides a novel indication for the dynamic financial world and academic researchers via comprehensive research and general and specific findings on each application area.
5.2. Implications
Generally, this study has an important implication on the current credit risk literature. The accuracy of the prediction classifier is significant for lending institutions; it is also crucial for the country's overall economic health. As risk modeling is a natural real-world problem, it is considered that any little improvement can generate huge earning and minimize significant losses as well. Our analytical findings indicate that the proposed combination of classifier and feature selection technique can significantly improve classification accuracy and reduce prediction error. There is considerable potential to develop a sophisticated credit-scoring model by this combination. Therefore this study has practical significances for financial institutions, management, employees, investors, and government authority to minimize risk and maximize efficiency in the decision-making process.
Furthermore, this paper has three specific implications. Such as, first in the modeling, we used balanced and imbalanced datasets. The findings are discussed in those dimensions and for high dimensional and low dimensional datasets. Therefore our conclusions have a specific implication on above mentioned all types of datasets. Second, we assess the sensitivity of classifiers with feature selection methods on different problem areas. In the future, it would be applicable as baseline information to use robust prediction classifiers. Moreover, the generability of our modeling approach is tested on SME credit, agricultural credit, and general credit as well. Therefore the recommended combined approach can be used in other possible business domains, such as customer churn prediction or fraud detection.
5.3. Limitations and future research
Our paper's limitation is that we cannot develop any feature selection or prediction algorithm; instead, we used some existing methods to find the proper combination of feature selection and classification approaches. However, some other current methods could determine the appropriate combination of feature selection methods and classifiers. Besides, we have employed five real-world credit datasets to authenticate and validation of our proposed model. However, due to space constraints, we cannot discuss the importance of features, such as which feature is essential and significantly related to default prediction.
In the future, we want to use some newly developed feature selection methods, such as Butterfly Optimization Algorithm (BOA) (Arora & Anand, Citation2019), Dynamic Feature Importance (DFI) (Wei et al., Citation2020), ensemble feature selection techniques (Tsai & Sung, Citation2020). It would be interesting to use the Bayesian quantile regression and survival curve to model data with novel robust feature selection methods. Moreover, in future research, we will try to improve the interpretability of modeling outcomes by providing more information about the model's success and failure. On the other hand, recently, some features such as textual data, social media information, and profit-driven features generate more accuracy in the prediction process. Future work would also include new features to justify whether they continue to improve prediction accuracy.
Disclosure statement
The authors reported no potential conflict of interest.
Additional information
Funding
References
- Al Amari, A. (2002). The credit evaluation process and the role of credit scoring: A case study of Qatar [Ph.D. Thesis]. University College Dublin.
- Ala'raj, M., & Abbod, M. F. (2016a). A new hybrid ensemble credit scoring model based on classifiers consensus system approach. Expert Systems with Applications, 64, 36–55. https://doi.org/https://doi.org/10.1016/j.eswa.2016.07.017
- Ala'raj, M., & Abbod, M. F. (2016b). Classifier consensus system approach for credit scoring. Knowledge-Based Systems, 104, 89–105. https://doi.org/https://doi.org/10.1016/j.knosys.2016.04.013
- Al-Hadeethi, H., Abdulla, S., Diykh, M., Deo, R. C., & Green, J. H. (2020). Adaptive boost LS-SVM classification approach for time-series signal classification in epileptic seizure diagnosis application. Expert Systems with Applications, 161, 113676. https://doi.org/https://doi.org/10.1016/j.eswa.2020.113676
- Altman, E. I. (1968). Financial ratios, discriminant analysis and the prediction of corporate bankruptcy. The Journal of Finance, 23 (4), 589–609. https://doi.org/https://doi.org/10.1111/j.1540-6261.1968.tb00843.x http://links.jstor.org/sici?sici=00221082%28196809%2923%3A4%3C589%3AFRDAAT%3E2.0.CO%3B2-R.
- Amendola, A., Restaino, M., & Sensini, L. (2011). Variable selection in default risk models. The Journal of Risk Model Validation, 5 (1), 3–19. https://doi.org/https://doi.org/10.21314/JRMV.2011.066
- Arora, S., & Anand, P. (2019). Binary butterfly optimization approaches for feature selection. Expert Systems with Applications, 116, 147–160. https://doi.org/https://doi.org/10.1016/j.eswa.2018.08.051
- Arora, N., & Kaur, P. D. (2020). A Bolasso based consistent feature selection enabled random forest classification algorithm: An application to credit risk assessment. Applied Soft Computing Journal, 86, 105936. https://doi.org/https://doi.org/10.1016/j.asoc.2019.105936
- Bao, W., Lianju, N., & Yue, K. (2019). Integration of unsupervised and supervised machine learning algorithms for credit risk assessment. Expert Systems with Applications , 128, 301–315. https://doi.org/https://doi.org/10.1016/j.eswa.2019.02.033
- Beaver, W. H. (1966). Financial ratios as predictors of failure. Journal of Accounting Research, 4, 71–111. https://doi.org/https://doi.org/10.2307/2490171
- Beaver, W. H., McNichols, M. F., & Rhie, J. (2005). Have financial statements become less informative? Evidence from the ability of financial ratios to predict bankruptcy. Review of Accounting Studies, 10(1), 93–122. https://doi.org/http://dx.doi.org/10.2139/ssrn.634921
- Bifet, A., Holmes, G., Kirkby, R., & Pfahringer, B. (2010). MOA: Massive Online Analysis. Journal of Machine Learning Research, 11, 1601–1604. https://dl.acm.org/doi/10.5555/1756006.1859903
- Bishop, C. M. (1995). Neural Networks for Pattern Recognition (Advanced Texts in Econometrics (Paperback). Oxford University Press.
- Boyacioglu, M. A., Kara, Y., & Baykan, O. K. (2009). Predicting bank financial failures using neural networks, support vector machines and multivariate statistical methods: a comparative analysis in the sample of savings deposit insurance fund (SDIF) transferred banks in Turkey. Expert Systems with Applications, 36(2), 3355–3366. https://doi.org/https://doi.org/10.1016/j.eswa.2008.01.003
- Breiman, L. (1995). Better subset regression using the nonnegative garotte. Technometrics, 37(4), 373–384. https://doi.org/https://doi.org/10.2307/1269730
- Breiman, L. (1996). Heuristics of instability and stabilization in model selection. Annals of Statistics, 24, 2297–2778. https://doi.org/https://doi.org/10.1214/aos/1032181158
- Breiman, L., Friedman, J. H., Olshen, R. A., & Stone, C. J. (1984). Classification and regression trees. The Wadsworth.
- Briand, L. C., Freimut, B., & Vollei, F. (2004). Using multiple adaptive regression splines to support decision making in code inspections. Journal of Systems and Software, 73 (2), 205–217. https://doi.org/https://doi.org/10.1016/j.jss.2004.01.015
- Campbell, J., Hilscher, J., & Szilagyi, J. (2008). In search of distress risk. The Journal of Finance, 63(6), 2899–2939. https://doi.org/https://doi.org/10.1111/j.1540-6261.2008.01416.x
- Chang, Y.-C., Chang, K.-H., & Wu, G.-J. (2018). Application of eXtreme gradient boosting trees in the construction of credit risk assessment models for financial institutions. Applied Soft Computing Journal, 73, 914–920. https://doi.org/https://doi.org/10.1016/j.asoc.2018.09.029
- Chava, S., & Jarrow, R. A. (2004). Bankruptcy prediction with industry effects. Review of Finance, 8(4), 537–569. https://doi.org/http://dx.doi.org/10.2139/ssrn.287474
- Chawla, N., Bowyer, K., Hall, L., & Kegelmeyer, W. (2002). SMOTE: Synthetic Minority Over-sampling Technique. Journal of Artificial Intelligence Research, 16, 321–378. https://doi.org/https://doi.org/10.1613/jair.953
- Chi, G., Abedin, M. Z., & Moula, F. E. (2017). Modeling credit approval data with neural networks: an experimental investigation and optimization. Journal of Business Economics and Management, 18 (2), 224–240. https://doi.org/https://doi.org/10.3846/16111699.2017.1280844
- Chi, G., Uddin, M. S., Abedin, M. Z., & Yuan, k. (2019). Hybrid model for credit risk prediction: An application of neural network approaches. International Journal on Artificial Intelligence Tools, 28(05), 1–33. https://doi.org/https://doi.org/10.1142/S0218213019500179
- Chi, G., Yu, S., & Zhou, Y. (2019a). A novel credit evaluation model based on the maximum discrimination of evaluation results. Emerging Markets Finance and Trade, 56(11), 2543–2562. https://doi.org/https://doi.org/10.1080/1540496X.2019.1643717
- Cortes, C., & Vapnik, V. (1995). Support-Vector Networks. Machine Learning, 20(3), 273–297. https://doi.org/https://doi.org/10.1007/BF00994018
- Danenas, P., & Garsva, G. (2015). Selection of support vector machines based classifiers for credit risk domain. Expert Systems with Applications, 42(6), 3194–3204. https://doi.org/https://doi.org/10.1016/j.eswa.2014.12.001
- Demšar, J. (2006). Statistical comparisons of classifiers over multiple datasets. The Journal of Machine Learning Research, 7, 1–30.
- Desai, V. S., Crook, J. N., & Overstreet, G. A. A (1996). A comparison of neural networks and linear scoring models in the credit union environment. European Journal of Operational Research, 95 (1), 24–37. https://doi.org/https://doi.org/10.1016/0377-2217(95)00246-4
- Dimla, D. E., & Lister, P. M. (2000). On-line metal cutting tool condition monitoring. II: tool-state classification using multilayer perceptron neural networks. International Journal of Machine Tools and Manufacture, 40 (5), 769–781. https://doi.org/https://doi.org/10.1016/S0890-6955(99)00085-1 https://doi.org/https://doi.org/10.1016/S0890-6955(99)00085-1
- Ding, Y., Song, X., & Zen, Y. (2008). Forecasting financial condition of Chinese listed companies based on support vector machine. Expert Systems with Applications, 34(4), 3081–3089. https://doi.org/https://doi.org/10.1016/j.eswa.2007.06.037
- Drown, D. J., Khoshgoftaar, T. M., & Seliya, N. (2009). Evolutionary sampling and software quality modeling of high-assurance systems. IEEE Transactions on Systems, Man, and Cybernetics - Part A: Systems and Humans, 39(5), 1097–1107. https://doi.org/https://doi.org/10.1109/TSMCA.2009.2020804
- Du, S. S., Zhai, X., Poczos, B., & Singh, A. (2019). Gradient Descent Provably Optimizes Over-parameterized Neural Networks. International Conference on Learning Representations (ICLR).
- Dunn, O. J. (1961). Multiple Comparisons among Means. Journal of the American Statistical Association, 56(293), 52–64. https://doi.org/https://doi.org/10.1080/01621459.1961.10482090
- Efron, B., Hastie, T., Johnstone, I., & Tibshirani, R. (2004). Least angle regression. The Annals of Statistics, 32(2), 407–499. https://projecteuclid.org/euclid.aos/1083178935 https://doi.org/https://doi.org/10.1214/009053604000000067
- Fan, J., & Li, R. (2001). Variable selection via nonconcave penalized likelihood and its oracle properties. Journal of the American Statistical Association, 96(456), 1348–1360. https://doi.org/https://doi.org/10.1198/016214501753382273
- Friedman, J. H. (1991). Multivariate adaptive regression splines. The Annals of Statistics, 19 (1), 1–67. https://doi.org/https://doi.org/10.1214/aos/1176347963
- Friedman, M. (1940). A comparison of alternative tests of significance for the problem of rankings. The Annals of Mathematical Statistics, 11(1), 86–92. https://doi.org/https://doi.org/10.1214/aoms/1177731944
- García, V., Marqués, A. I., & Sánchez, J. S. (2015). An insight into the experimental design for credit risk and corporate bankruptcy prediction systems. Journal of Intelligent Information Systems, 44(1), 159–189. https://doi.org/https://doi.org/10.1007/s10844-014-0333-4
- Gately, E. (1996). Neural Networks for Financial Forecasting: Top Techniques for Designing and Applying the Latest Trading Systems. John Wiley & Sons, Inc.
- Hand, D. J., & Jacka, S. D. (1998). Statistics in Finance. Arnold Applications of Statistics: London.
- Hastie, T., Tibshirani, R., Friedman, J., & Franklin, J. (2005). The elements of statistical learning: data mining, inference, and prediction. Mathematical Intelligencer, 27 (2), 83–85.
- He, H., & Garcia, E. (2009). Learning from imbalanced data. IEEE Transactions on Knowledge and Data Engineering, 21, 1263–1284. https://doi.org/https://doi.org/10.1109/TKDE.2008.239
- Hu, L., Gao, W., Zhao, K., Zhang, P., & Wang, F. (2018). Feature selection considering two types of feature relevancy and feature interdependency. Expert Systems with Applications, 93, 423–434. https://doi.org/https://doi.org/10.1016/j.eswa.2017.10.016
- Huang, Z., Chen, H., Hsu, C. J., Chen, W. H., & Wu, S. (2004). Credit rating analysis with support vector machines and neural networks a market comparative study. Decision Support Systems, 37(4), 543–558. https://doi.org/https://doi.org/10.1016/S0167-9236(03)00086-1
- Huang, C. L., Chen, M. C., & Wang, C. J. (2007). Credit scoring with a data mining approach based on support vector machines. Expert Systems with Applications, 33(4), 847–856. https://doi.org/https://doi.org/10.1016/j.eswa.2006.07.007
- Jalal, M., Arabali, P., Grasley, Z., Bullard, J. W., & Jalal, H. (2020). Behavior assessment, regression analysis and support vector machine (SVM) modeling of waste tire rubberized concrete. Journal of Cleaner Production, 273, 122960. https://doi.org/https://doi.org/10.1016/j.jclepro.2020.122960
- Jiang, H., Ching, W., Yiu, K. F. C., & Qiu, Y. (2018). Stationary Mahalanobis kernel SVM for credit risk evaluation. Applied Soft Computing, 71, 407–417. https://doi.org/https://doi.org/10.1016/j.asoc.2018.07.005
- Jiang, Y., & Jones, S. (2018). Corporate distress prediction in China: A machine learning approach. Accounting & Finance, 58 (4), 1063–1109. https://doi.org/https://doi.org/10.1111/acfi.12432
- Jones, S., Johnstone, D., & Wilson, R. (2017). Predicting corporate bankruptcy: An evaluation of alternative statistical models. Journal of Business Finance & Accounting, 44 (1–2), 3–34. https://doi.org/https://doi.org/10.1111/jbfa.12218
- Jones, S. (2017). Corporate bankruptcy prediction: a high dimensional analysis. Review of Accounting Studies, 22 (3), 1366–1422. https://doi.org/https://doi.org/10.1007/s11142-017-9407-1
- Jones, S., Johnstone, D., & Wilson, R. (2015). An empirical evaluation of the performance of binary classifiers in the prediction of credit ratings changes. Journal of Banking & Finance, 56, 72–85. https://doi.org/https://doi.org/10.1016/j.jbankfin.2015.02.006
- Jones, S., & Wang, T. (2019). Predicting private company failure: A multi-class analysis. Journal of International Financial Markets, Institutions & Money, 61, 161–188. https://doi.org/https://doi.org/10.1016/j.intfin.2019.03.004.
- Kim, K. J., & Ahn, H. (2012). A corporate credit rating model using multi-class support vector machines with an ordinal pairwise partitioning approach. Computers & Operations Research, 39, 1800–1811. https://doi.org/https://doi.org/10.1016/j.cor.2011.06.023
- Kouziokas, G. N. (2020). A new W-SVM kernel combining PSO-neural network transformed vector and Bayesian optimized SVM in GDP forecasting. Engineering Applications of Artificial Intelligence, 92, 103650. https://doi.org/https://doi.org/10.1016/j.engappai.2020.103650
- Kozodoi, N., Lessmann, S., Papakonstantinou, K., Gatsoulis, Y., & Baesens, B. (2019). A multi-objective approach for profit-driven feature selection in credit scoring. Decision Support Systems, 120, 106–117. https://doi.org/https://doi.org/10.1016/j.dss.2019.03.011
- Lessmann, S., Baesens, B., Seow, H. V., & Thomas, L. C. (2015). Benchmarking state-of-the-art classification algorithms for credit scoring: An update of research. European Journal of Operational Research, 247(1), 124–136. https://doi.org/https://doi.org/10.1016/j.ejor.2015.05.030
- Lewis, E. M. (1992). An Introduction to Credit Scoring. Fair, Isaac & Co., Inc.
- Liang, D., Tsai, C.-F., & Wu, H.-T. (2015). The effect of feature selection on financial distress prediction. Knowledge-Based Systems, 73, 289–297. https://doi.org/https://doi.org/10.1016/j.knosys.2014.10.010
- Lin, W.-Y., Hu, Y.-H., & Tsai, C.-F. (2012). Machine learning in financial crisis prediction: A survey. IEEE Transactions on Systems, Man and Cybernetics –Part C: Applications and Reviews, 42(4), 421–436. https://doi.org/https://doi.org/10.1109/TSMCC.2011.2170420
- Liu, Y., & Schumann, M. (2005). Data mining feature selection for credit-scoring models. Journal of the Operational Research Society, 56(9), 1099–1108. https://doi.org/https://doi.org/10.1057/palgrave.jors.2601976
- López, J., & Maldonado, S. (2019). Profit-based credit scoring based on robust optimization and feature selection. Information Sciences , 500, 190–202. https://doi.org/https://doi.org/10.1016/j.ins.2019.05.093
- Luo, J., Yan, X., & Tian, Y. (2020). Unsupervised quadratic surface support vector machine with application to credit risk assessment. European Journal of Operational Research, 280(3), 1008–1017. https://doi.org/https://doi.org/10.1016/j.ejor.2019.08.010
- Mahajan, V., Jain, A. K., & Bergier, M. (1977). Parameter estimation in marketing models in the presence of multicollinearity: an application of ridge regression. Journal of Marketing Research, 14 (4), 586–591. https://doi.org/https://doi.org/10.1177/002224377701400419
- Maldonado, S., Bravo, C., López, J., & Pérez, J. (2017). Integrated framework for profit-based feature selection and SVM classification in credit scoring. Decision Support Systems, 104, 113–121. https://doi.org/https://doi.org/10.1016/j.dss.2017.10.007
- Marqués, A. I., García, V., & Sánchez, J. S. (2012a). Exploring the behaviour of base classifiers in credit scoring ensembles. Expert Systems with Applications, 39 (11), 10244–10250. https://doi.org/https://doi.org/10.1016/j.eswa.2012.02.092
- Marqués, A. I., García, V., & Sánchez, J. S. (2012b). Two-level classifier ensembles for credit risk assessment. Expert Systems with Applications, 39 (12), 10916–10922. https://doi.org/https://doi.org/10.1016/j.eswa.2012.03.033[Mismatch]
- Mason, C. H., William, D., & Perreault, J. R. (1991). Collinearity, power, and interpretation of multiple regression analysis. Journal of Marketing Research, 28 (3), 268–280. https://doi.org/https://doi.org/10.2307/3172863 https://doi.org/https://doi.org/10.1177/002224379102800302
- Masters, T. (1995). Advanced Algorithms for Neural Networks: A C++ Sourcebook. John Wiley & Sons, Inc.
- Meier, L., Geer, S., & Bühlmann, P. (2008). The group lasso for logistic regression. Journal of the Royal Statistical Society: Series B (Statistical Methodology)), 70(1), 53–71. https://doi.org/https://doi.org/10.1111/j.1467-9868.2007.00627.x
- Min, J. H., & Lee, Y. C. (2005). Bankruptcy prediction using support vector machine with optimal choice of kernel function Parameters. Expert Systems with Applications, 28(4), 603–614. https://doi.org/https://doi.org/10.1016/j.eswa.2004.12.008
- Ohlson, J. (1980). Financial ratios and the probabilistic prediction of bankruptcy. Journal of Accounting Research, 18 (1), 109–131. https://doi.org/https://doi.org/10.2307/2490395
- Ping, Y., & Yongheng, L. (2011). Neighborhood rough set and SVM based hybrid credit scoring classifier. Expert Systems with Applications, 38(9), 11300–11304. https://doi.org/https://doi.org/10.1016/j.eswa.2011.02.179
- Reed, R. D., & Marks, R. J. (1999). Neural Smithing: Supervised Learning in Feedforward Artificial Neural Networks. The MIT Press.
- Shin, K. S., Lee, T. S., & Kim, H. J. (2005). An application of support vector machines in bankruptcy prediction model. Expert Systems with Applications, 28(1), 127–135. https://doi.org/https://doi.org/10.1016/j.eswa.2004.08.009
- Shumway, T. (2001). Forecasting bankruptcy more accurately: a simple hazard model. The Journal of Business, 74(1), 101–124. https://doi.org/http://dx.doi.org/10.2139/ssrn.171436
- Swets, J. A., Dawes, R. M., & Monahan, J. (2000). Better decisions through science. Scientific American, 283 (4), 82–87. https://doi.org/https://doi.org/10.1038/scientificamerican1000-82
- Thomas, L. C., Edelman, D. B., & Crook, L. N. (2002). Credit Scoring and Its Applications. Philadelphia. Society for Industrial and Applied Mathematics.
- Tian, S., & Yu, Y. (2017). Financial ratios and bankruptcy predictions: An international evidence. International Review of Economics & Finance ,51, 510–526. https://doi.org/https://doi.org/10.1016/j.iref.2017.07.025
- Tian, S., Yu, Y., & Guo, H. (2015). Variable selection and corporate bankruptcy forecasts. Journal of Banking & Finance, 52, 89–100. https://doi.org/https://doi.org/10.1016/j.jbankfin.2014.12.003
- Tibshirani, R. (1996). Regression shrinkage and selection via the lasso. Journal of the Royal Statistical Society: Series B (Methodological), 58(1), 267–288. https://doi.org/https://doi.org/10.1111/j.2517-6161.1996.tb02080.x
- Trippi, R. R., & Turban, E. (1993). Neural Networks in Finance and Investing: Using Artificial Intelligence to Improve Real-World Performance. IRWIN.
- Tsai, C.-F., & Sung, Y.-T. (2020). Ensemble feature selection in high dimension, low sample size datasets: Parallel and serial combination approaches. Knowledge-Based Systems, 203, 106097. https://doi.org/https://doi.org/10.1016/j.knosys.2020.106097
- Uddin, M. S., Chi, G., Al Janabi, M. A. M., & Habib, T. (2020b). Leveraging random forest in micro-enterprises credit risk modelling for accuracy and interpretability. International Journal of Finance & Economics, 1–17. https://doi.org/https://doi.org/10.1002/ijfe.2346
- Uddin, M. S., Chi, G., Habib, T., & Zhou, Y. (2020a). An alternative statistical framework for credit default prediction. Journal of Risk Model Validation, 14 (2), 1–36. https://doi.org/https://doi.org/10.21314/JRMV.2020.220
- Vinod, H. D. (1978). A survey of ridge regression and related techniques for improvements over ordinary least squares. The Review of Economics and Statistics, 60 (1), 121–131. https://ssrn.com/abstract=1750091 https://doi.org/https://doi.org/10.2307/1924340
- Wang, D., Zhang, Z., Bai, R., & Mao, Y. (2018). A hybrid system with filter approach and multiple population genetic algorithm for feature selection in credit scoring. Journal of Computational and Applied Mathematics, 329, 307–321. https://doi.org/https://doi.org/10.1016/j.cam.2017.04.036
- Wei, G., Zhao, J., Feng, Y., He, A., & Yu, J. (2020). A novel hybrid feature selection method based on dynamic feature importance. Applied Soft Computing Journal, 93, 106337. https://doi.org/https://doi.org/10.1016/j.asoc.2020.106337
- West, D. (2000). Neural network credit scoring models. Computers & Operations Research, 27 (11–12), 1131–1152. https://doi.org/https://doi.org/10.1016/S0305-0548(99)00149-5. https://doi.org/https://doi.org/10.1016/S0305-0548(99)00149-5
- Wu, X., Kumar, V., Ross Quinlan, J., Ghosh, J., Yang, Q., Motoda, H., McLachlan, G. J., Ng, A., Liu, B., Yu, P. S., Zhou, Z.-H., Steinbach, M., Hand, D. J., & Steinberg, D. (2008). Top 10 algorithms in data mining. Knowledge and Information Systems, 14(1), 1–37. https://doi.org/https://doi.org/10.1007/s10115-007-0114-2
- Xie, C., Luo, C., & Yu, X. (2011). Financial distress prediction on SVM and MDA methods: the case of Chinese listed companies. Quality & Quantity, 45, 671–686. https://doi.org/https://doi.org/10.1007/s11135-010-9376-y
- Yu, L., & Liu, H. (2003). Feature selection for high-dimensional data: A fast correlation-based filter solution. International Conference on Machine Learning, 2, 856–863.
- Yu, L., Zhou, R., Tang, L., & Chen, R. (2018). A DBN-based resampling SVM ensemble learning paradigm for credit classification with imbalanced data. Applied Soft Computing, 69, 192–202. https://doi.org/https://doi.org/10.1016/j.asoc.2018.04.049
- Zekic-Susac, M., Sarlija, N., & Bensic, M. (2004). Small Business Credit Scoring: A Comparison of Logistic Regression, Neural Networks, and Decision Tree Models. 26th International Conference on Information Technology Interfaces, Croatia. https://doi.org/https://doi.org/10.1109/ITI.2004.241696
- Zheng, K., Chen, Y., Jiang, Y., & Qiao, S. (2020). A SVM based ship collision risk assessment algorithm. Ocean Engineering, 202, 107062. https://doi.org/https://doi.org/10.1016/j.oceaneng.2020.107062
- Zhong, H., Miao, C., Shen, Z., & Feng, Y. (2014). Comparing the learning effectiveness of BP, ELM, I-ELM, and SVM for corporate credit ratings. Neurocomputing , 128, 285–295. https://doi.org/https://doi.org/10.1016/j.neucom.2013.02.054
- Zhou, L., Lai, K. K., & Yu, L. (2010). Least squares support vector machines ensemble models for credit scoring. Expert Systems with Applications, 37(1), 127–133. https://doi.org/https://doi.org/10.1016/j.eswa.2009.05.024
- Zou, H. (2006). The adaptive lasso and its oracle properties. Journal of the American Statistical Association, 101(476), 1418–1429. https://doi.org/https://doi.org/10.1198/016214506000000735