
 ?Mathematical formulae have been encoded as MathML and are displayed in this HTML version using MathJax in order to improve their display. Uncheck the box to turn MathJax off. This feature requires Javascript. Click on a formula to zoom.
Abstract
This study draws a comparison between the Global Financial Crisis (GFC) and the COVID-19 pandemic crisis to assess the safe-haven potential of Islamic stocks for G7 stock markets. We employ the cross-quantilogram framework of Han et al., which considers the non-linearity in the relationship, and thus captures the correlation between the Islamic and G7 stock markets across various quantiles reflecting different market conditions. The analysis also includes the time-varying cross-quantile correlation to observe the evolution of Islamic stocks' safe-haven potential. Our full sample analysis shows that Islamic stocks do not exhibit safe-haven properties for G7 stock markets. During the GFC period, Islamic stocks show some diversification benefits for the G7 stock markets. Notably, Islamic stocks emerged as a robust safe-haven asset for the G7 stock markets during the pandemic crisis. The study carries essential insights for equity investors and regulators of G7 and other countries to implement diversification/hedging strategies that would involve Islamic stocks to protect equity investments and the overall financial system amid the financial downturns.
1. Introduction
While many countries are still wrestling with new mutations of the coronavirus pandemic, known as COVID-19, others are hesitantly heading into the post-lockdown phase. With several countries starting to vaccinate the elderly and health professionals, the health side of the virus is getting under some control. However, the economic and financial implications may continue to unfold for years to come. The International Monetary Fund (Citation2020) has already predicted the global economy to shrink by 3 percent in 2020, and the forecast is even double for advanced economies. Concurrently, the COVID-19 pandemic has brought about severe repercussions for financial markets, including volatility jumps, repricing issues, liquidity shortages, capital outflows, and currency depreciations (World Bank, Citation2020; Carlsson-Szlezak et al., Citation2020; Albulescu, Citation2021; Aslam et al., Citation2020; Guo et al., Citation2021)Footnote1. For equity markets, the start of the COVID-19 crisis may be traced back to late February, when stock markets worldwide entered a period of record-breaking losses. The crisis worsened further in March when the number of infections rose simultaneously across multiple countries, propelling the World Health Organization to declare the crisis as a global pandemic. An immediate response was recorded on March 9, 2020, when global stock markets plunged to levels comparable to those seen after Lehman Brothers' collapse in 2008 – known as the global financial crisis (hereinafter GFC) (Baker et al., Citation2020). While some researchers study various dimensions of the COVID-19 pandemic (Akhtaruzzaman et al., Citation2020; Cheema et al., Citation2020; Corbet et al., Citation2020a, Citation2020b; Sharif et al., Citation2020), others have begun comparing the pandemic and the GFC with specific objectives (Colombo & Lazzari, 2020; Gunay, 2021; Kinateder et al., Citation2021). Goodell (Citation2020) and Yarovaya et al. (Citation2020), for instance, compare the social and economic costs of the quarantine measures with the costs of the GFC.
As with any other crisis episode disrupting financial markets, searching for safe-haven assets is one of the most relevant concerns for both investors and policymakers amid the ongoing pandemic crisis. In general, a safe-haven is a place of refuge or safety. In financial markets, a safe-haven is defined as an asset that is negatively correlated or uncorrelated with another asset or portfolio in specific periods only, such as crisis times (Baur & McDermott, Citation2010; Baur & Lucey, Citation2010). To avoid imminent losses during times of heightened uncertainty, such as these, equity investors typically resort to safe-haven assets like gold (Baur & McDermott, Citation2010; Baur & Lucey, Citation2010) and cryptocurrencies (e.g., Feng et al., Citation2018). Unfortunately, empirical evidence suggests that even gold and cryptocurrencies have failed to shield investors against the COVID-19 pandemic (Conlon & McGee, Citation2020; Corbet et al., 2020; Conlon et al., Citation2020). It, therefore, becomes indispensable to test the safe-haven potential of other assets for this purpose. Literature shows that Islamic stocks also provided an excellent safe-haven against their conventional counterparts when tested during the GFC period (Hkiri et al., Citation2017; Aloui et al., Citation2018)Footnote2. Among S&P and Dow Jones indices, the Islamic indices have outperformed their conventional counterparts since the COVID-19 outbreak (Welling, Citation2020). Islamic stocks' superior performance is often linked to their Sharia-compliance characteristics (Masih et al., Citation2018). Under Sharia-compliance requirements, businesses are asked to ensure real economy-linkages and debt avoidance or forbid them from 'Haram' (unlawful) activities such as maisir (gambling), riba (usury), gharar (ambiguity), alcohol, and tobacco.
Consequently, Sharia-compliant stocks have become increasingly popular among investors, contributing substantially to the Islamic finance industry's phenomenal growth over the last decadeFootnote3. Provided the safe-haven potential of Islamic stocks and the increased role of Islamic finance, it is always exciting to investigate whether Islamic stocks offer safe-haven properties against conventional counterparts. It is even more timely and relevant to explore whether Islamic stocks' safe-haven properties are different during the COVID-19 crisis from those witnessed under the GFC. This will provide novel evidence of Islamic stocks' decoupling from conventional stocks between the two dissimilar crises. This information will aid investors, managers, and policymakers in trading, risk management, and policymaking decisions involving conventional and Sharia-compliant stocks. Furthermore, testing the decoupling of Islamic stocks during the COVID-19 period provides an excellent opportunity to compare how Islamic stocks served as a safe-haven during the two crises.
A comparison between the two crises is essential because while the financial-market chaos caused by the COVID-19 pandemic resembles the GFC, as Quinsee (2020) points out, there is a significant difference between the two crises. The GFC was inherently an endogenous shock that resulted from market participants, speculators, and bankers taking bold actions such as an excessive accumulation of debt and unsustainable risk-taking, which eventually led to the credit bubble, as suggested by Roy and Kemme (Citation2020). In contrast, the COVID-19 pandemic crisis is attributed to exogenous factors that directly influence the global economy. Given the inherent distinctiveness and consequent resemblance between the two crises, it would, therefore, be interesting to examine whether the safe-haven potential of Islamic stocks prevails over the two crisis episodes.
In this study, we examine the safe-haven potential of Islamic stocks against G7 stock markets. We consider G7 markets as our study sample. G7 countries produce approximately 40 percent of the global output. G7 markets cumulatively constitute the largest stock market group in terms of trading volume and market capitalization. Although the global pandemic has indiscriminately affected stock markets worldwide, the G7 markets have been most severely dented, despite a substantial variation in the number of infections among G7 countries. China and the US are the worst-hit countries from COVID-19 infections (Pata, Citation2020). Many financial and non-financial firms in G7 countries were severely affected by shocks emanated from the pandemic epicenter-China (Akhtaruzzaman et al., Citation2020). Although the pandemic originated in China, soon, it turned into a global economic slowdown while bringing about colossal losses for financial markets. Stock indices across the globe plummeted as a consequence (McKibbin & Fernando, Citation2020). In the US, the market-wide level 1 circuit-breaker was triggered four times in March 2020 to prevent massive crashes. On March 20, the S&P500 and Dow Jones Industrial Average (DJIA) indices plummeted by 29% and 33%, respectively (World Economic Forum, Citation2020). Pata (Citation2020) reports that the Dow 30 index in the US dropped by 21 percent over the three-month time since the first COVID-19 case was observed in the US on January 21, 2020. Moreover, the UK and Japan benchmark indices also experienced drops of more than 20% compared to December 2019 levels. Among G7 nations, Canada and Japan have the lowest number of infections; yet, their stock markets have experienced massive losses, with TSX and Nikkei 500 losing 21 percent and 19 percent, respectively, over the three months. In the same period, the French and German stock markets fell by 28 percent and 24 percent, respectively. By late April, the G7 countries accounted for 57 (65) percent of the total number of cases (deaths). Pata (Citation2020) reported that the G7 economies would face serious economic problems during and after the pandemic, as they are estimated to contract by 5.9 − 8.6 percent in 2020 (International Monetary Fund, Citation2020). Finally, the G7 countries show a great deal of heterogeneity in terms of their economic states and reactions to global stress periods during which safe-haven assets may also behave differently (Shahzad et al., Citation2020).
We employ the cross-quantilogram model of Han et al. (Citation2016) to explore the safe-haven potential of Islamic stocks against G7 markets. The model reveals that Islamic indices do not possess safe-haven properties for G7 stock markets in our full sample analysis. However, some diversification benefits, but no safe-haven prospects, were found for G7 markets during the GFC sub-sample period using the Shariah-compliant stocks. In contrast, Islamic stocks emerged as a strong safe-haven against G7 stock markets, excluding Japan, during the global pandemic crisis. Our first and foremost novelty pertains to the embryonic strand of literature searching for safe-haven assets during the COVID-19 pandemic (Corbet et al., 2020; Cheema et al., Citation2020). Building on this strand, the present study is novel in that it explicitly compares whether Islamic stocks continue to be safe-haven assets during the current pandemic, as they were during the GFC period (Aloui et al., Citation2018). Another contribution is towards studies, for instance, Shahzad et al. (Citation2020), investigating the safe-haven assets, such as gold and cryptocurrencies, against extreme movements in G7 markets. Methodologically, we provide empirical evidence that the cross-quantilogram successfully captures the safe-haven potential of Islamic stocks against G7 stock markets by accounting for non-linearity in their relationship, and hence contribute to the earlier works of Baumöhl and Lyócsa (Citation2017), Shahzad et al. (Citation2019); Shahzad et al. (Citation2019), Bouri et al. (Citation2020), and Ji et al. (Citation2020).
This paper is structured as follows. Section 2 includes the literature related to the topic. Section 3 describes the methodology, dataset and empirical findings parts of the paper. Section 5 concludes.
2. Literature review
In this section, we provide a brief overview of the literature related to the topic. Overall, the literature can be categorized into four different strands. The first stand comprises of the most recent works searching for safe-haven assets during the COVID-19 pandemic. The second strand answers why the performance of Islamic stocks can be better than their conventional counterparts. The third stand introduces the reader to the contradictory studies relating to the Islamic stocks' safe-haven potential during the crisis period, the GFC in particular. The fourth and the last strand summarises the studies in which the safe-haven potential of different assets has been tested against the G7 stock markets.
In the first stand, while a comprehensive review of the COVID-19 pandemic literature is provided by Cheema et al. (Citation2020), several studies motivate our research. Corbet et al. (2020) analyze investors' flight-to-safety behaviour during the COVID-19 and report that the relationships between the Chinese stock markets and the Bitcoin market evolved during the pandemic. However, neither Bitcoin nor gold offers significant hedging properties for investors. Yarovaya et al. (Citation2020a) study the reaction and the recovery of equity, bonds, precious metals, and cryptocurrency markets to the COVID-19 crisis shock, reporting a heterogeneous response of the sampled markets to this black swan event. Specifically, the evidence for gold suggests that gold has a weak ability to bounce back to the pre-COVID level and shows limited safe-haven properties. At the same time, cryptocurrencies, as a group, seem to disappoint in terms of assuring recovery from this significant shock.
More recently, Kinateder et al. (Citation2021) investigate the cross-asset safe-haven potential of the most popular asset markets, including commodities, sovereign bonds, and major currencies. Covering a sample of 100 days of the Covid-19 and GFC episodes, the authors witness the safe-haven potential of gold and sovereign bonds of the US, UK, and Germany. Another recent study by Salisu et al. (Citation2021) re-examines the safe-haven property of gold during the pandemic period, confirming the safe-haven characteristic of gold is superior to the US stocks and other precious metals, namely Platinum, Palladium, and Silver. Mariana et al. (Citation2021) utilize the WHO COVID-19 pandemic announcement to assess the safe-haven property of Bitcoin and Ethereum against stocks, finding the two largest cryptocurrencies to be safe havens against S&P 500 returns in the short-run. Yarovaya et al. (Citation2021) demonstrate that the Sukuk (Islamic bonds) carry safe-haven features during the pandemic and conventional-Islamic stock spillovers strengthened during the COVID-19 pandemic. Gupta et al. (Citation2021) suggest that hat US Treasury securities possess hedging and safe-haven potential against financial market uncertainty induced by the COVID-19 outbreak. Rubbaniy et al. (Citation2021) find a strong and positive correlation between ESG indices and COVID-19 fear index over the pandemic episode, confirming the safe-haven properties of ESG indices during the pandemic. By contributing to this literature, the present study tests the safe-haven potential of Islamic stocks against their conventional counterparts.
In the second strand, empirical evidence suggests that investment avenues adhering to Islamic finance rules performed better since the onset of the GFC (Hoepner et al., Citation2011; Ashraf, Citation2013; Saiti et al., Citation2014; and Masih et al., Citation2018; and Alam & Ansari, Citation2020). Islamic investments' superior performance is typically ascribed to the Shariah-based screening criteria, which leads to features such as the real economy-linkages and debt avoidance (Abedifar et al., Citation2015). Studies also show that low leverage portfolios/indices perform better under market downturns (Khan & Azmat, Citation2020). Islamic indices have a better stock selection, albeit with lower diversification (Boudt et al., Citation2019)Footnote4.
Prior studies in the third strand provide ample evidence on Islamic stock's safe-haven potential against conventional stock markets. However, given that studies are also suggesting otherwise, there is mixed evidence on Islamic stocks' safe-have potential. Ajmi et al. (Citation2014) study the presence of nonlinear causality between Islamic and conventional stock markets and their responsiveness to the economic and financial contagion on a global level. The findings indicate that Islamic stocks are not immune to various kinds of foreign shocks. Islamic financial instruments provide the limited safe-haven potential for their conventional counterparts and offer diversification benefits due to their fragility against external financial shocks. In contrast, Abbes and Trichilli (Citation2015) study the time-varying interdependence among a wide variety of developed and emerging Islamic equity markets under turbulent (2002-2007) and tranquil (post-GFC) periods. Their results document a reasonable potential for diversification through Islamic stocks, in the short-run, for both developed and emerging markets, although the opportunities were present during the turbulent episode.
Charles et al. (Citation2015) examine the effect of sharia filtering criteria on the riskiness of the Dow Jones Islamic Market (DJIM) index and conventional stock indices. The study reports that the large companies were eliminated from the investment portfolios for not adhering to the Shari'ah constraints. However, the remaining firms were the ones with more volatile prices, indicating that Islamic stocks are riskier than their conventional counterparts. Shamsuddin (Citation2014) follow different approaches to assess whether the DJIM industrial index and conventional sector indices are sensitive to interest rates. While finding different results, the study showed that, compared to their conventional counterparts, passively-run Islamic stocks produce superior returns. The author argues that Islamic stocks' superior performance is due to their screening criteria that concentrate more on real sectors such as industrial, consumer services, and technology sectors, which reduces the riskiness of Islamic stocks. Taking a global perspective, Ho et al. (Citation2014) conducted a comparative study for the risk-adjusted Islamic and conventional equity indices' performance. In order to validate performance, their sample included twelve global Islamic and conventional indices across eight nations. The results show that most Islamic and conventional indices failed to satisfy the Morgan Stanley world index's performance standards during the crisis period. Dewandaru et al. (Citation2015) implemented the wavelet coherence analysis to observe Islamic stocks' risk-and-return behaviour at various time-frequency bands. The authors found that both the Islamic and conventional stock markets exhibit similar behaviour towards risk; the behaviour is much stronger at higher frequency bands. For performance comparison purposes, Al-Khazali et al. (Citation2014) study DJIM country and regional indices and their conventional peers during and after the crisis episodes. The study found that, except for the European market, conventional indices perform better than their Islamic peers across all markets. During the crisis episode, however, Islamic indices outperform their conventional counterparts. To investigate the diversification potential of Islamic indices, Rizvi et al. (Citation2015), el Alaoui et al. (Citation2015), and Saiti et al. (Citation2014) utilize a battery of empirical models to uncover the time-varying dependence between global stocks and Islamic indices. These studies consider Islamic indices of several regions, including Saudi Arabia, developing markets, Asia, emerging markets, and the Gulf Cooperation Council (GCC). The results of these studies indicate that, compared to their conventional peers, Islamic indices offer better avenues for diversification, bearing implications for both domestic and international investors. These studies also supported the argument that Shariah compliance equips the Islamic financial system to protect against unforeseen crisis periods causing volatility. Ghazali et al. (Citation2015) and Mensi et al. (Citation2015), respectively, test the hedge and safe-haven properties of gold and Islamic stocks for GCC and Malaysian markets. The studies find that both gold and Islamic stocks show hedging potential under market downturns. Their findings suggest that diversifying global portfolios via gold or Islamic stocks will likely abate the portfolio's downside risk. Yarovaya et al. (Citation2020b) compare the Islamic and conventional equity funds during three sub-samples of the COVID-19 pandemic, showing that Islamic equity funds performed better than their conventional counterparts in terms of volatility timing, investments styles, and risk-adjusted-performance. The findings demonstrated the Islamic equity funds' resilience against the pandemic shocks.
Overall, there is mixed and even contradictory evidence on the safe-haven potential of Islamic stock against conventional counterparts, which demands a further exploration into this topic. Thus, our study is an attempt in this direction.
In the context of G7 economies, which constitutes the fourth literature strand related to our study, a few recent works have examined the safe-haven potential of gold and Bitcoin for conventional stock and bond markets. For instance, Shahzad et al. (Citation2019) investigate the safe-haven property of gold against G7 stock and bond markets. Using the novel cross-quantilogram and the value-at-risk (VaR) models, they found that gold is less (more) volatile relative to bond (stock) market innovations in G7 countries. The authors also found a significantly positive spillover effect directed from stock/bond markets to the gold markets under bearish market conditions, suggesting against the safe-haven potential of gold for the G7 stock/bond markets. Another study by Shahzad et al. (Citation2020) compares the safe-haven/hedging potential of gold and Bitcoin against G7 equity markets, suggesting that gold is safe-haven/hedge for all G7 markets. Bitcoin shows these features for Canada only. Both the hedging effectiveness and the conditional diversification benefit of gold are much superior to those of Bitcoin.
It is clear from the studies listed under this literature that investors have considered Islamic stock indices to satisfy their hedging and safe-haven objectives against conventional counterparts. While the evidence suggesting otherwise has also been found, support for Islamic stock's safe-haven properties has existed against many conventional stock markets worldwide and under multiple crisis episodes, particularly the GFC. However, the literature has paid little attention to testing whether Islamic stocks serve as safe-haven assets for the conventional equity markets of G7 countries. This is of paramount importance because the G7 stock markets have experienced huge losses due to the COVID-19 pandemic, as we highlighted above. More importantly, because of the well-documented support for the Islamic stocks as safe-haven assets during the GFC period, as well as due to the inherent distinctiveness and consequent resemblance between the two crises, this study examines whether the safe-haven potential of Islamic stocks prevails over the two crisis episodes and whether there are differences in this regard, and hence provide novel evidence to the existing literature.
3. Methodology, dataset, and empirical findings
This section provides a brief description of the cross-quantilogram, the dataset, and empirical findings. For mathematical details of the methodology, we refer the reader to the Appendix provided at the end.
3.1. Methodology
Methodologically, we apply the cross-quantilogram model to explore Islamic stocks' safe-haven properties against G7 conventional counterparts. The model allows one to concentrate on the lowest tails of the distribution rather than the whole distribution. Consequently, the model helps make inferences not only about the strong safe-haven potential of a given asset when stocks are in adverse market conditions (as in Baur & Lucey, Citation2010), but also when the safe-haven asset is going through extreme conditions. This gives a key advantage to the cross-quantilogram model over other linear association models, such as the wavelet coherence. Hence, it is a robust model to capture the nonlinear relationship between the two time-series. An advantage of the model Initially built by Linton and Whang (Citation2007) and subsequently extended into a bivariate framework by Han et al. (Citation2016), the cross-quantilogram is an easy-to-interpret model measuring the lead-lag correlation between two time series across their tails. The model has been employed by some recent works to successfully capture the safe-haven potential of gold and cryptocurrencies (Baumöhl & Lyócsa, Citation2017; Shahzad et al., Citation2019; Shahzad et al., Citation2019; Bouri et al., Citation2020; Ji et al., Citation2020). However, it has not been used to investigate the safe-haven properties of Islamic stocks.
3.2. Dataset
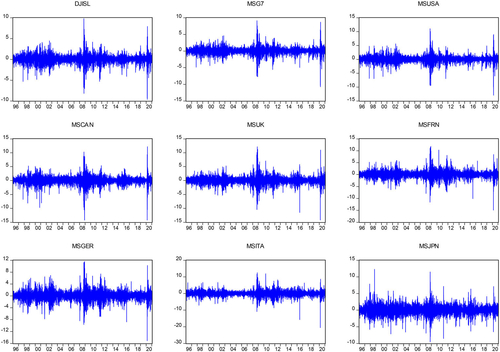
Our dataset consists of the Dow Jones Islamic world market (DJIM) index, MSCI G7 group, and individual country indices to proxy for Islamic and conventional equity investments, respectively. We use these indices given their importance and scope. For example, DJIM index represents the Islamic equity investments from around the world with 2752 constituents. The DJIM index constituents are screened based on revenues not exceeding 5% from activities involving such as alcohol, tobacco, pork-related products, conventional financial services, weapon, and defence equipment, and entertainment businesses (casinos, cinemas, music, and pornography)Footnote5. Besides, the G7 countries namely: Canada, France, Germany, Italy, Japan, the UK, and the US, represent the developed financial markets and account for two-third of global wealth and 40% of world’s output. In terms of stock market capitalization these countries account for more than two-third of global equity market capitalization (Shahzad et al., Citation2020). Hence, the selected indices encompass substantial equity market coverage for Islamic and conventional equity markets. The data period for this study spans from 02/01/1996 to 29/01/2021, covering the global financial (GFC) crisis period and the pandemic crisis period. presents the evolution of returns for the DJIM and G7 group and country indices that clearly show the impact of GFC and pandemic crisis on equity investments. A broad look at the graphs shows that the DJIM index experienced relatively lower unfavourable returns in the GFC and pandemic crisis periods than most of the G7 markets.
Figure 1. Evolution of DJIM World and MSCI G7 group and country indices returns.
Note: Data spans from 2/01/1996 to 29/01/2021.
presents the descriptive statistics of daily index returns for the DJIM index, G7 group index, and country-wise stock index of each G7 country. Our results show that the DJIM index outperforms all the G7 stock indices in terms of average returns except for the USA index, which exhibits return equivalent to the DJIM index. Among G7 country indices, Japan and Italy present the lowest average returns while the USA and Canada exhibit the highest returns. Besides descriptive statistics, also presents the Jarque-Bera (JB) and Augmented Dicky-Fuller (ADF) test statistics that reject the null hypotheses of normality and the presence of unit-root in each time series, respectively. Further, Brock, Dechert, and Scheinkman (BDS) test statistics presented in indicate the presence of non-linearity in each time series under consideration, signifying the precondition to employ nonlinear methodologies to understand the relationship dynamics between Islamic and conventional equity indices’ returns.
Table 1. Descriptive statistics and unit root.
Table 2. BDS test of non-linearity.
3.3. Cross-quantilogram analysis
We employ the cross-quantilogram technique to determine the nonlinear lead-lag association between Islamic index returns and the conventional equity index of the G7 group and individual G7 countries. We present results for the whole sample, GFC, and pandemic crisis periods to determine the dynamics of Islamic equities and traditional stocks association under only two market conditions. The estimation results are presented in the form of heat maps that show DJIM and G7 equity returns on the y-axis and x-axis, respectively. We choose to present the results in the form of heat maps as it offers an appropriate and comprehensive snapshot of the entire quantile dependence structure by netting 121 measures of bivariate dependence in a single graphFootnote6. Additionally, the magnitude and direction of interdependence are captured by a convenient colour scheme that helps to interpret a complex phenomenon more easily. Concerning the colour scheme, blue, red, and green colours characterize a negative, positive, and neutral association, respectively.
In the heat map setting, we consider DJIM to be a definite safe-haven for a G7 stock index under two scenarios. First, the top left corner of a heat map contains significant negative estimates, i.e., unfavourable returns of G7 stock indices are followed by highly positive returns of the Islamic index in the future (number of days controlled by lag lengths). Second, if the entire distribution of a heat map shows a complete disconnect between the Islamic index and a G7 index, i-e only green and blue colours are present in the entire heat map.
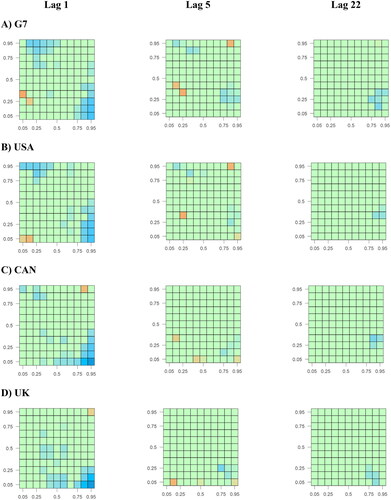
presents the full sample cross-quantilogram results for the G7 group index and all G7 individual country indices. In column 1, which shows the results for a 1-day lead-lag association, we observe a substantial presence of red colour in the entire quantile distribution for the G7 group index and individual country indices. This observation indicates a significant positive lead-lag dependence between current and next day returns of conventional G7 and Islamic stocks, respectively. Thus, Islamic equity investments do not offer any safe-haven avenues for the G7 conventional equity investors in the full sample analysis. Our results corroborate with Ahmad et al. (Citation2018), Rejeb (Citation2017), Naifar (Citation2016), and Razak et al. (Citation2016), those also found a positive dependence structure between Islamic and conventional equity investment using a variety of equity indices for both investment types.
Figure 2. Heat maps of cross-correlation between daily DJIM World Index and MSCI G7 Stocks – Full sample.
Note: These figures show the CQ in the form of heat maps. The quantile levels with no significant directional predictability are set to zero. The coloured rectangles are the predictable regions where the Box–Ljung test statistic is statistically significant. In each heat map, the horizontal axis represents G7 Stock return quantiles, while the vertical axis represents DJIM World return quantiles.
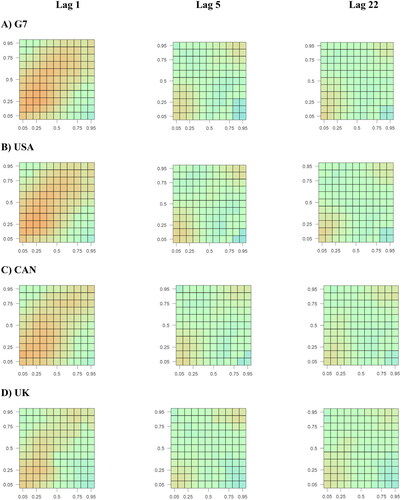
Further, to check the robustness of our results, we extend the estimation of cross-quantilogram to higher lead-lags of a week (5 days) and month (22 days). Heat maps presented in columns 2 and 3 of show a similar but less pronounced dependence structure between Islamic and conventional G7 equity indices, specifying that both investments are weakly interdependent in the long-run. However, the suggestion of decoupling (Usman et al., Citation2019, Shahzad et al., Citation2017) between Islamic and conventional equity investments is not detected for full sample analysis during short and long lead-lag scenarios.
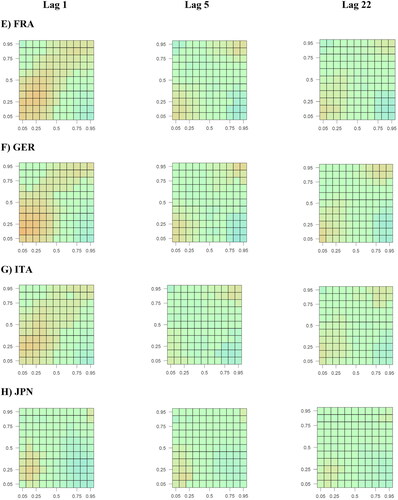
Moreover, we present sub-sample analyses to ascertain the interdependence between DJIM and G7 indices during the crisis periods, i.e., the GFC and global pandemic crisis. The existing literature shows contradicting evidence on the safe-haven properties of Islamic equity investments during a crisis period. For example, Azad et al. (Citation2018) and Hkiri et al. (Citation2017) suggest that Islamic equity investments provide shelter to conventional counterparts during turbulent times. Conversely, Cevik and Bugan (Citation2018), Dania and Malhotra (Citation2013), Hammoudeh et al. (Citation2014), and Mezghani and Boujelbène (Citation2018) report opposing evidence on the ability of Islamic investments to provide safe-haven avenues to conventional equity investments amid market-wide turbulence.
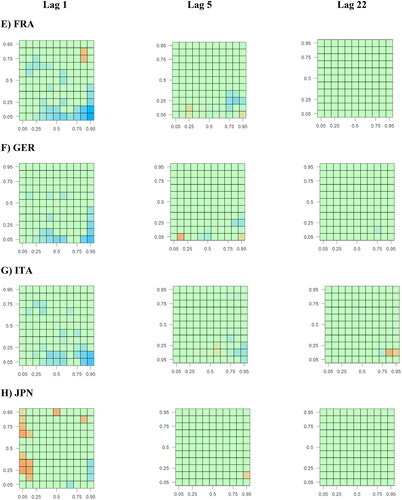
The GFC period results presented in exhibits a weak positive association between world DJIM and G7 group index and G7 country indices. Specifically, the red colour is omnipresent in lower left quantiles of the heat maps for the G7 group index, and all the G7 country indices expect for Japanese index that exhibits a neutral association. This observation suggests that Islamic equity investments did not protect conventional G7 equity investment in a market-wide turmoil during the GFC. Our results are in line with Dania and Malhotra (Citation2013) and Hammoudeh et al. (Citation2014), those report the nonexistence of safe-haven potential in Shariah-based equity investments during the GFC. Moreover, Yilmaz et al. (Citation2015) contend that increased demand and rapid financialization of faith-based investments have increased the interdependence between conventional and Islamic investments. Nevertheless, we observe a disconnection between DJIM and G7 indices in middle quantiles under higher lead-lag settings, reinforcing the existing evidence that Islamic stocks offer diversification opportunities for conventional equity investors (Trabelsi & Naifar, Citation2017; Bahloul et al., Citation2017; Saiti et al., Citation2019).
Figure 3. Heat maps of cross-correlation between daily DJIM World Index and MSCI G7 Stocks – Global Financial Crisis.
Note: Refer to note for figure description
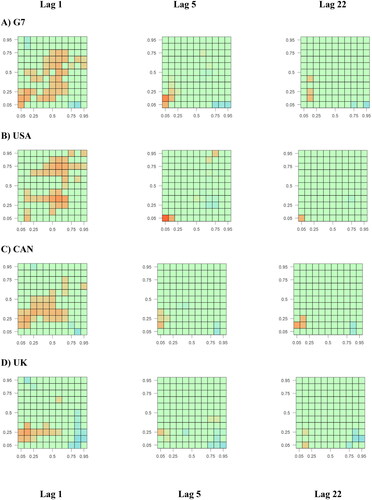
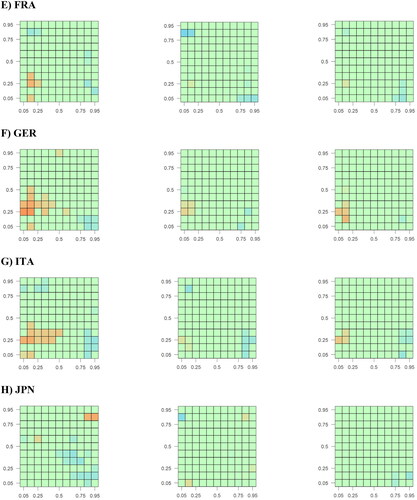
Next, we turn to the pandemic crisis period that is exhibiting a disastrous impact on financial markets around the world. During the pandemic, the global equity markets continue to be highly contagious and provide the best settings to evaluate the safe-haven properties of an asset.
The pandemic crisis period results presented in show several stimulating changes in the lead-lag association between DJIM and G7 group and country indices during the pandemic crisis period. First, we witness the disappearance of red colours from the heat maps for almost all the pairs in short and long lead-lag dependence except for the Japanese index. Second, a significant negative association is observed in the upper left corner for the G7 group index along with the USA and Canada equity indices. This finding indicates that a significantly positive future return from DJIM trails significantly negative returns of these indices, confirming the safe-haven properties of DJIM for these markets in the pandemic crisis period. Third, we also find either complete disassociation or negative interdependence between DJIM and G7 country indices in lower return quantiles. This observation specifies that during the pandemic crisis, Islamic stocks are either entirely disentangled from the traditional equity market or take an opposing path when the overall equity market goes into turmoil. In the similar vein, Sherif (2020) report that faith-based investment outperformed their conventional counterparts in the UK market during the ongoing pandemic crisis. These findings agree with the arguments presented by Azad et al. (Citation2018) and Ebrahim et al. (Citation2016) that due to their inherent characteristics such as lower leverage, and larger presence in slow responding markets, Islamic stocks perform better during a crisis than conventional counterparts. Moreover, the disconnection between Islamic and conventional stock in lower return quantiles also confirms the decoupling hypothesis, which suggest that these investments take opposing paths during bearish market conditions (Ahmad et al., Citation2018, Hkiri et al., Citation2017). Lastly, the decoupling of the two investment types continues to hold when we consider longer lag lengths of a weak and month period.
Figure 4. Heat maps of cross-correlation between daily DJIM World Index and MSCI G7 Stocks – COVID-19 Pandemic Crisis.
Note: Refer to note for figure description
3.4. Time-varying cross-quantilogram analysis
The Islamic equity investments have gone through several changes during the sample period, and its unique risk-aversion features have attracted the attention of equity investors around the world. The Islamic equity indices were first developed in the late 1990s and continued to grow ever since with the introduction of many country-level, regional, and global indices. Moreover, the magnitude of the Islamic funds stood at US$60 billion in 2018 and projected to grow at a higher growth rateFootnote7. Due to these developments and the rapid financialization of Islamic investments, the interdependence between Islamic and conventional equity investments has increased over time (Yilmaz et al., Citation2015).
We turn to the time-varying cross-quantile correlation analysis to explore the changes in the lead-lag association between the DJIM world and the G7 group and country indices during the sample period. We employ recursive sampling with 22 days rolling window to estimate the time-varying correlation in each step, and the estimation process continues similarly until the last observation of the sample. presents the results for time-varying correlations wherein the left, middle and right column contain the lower (0.05), middle (0.5), and upper (0.95) quantiles of DJIM index and red, green and blue lines show the lower, middle and upper quantiles G7 group/country index. The vertical and horizontal axis presents the quantile hits of the DJIM market and time, respectively.
Figure 5. Recursive CQ between daily DJIM World Index and MSCI G7 Stocks returns.
Note: The vertical (horizontal) axis represents the quantile hits for the G7 market (time). The starting year of the rolling window is marked on the horizontal axis. The left, middle, and right columns, respectively, show the 5%, 50%, and 95% quantiles for the DJIM World Index while, the red, blue, and green lines represent the 5%, 50%, and 95% quantiles for the G7 returns. Lag p = 1.
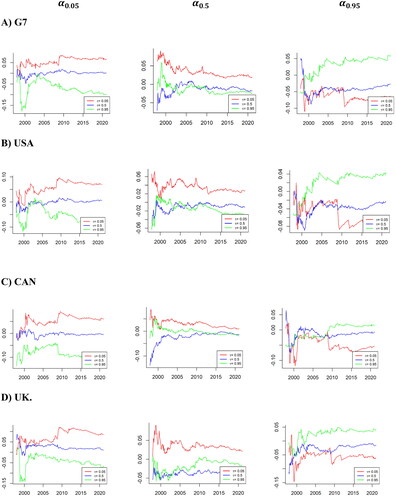
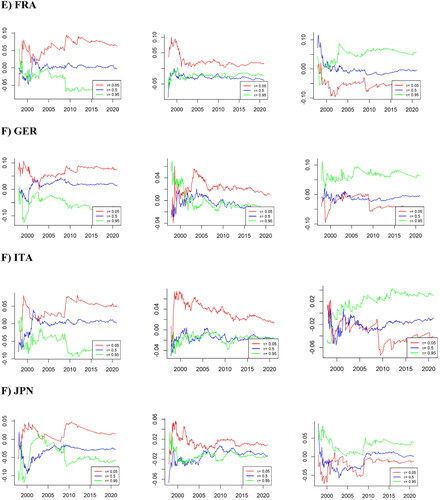
A broader look at the graphical results would observe a negative lead-lag association between divergent return quantiles of the DJIM index and G7 group and country indices. For example, the lower quantiles of the G7 group index show a negative association with the upper and middle quantiles of DJIM during the whole sample. Additionally, a closer look at the GFC and pandemic crisis periods reveals the significant surge in the negative association, which shows Islamic stocks take an opposing path when conventional equity investments go into bearish periods. These observations confirm our explanation of the potential safe-haven avenue offered by Islamic stocks in times of market-wide turmoil. Moreover, the parallel middle return quantiles of the DJIM index and G7 indices also show a neutral to a weak negative association, indicating Islamic stocks could also serve as potential diversification assets for conventional equity investments during average market conditions.
4. Conclusion
The COVID-19 global pandemic not only disrupted the social lives of billions, but it has also caused severe contagion in the financial markets around the world, constraining investors to safe-haven assets. In this setting, we explore Islamic equity investments' safe-haven properties against their conventional counterparts in G7 countries. Additionally, we compare and contrast the safe-haven potential of Islamic investments during the pandemic and the GFC crises episodes. To this end, we apply the cross-quantilogram method to measure lead-lag quantile-based dependence between DJIM and G7 group and G7 country indices using a sample period that covers both the GFC and global pandemic crises.
Our full sample analysis reveals that Islamic indices do not possess safe-haven properties for the G7 group index and any of the G7 country indices. Moreover, the GFC sub-sample analysis shows that Shariah-based investments provided limited diversification benefits to conventional equity investors in the G7 economies. However, there is no evidence to suggest that Islamic investments provided shelter to their counterparts in highly unfavourable market conditions during the GFC. Further, our global pandemic crisis sub-sample analysis shows that Islamic investments emerged as a robust safe-haven asset for conventional equity investors in the G7 countries except for the Japanese equity market that is also the country least affected by the COVID-19 pandemic relative to other G7 countries.
Our study offers several insights for equity investors and regulators to implement changes that would increase the resilience of equity investments and the overall financial system, amid a financial downturn. First, our findings suggest that due to lower return interdependence between Islamic and conventional equity investments, the conventional equity investors in developed financial markets could improve the resilience of their equity portfolios both in normal and bearish market conditions by diversifying into Islamic stocks. Second, pro-social attributes of Islamic investment such as non-involvement in drugs and weapon businesses, make them a potential compliment for socially responsible investment. Hence, Islamic investments could also support the transition towards socially responsible investing in the post-COVID period. Third, financial market regulators can improve the overall risk management of financial system by encouraging conventional firms to manage their leverage and risk profiles more robustly as practised by Shariah-compliant firms.
The findings of our study should be interpreted in accordance with the sample choice that is limited to Islamic and conventional equity investments. Additionally, our sample of equity investments only represent developed financial markets. These limitations of our chosen sample indicate the need for future studies to extend the sample into developing and emerging markets. Moreover, future studies can also explore the safe-haven and diversification properties of other classes of Islamic investments i.e., Sukuk bonds.
Competing interest
The authors declare having no conflict of interest.
Availability of data
The data for this study is available upon request.
Additional information
Funding
Notes
1 Some studies have also examined the effects of COVID-19 on mutual funds (Mirza et al., Citation2020). Yarovaya et al., Citation2021; Mirza et al., Citation2020), corporate solvency (Mirza et al., Citation2020), and asset management (Rizvi et al., Citation2020).
2 Although some studies also indicate against their safe-haven potential during the GFC (Dania and Malhotra, 2013; Hammoudeh et al., Citation2014; Cevik and Bugan, 2018; and Mezghani & Boujelbène, Citation2018)
3 In 2012, the total sharia-compliant assets, including the Islamic stocks- the driving force of the Islamic finance industry-reached US $1.27 trillion. The global growth of the Islamic financial markets had continued unabated during 2014, with assets under the management of global Islamic funds growing by 5.3 percent. Shortly before the COVID-19 outbreak, the S&P Global Ratings (2019) had projected the Islamic finance industry to grow, albeit slowly, in 2020, while the total assets had continued to grow by 10 percent and 2 percent in 2017 and 2018, respectively.
4 Although some studies also argue that the outperformance of Islamic stocks is both period- and benchmark-dependent (Elfakhani et al., Citation2007), while others contend that it also depends upon the Sharia filtering principals used (Ashraf, Citation2016).
5 For details see https://www.spglobal.com/spdji/en/indices/equity/dow-jones-islamic-market-world-index/#overview
6 The detailed tabular results are available upon request.
References
- Abbes, M. B., & Trichilli, Y. (2015). Islamic stock markets and potential diversification benefits. Borsa Istanbul Review, 15(2), 93–105. https://doi.org/10.1016/j.bir.2015.03.001
- Abedifar, P., Ebrahim, S. M., Molyneux, P., & Tarazi, A. (2015). Islamic banking and finance: Recent empirical literature and directions for future research. Journal of Economic Surveys, 29(4), 637–670. https://doi.org/10.1111/joes.12113
- Ahmad, W., Rais, S., & Shaik, A. R. (2018). Modelling the directional spillovers from DJIM Index to conventional benchmarks: Different this time? The Quarterly Review of Economics and Finance, 67, 14–27. https://doi.org/10.1016/j.qref.2017.04.012
- Ajmi, A. N., Hammoudeh, S., Nguyen, D. K., & Sarafrazi, S. (2014). How strong are the causal relationships between Islamic stock markets and conventional financial systems? Evidence from linear and nonlinear tests. Journal of International Financial Markets, Institutions and Money, 28, 213–227. https://doi.org/10.1016/j.intfin.2013.11.004
- Akhtaruzzaman, M., Boubaker, S., Lucey, B. M., & Sensoy, A. (2020). Is gold a hedge or safe haven asset during COVID–19 crisis?. Available at SSRN 3621358.
- Akhtaruzzaman, M., Boubaker, S., & Sensoy, A. (2020). Financial contagion during COVID–19 crisis. Finance Research Letters, 38, 101604.
- Alam, M., & Ansari, V. A. (2020). Are Islamic indices a viable investment avenue? An empirical study of Islamic and conventional indices in India. International Journal of Islamic and Middle Eastern Finance and Management, 13 (3), 503–518. https://doi.org/10.1108/IMEFM-03-2019-0121
- Albulescu, C. T. (2021). COVID-19 and the United States financial markets' volatility. Finance Research Letters, 38, 101699. https://doi.org/10.1016/j.frl.2020.101699
- Al-Khazali, O., Lean, H. H., & Samet, A. (2014). Do Islamic stock indexes outperform conventional stock indexes? A stochastic dominance approach. Pacific-Basin Finance Journal, 28, 29–46. Vol https://doi.org/10.1016/j.pacfin.2013.09.003
- Aloui, C., Jammazi, R., & Hamida, H. B. (2018). Multivariate co-movement between Islamic stock and bond markets among the GCC: a wavelet-based view. Computational Economics, 52(2), 603–626. Vol No https://doi.org/10.1007/s10614-017-9703-7
- Ashraf, D. (2013). Performance evaluation of Islamic mutual funds relative to conventional funds: Empirical evidence from Saudi Arabia. International Journal of Islamic and Middle Eastern Finance and Management, 6 (2), 105–121. . https://doi.org/10.1108/17538391311329815
- Ashraf, D. (2016). Does Shari'ah Shari'ah screening cause abnormal returns? Empirical evidence from Islamic equity indices. Journal of Business Ethics, 134(2), 209–228. https://doi.org/10.1007/s10551-014-2422-2
- Aslam, F., Mohmand, Y. T., Ferreira, P., Memon, B. A., Khan, M., & Khan, M. (2020). Network analysis of global stock markets at the beginning of the coronavirus disease (Covid-19) outbreak. Borsa Istanbul Review, 20, S49–S61. https://doi.org/10.1016/j.bir.2020.09.003
- Azad, A., Azmat, S., Chazi, A., & Ahsan, A. (2018). Sailing with the non-conventional stocks when there is no place to hide. Journal of International Financial Markets, Institutions and Money, 57, 1–16. https://doi.org/10.1016/j.intfin.2018.04.001
- Bahloul, S., Mroua, M., & Naifar, N. (2017). Further evidence on international Islamic and conventional portfolios diversification under regime switching. Applied Economics, 49(39), 3959–3978. https://doi.org/10.1080/00036846.2016.1273496
- Baker, S. R., Bloom, N., Davis, S. J., Kost, K., Sammon, M., & Viratyosin, T. (2020). The unprecedented stock market reaction to COVID-19. The Review of Asset Pricing Studies, 10(4), 742–758.
- Baumöhl, E., & Lyócsa, Š. (2017). Directional predictability from stock market sector indices to gold: A cross-quantilogram analysis. Finance Research Letters, 23, 152–164. https://doi.org/10.1016/j.frl.2017.02.013
- Baur, D. G., & Lucey, B. M. (2010). Is gold a hedge or a safe haven? An analysis of stocks, bonds and gold. Financial Review, 45(2), 217–229. https://doi.org/10.1111/j.1540-6288.2010.00244.x
- Baur, D. G., & McDermott, T. K. (2010). Is gold a safe haven? International evidence. Journal of Banking & Finance, 34(8), 1886–1898. https://doi.org/10.1016/j.jbankfin.2009.12.008
- Boudt, K., Raza, M. W., & Ashraf, D. (2019). Macro-financial regimes and performance of Shariah-compliant equity portfolios. Journal of International Financial Markets, Institutions and Money, 60, 252–266. https://doi.org/10.1016/j.intfin.2019.01.001
- Bouri, E., Shahzad, S. J. H., & Roubaud, D. (2020). Cryptocurrencies as hedges and safe-havens for US equity sectors. The Quarterly Review of Economics and Finance, 75, 294–307.Volhttps://doi.org/10.1016/j.qref.2019.05.001
- Broock, W. A., Scheinkman, J. A., Dechert, W. D., & LeBaron, B. (1996). A test for independence based on the correlation dimension. Econometric Reviews, 15(3), 197–235. https://doi.org/10.1080/07474939608800353
- Carlsson-Szlezak, P., Reeves, M., & Swartz, P. (2020). What coronavirus could mean for the global economy. Harvard Business Review, 3, 1–10.
- Cevik, E. I., & Bugan, M. F. (2018). Regime-dependent relation between Islamic and conventional financial markets. Borsa Istanbul Review, 18(2), 114–121. https://doi.org/10.1016/j.bir.2017.11.001
- Charles, A., Darné, O., & Pop, A. (2015). Risk and ethical investment: Empirical evidence from Dow Jones Islamic indexes. Research in International Business and Finance, 35, 33–56. https://doi.org/10.1016/j.ribaf.2015.03.003
- Cheema, M. A., Faff, R. W., & Szulczuk, K. (2020). The 2008 Global Financial Crisis and COVID-19 Pandemic: How Safe are the Safe Haven Assets? Covid Economics, Vetted and Real-Time Papers, 34, 88–115.
- Colombo, J. A., & Lazzari, M. R.. (2020). Same, but different? A state-level chronology of the 2014-2016 Brazilian economic recession and comparisons with the GFC and (early data on) COVID-19”. Economics Bulletin, 40(3), 2445–2456.
- Conlon, T., Corbet, S., & McGee, R. J. (2020). Are Cryptocurrencies a Safe Haven for Equity Markets? An International Perspective from the COVID-19 Pandemic. Research in International Business and Finance, 54, 101248. https://doi.org/10.1016/j.ribaf.2020.101248
- Conlon, T., & McGee, R. (2020). Safe haven or risky hazard? Bitcoin during the COVID-19 bear market (pp. 101607). Finance Research Letters.
- Corbet, S., Hou, Y., Hu, Y., Lucey, B., & Oxley, L. (2020a). Aye Corona! The contagion effects of being named Corona during the COVID-19 pandemic. Finance Research Letters, 38, 101591. https://doi.org/10.1016/j.frl.2020.101591
- Corbet, S., Larkin, C., & Lucey, B. (2020b). The contagion effects of the covid-19 pandemic: Evidence from gold and cryptocurrencies. Finance Research Letters, 35, 101554. https://doi.org/10.1016/j.frl.2020.101554
- Dania, A., & Malhotra, D. (2013). An Empirical Examination of the Dynamic Linkages of Faith-Based Socially Responsible Investing. The Journal of Wealth Management, 16(1), 65–79. https://doi.org/10.3905/jwm.2013.16.1.065
- Dewandaru, G., Bacha, O. I., Masih, A. M. M., & Masih, R. (2015). Risk-return characteristics of Islamic equity indices: Multi-timescales analysis. Journal of Multinational Financial Management, 29, 115–138. https://doi.org/10.1016/j.mulfin.2014.11.006
- Ebrahim, M. S., Jaafar, A., Omar, F. A., & Salleh, M. O. (2016). Can Islamic injunctions indemnify the structural flaws of securitized debt? Journal of Corporate Finance, 37, 271–286. https://doi.org/10.1016/j.jcorpfin.2016.01.002
- el Alaoui, A. O., Dewandaru, G., Rosly, S. A., & Masih, M. (2015). Linkages and co-movement between international stock market returns: Case of Dow Jones Islamic Dubai Financial Market index. Journal of International Financial Markets, Institutions and Money, 36, 53–70. https://doi.org/10.1016/j.intfin.2014.12.004
- Elfakhani, S. M., Hassan, M. K., & Sidani, Y. M. (2007). 16 Islamic mutual funds. In M.K. Hassan (Ed.), Handbook of Islamic banking (pp.256–273). Edward Elgar.
- Feng, W., Wang, Y., & Zhang, Z. (2018). Can cryptocurrencies be a safe haven: a tail risk perspective analysis. Applied Economics, 50(44), 4745–4762. Nohttps://doi.org/10.1080/00036846.2018.1466993
- Forum, W. E. (2020). Mad March: how the stock market is being hit by COVID-19.
- Ghazali, M. F., Lean, H. H., & Bahari, Z. (2015). Sharia compliant gold investment in Malaysia: Hedge or safe haven? Pacific-Basin Finance Journal, 34, 192–204. https://doi.org/10.1016/j.pacfin.2014.12.005
- Goodell, J. W. (2020). COVID-19 and finance: Agendas for future research. Finance Research Letters, 35, 101512. https://doi.org/10.1016/j.frl.2020.101512
- Guo, Y., Li, P., & Li, A. (2021). Tail risk contagion between international financial markets during COVID-19 pandemic. International Review of Financial Analysis, 73, 101649. https://doi.org/10.1016/j.irfa.2020.101649
- Gupta, R., Subramaniam, S., Bouri, E., & Ji, Q. (2021). Infectious disease-related uncertainty and the safe-haven characteristic of US treasury securities. International Review of Economics & Finance, 71, 289–298. https://doi.org/10.1016/j.iref.2020.09.019
- Hammoudeh, S., Mensi, W., Reboredo, J. C., & Nguyen, D. K. (2014). Dynamic dependence of the global Islamic equity index with global conventional equity market indices and risk factors. Pacific-Basin Finance Journal, 30, 189–206. https://doi.org/10.1016/j.pacfin.2014.10.001
- Han, H., Linton, O., Oka, T., & Whang, Y. J. (2016). The cross-quantilogram: Measuring quantile dependence and testing directional predictability between time series. Journal of Econometrics, 193(1), 251–270. https://doi.org/10.1016/j.jeconom.2016.03.001
- Hkiri, B., Hammoudeh, S., Aloui, C., & Yarovaya, L. (2017). Are Islamic indexes a safe haven for investors? An analysis of total, directional and net volatility spillovers between conventional and Islamic indexes and importance of crisis periods. Pacific-Basin Finance Journal, 43, 124–150. https://doi.org/10.1016/j.pacfin.2017.03.001
- Ho, C. S. F., Abd Rahman, N. A., Yusuf, N. H. M., & Zamzamin, Z. (2014). Performance of global Islamic versus conventional share indices: International evidence. Pacific-Basin Finance Journal, 28, 110–121. Volhttps://doi.org/10.1016/j.pacfin.2013.09.002
- Hoepner, A. G., Rammal, H. G., & Rezec, M. (2011). Islamic mutual funds' funds' financial performance and international investment style: evidence from 20 countries. The European Journal of Finance, 17(9-10), 829–850. https://doi.org/10.1080/1351847X.2010.538521
- Islamic Finance Outlook. (2019). https://ceif.iba.edu.pk/pdf/Islamic_Finance_201911.pdf
- Ji, Q., Zhang, D., & Zhao, Y. (2020). Searching for safe-haven assets during the COVID-19 pandemic. International Review of Financial Analysis, 71, 101526. https://doi.org/10.1016/j.irfa.2020.101526
- Khan, S., & Azmat, S. (2020). Debt externality in equity markets: Leveraged portfolios and Islamic indices. International Review of Economics & Finance, 69, 152–177. https://doi.org/10.1016/j.iref.2020.05.004
- Kinateder, H., Campbell, R., & Choudhury, T. (2021). Safe haven in GFC versus COVID-19: 100 turbulent days in the financial markets. Finance Research Letters, 101951. https://doi.org/10.1016/j.frl.2021.101951
- Koenker, R., & Bassett Jr, G. (1978). Regression quantiles. Econometrica: journal of the Econometric Society, 46(1), 33–50.
- Linton, O., & Whang, Y. J. (2007). The quantilogram: With an application to evaluating directional predictability. Journal of Econometrics, 141(1), 250–282. Vol Nohttps://doi.org/10.1016/j.jeconom.2007.01.004
- Mariana, C. D., Ekaputra, I. A., & Husodo, Z. A. (2021). Are Bitcoin and Ethereum safe-havens for stocks during the COVID-19 pandemic? Finance Research Letters, 38, 101798. https://doi.org/10.1016/j.frl.2020.101798
- Masih, M., Kamil, N. K., & Bacha, O. I. (2018). Issues in Islamic equities: A literature survey. Emerging Markets Finance and Trade, 54(1), 1–26. https://doi.org/10.1080/1540496X.2016.1234370
- McKibbin, W. J., & Fernando, R. (2020). The Global Macroeconomic Impacts of COVID-19: Seven Scenarios. CAMA Working Paper No. 19/2020, https://doi.org/10.2139/ssrn.3547729.
- Mensi, W., Hammoudeh, S., Reboredo, J. C., & Nguyen, D. K. (2015). Are Sharia stocks, gold and US Treasury hedges and/or safe havens for the oil-based GCC markets. Emerging Markets Review, 24, 101–121. https://doi.org/10.1016/j.ememar.2015.05.007
- Mezghani, T., & Boujelbène, M. (2018). The contagion effect between the oil market, and the Islamic and conventional stock markets of the GCC country: Behavioral explanation. International Journal of Islamic and Middle Eastern Finance and Management, 11 (2), 157–181. https://doi.org/10.1108/IMEFM-08-2017-0227
- Mirza, N., Hasnaoui, J. A., Naqvi, B., & Rizvi, S. K. A. (2020). The impact of human capital efficiency on Latin American mutual funds during Covid-19 outbreak. Swiss Journal of Economics and Statistics, 156(1), 1–7. https://doi.org/10.1186/s41937-020-00066-6
- Mirza, N., Naqvi, B., Rahat, B., & Rizvi, S. K. A. (2020). Price reaction, volatility timing and funds' performance during Covid-19. Finance Research Letters, 36, 101657. https://doi.org/10.1016/j.frl.2020.101657
- Mirza, N., Rahat, B., Naqvi, B., & Rizvi, S. K. A. (2020). Impact of Covid-19 on corporate solvency and possible policy responses in the EU. The Quarterly Review of Economics and Finance, https://doi.org/10.1016/j.qref.2020.09.002
- Naifar, N. (2016). Do global risk factors and macroeconomic conditions affect global Islamic index dynamics? A quantile regression approach. The Quarterly Review of Economics and Finance, 61, 29–39. https://doi.org/10.1016/j.qref.2015.10.004
- Pata, U. K. (2020). Is the COVID-19 Pandemic a Financial Disaster for G7 Countries? Evidence from a Fourier Cointegration Test. available at: https://ssrn.com/abstract=3603068.
- Razak, R. A., Ismail, N., & Aridi, N. A. (2016). Is Islamic stock market no different than conventional stock market? An evidence from Malaysia. International Business Management, 10(17), 3914–3920.
- Rejeb, A. B. (2017). On the volatility spillover between lslamic and conventional stock markets: A quantile regression analysis. Research in International Business and Finance, 42, 794–815.
- Rizvi, S. A. R., Arshad, S., & Alam, N. (2015). Crises and contagion in Asia Pacific—Islamic v/s conventional markets. Pacific-Basin Finance Journal, 34, 315–326. https://doi.org/10.1016/j.pacfin.2015.04.002
- Rizvi, S. K. A., Mirza, N., Naqvi, B., & Rahat, B. (2020). Covid-19 and asset management in EU: A preliminary assessment of performance and investment styles. Journal of Asset Management, 21(4), 281–291. https://doi.org/10.1057/s41260-020-00172-3
- Roy, S., & Kemme, D. M. (2020). The run-up to the global financial crisis: A longer historical view of financial liberalization, capital inflows, and asset bubbles. International Review of Financial Analysis, 69, 101377. https://doi.org/10.1016/j.irfa.2019.101377
- Rubbaniy, G., Khalid, A. A., Ali, S., & Naveed, M. (2021). Are ESG stocks safe-haven during COVID-19?. Available at SSRN 3779430.
- Saiti, B., Bacha, O. I., & Masih, M. (2014). The diversification benefits from Islamic investment during the financial turmoil: The case for the US-based equity investors. Borsa Istanbul Review, 14(4), 196–211. https://doi.org/10.1016/j.bir.2014.08.002
- Saiti, B., Ma, Y., Nagayev, R., & Yumusak, İG. (2019). The diversification benefit of Islamic investment to Chinese conventional equity investors: Evidence from the multivariate GARCH analysis. International Journal of Islamic and Middle Eastern Finance and Management, 13 (1), 1–23. https://doi.org/10.1108/IMEFM-01-2018-0014
- Salisu, A. A., Raheem, I. D., & Vo, X. V. (2021). Assessing the safe haven property of the gold market during COVID-19 pandemic. International Review of Financial Analysis, 74, 101666. https://doi.org/10.1016/j.irfa.2021.101666
- Shahzad, S. J. H., Bouri, E., Roubaud, D., & Kristoufek, L. (2020). Safe haven, hedge and diversification for G7 stock markets: Gold versus bitcoin. Economic Modelling, 87, 212–224. https://doi.org/10.1016/j.econmod.2019.07.023
- Shahzad, S. J. H., Bouri, E., Roubaud, D., Kristoufek, L., & Lucey, B. (2019). Is Bitcoin a better safe-haven investment than gold and commodities? International Review of Financial Analysis, 63, 322–330. https://doi.org/10.1016/j.irfa.2019.01.002
- Shahzad, S. J. H., Ferrer, R., Ballester, L., & Umar, Z. (2017). Risk transmission between Islamic and conventional stock markets: A return and volatility spillover analysis. International Review of Financial Analysis, 52, 9–26. https://doi.org/10.1016/j.irfa.2017.04.005
- Shahzad, S. J. H., Raza, N., Roubaud, D., Hernandez, J. A., & Bekiros, S. (2019). Gold as Safe Haven for G-7 Stocks and Bonds: A Revisit. Journal of Quantitative Economics, 17(4), 885–912. https://doi.org/10.1007/s40953-019-00163-1
- Shamsuddin, A. (2014). Are Dow Jones Islamic equity indices exposed to interest rate risk. Economic Modelling, 39, 273–281. https://doi.org/10.1016/j.econmod.2014.03.007
- Sharif, A., Aloui, C., & Yarovaya, L. (2020). COVID-19 pandemic, oil prices, stock market, geopolitical risk and policy uncertainty nexus in the US economy: Fresh evidence from the wavelet-based approach. International Review of Financial Analysis, 70, 101496. https://doi.org/10.1016/j.irfa.2020.101496
- Trabelsi, N., & Naifar, N. (2017). Are Islamic stock indexes exposed to systemic risk? Multivariate GARCH estimation of CoVaR. Research in International Business and Finance, 42, 727–744. https://doi.org/10.1016/j.ribaf.2017.07.013
- Usman, M., Jibran, M. A. Q., Amir-Ud-Din, R., & Akhter, W. (2019). Decoupling hypothesis of Islamic stocks: Evidence from copula CoVaR approach. Borsa Istanbul Review, 19, S56–S63. https://doi.org/10.1016/j.bir.2018.09.001
- Welling, J. (2020). S&P and Dow Jones Islamic Indices Continue Outperformance in Q1 2020. available at https://www.spglobal.com/en/research-insights/articles/sp-and-dow-jonesislamic-indices-continue-outperformance-in-q1-2020 (accessed 20 JulyJuly 20 2020).
- Yarovaya, L., Elsayed, A. H., & Hammoudeh, S. (2021). Determinants of spillovers between Islamic and conventional financial markets: Exploring the safe haven assets during the COVID-19 pandemic. Finance Research Letters, 101979
- Yarovaya, L., Mirza, N., Abaidi, J., & Hasnaoui, A. (2021). Human capital efficiency and equity funds' performance during the COVID-19 pandemic. International Review of Economics & Finance, 71, 584–591. https://doi.org/10.1016/j.iref.2020.09.017
- Yarovaya, L., Mirza, N., Rizvi, S. K. A., Saba, I., & Naqvi, B. (2020). The Resilience of Islamic Equity Funds during COVID-19: Evidence from Risk-Adjusted Performance, Investment Styles and Volatility Timing. Investment Styles and Volatility Timing (November 25, 2020). Available at SSRN: https://ssrn.com/abstract=3737689 or https://doi.org/10.2139/ssrn.3737689
- Yarovaya, L., Matkovskyy, R., Jalan, A. (2020a). The Effects of a'Black Swan'Event (COVID-19) on Herding Behavior in Cryptocurrency Markets: Evidence from Cryptocurrency USD, EUR, JPY and KRW Markets, Available at: https://ssrn.com/abstract=3586511
- Yarovaya, L., Matkovskyy, R., Jalan, A. (2020b). The COVID-19 Black Swan Crisis: Reaction and Recovery of Various Financial Markets, Available at: https://ssrn.com/abstract=3611587
- Yilmaz, M. K., Sensoy, A., Ozturk, K., & Hacihasanoglu, E. (2015). Cross-sectoral interactions in Islamic equity markets. Pacific-Basin Finance Journal, 32, 1–20. https://doi.org/10.1016/j.pacfin.2014.12.008
- Further readings
- International Monetary Fund (2020). World Economic Outlook: The Great Lockdown. April 2020.
- World Bank (2020). COVID-19 outbreak: capital markets implications and response. COVID-19 Notes Fiannce Series, March 2020.
Appendix
This Appendix provides mathematical details of the cross-quantilogram model. Introduced by Linton and Whang (Citation2007), the quantilogram measures the predictability in different sectors of the distribution in a stationary time series. In other words, quantilogram is the correlogram of quantile hits (Han et al., Citation2016) that examine the null hypothesis that there is no directional predictability in each time series (Linton & Whang, Citation2007). The test for predictability is conducted through quantilogram comparison to a point-wise confidence interval. To evaluate the dependence of quantiles between two stationary time series, Han et al. (Citation2016) modifies the univariate quantilogram framework to a multivariate setting by considering the information concerning prediction. The cross-quantilogram (CQ) method applies conditional quantiles to measure the directional dependence among the time series.
Moreover, the applied distribution is asymptotic to be valid uniformly over a range of quantiles. Han et al. (Citation2016) highlight several advantages for directional predictability for quantilogram compared to other tests. It is based on the quantile hits that, like ordinary correlogram techniques, do not entail moment conditions, and it is applicable for series with strong tails.
Han et al. (Citation2016) argued that the CQ model captures the serial dependence between the two time-series at different conditional quantiles, say and
for any pair of
The quantile range to evaluate the directional predictability is denoted by
Furthermore, the quantile of
is
for
and the indicator function expressed by 1 [
] and
called 'quantile hit' process for
Thus, Han et al. (Citation2016) defined CQ. to be cross-correlation for the quantile-hit processes for
where
can be written as:
(1)
(1)
In EquationEq. 1(1)
(1) , the CQ measures serial dependency at different quantile levels between the two series. Taking
as an example, the cross-quantilogram measures the cross-correlation between DJMI returns being above or below quantile
at time
and the commodity returns being above or below quantile
at time
Therefore,
implies that no predictability or time-lag effect to predict between the G7 and Islamic indices at
Han et al. (Citation2016) consider a linear quantile regression model proposed by Koenker and Bassett (1978) where with a
vector of the unknown parameters
for
The CQ. sample analog in the inverse direction proposed by Han et al. (Citation2016) as given in EquationEq. (2)
(2)
(2) which expresses a minimization problem that estimates the unknown parameters where
and
for
For observations
the sample counterpart of cross-quantilogram is,
(2)
(2)
(3)
(3)
Furthermore, based on ρα (k), the quantile version of the Ljung-Box-Pierce statistic with H0: ρα (k) = 0 for all k ϵ 1,…, p as:
(4)
(4)
Where, according to p lags and the quantile pair the portmanteau test of directional predictability is represented by
from one time series to another in above EquationEq. (4)
(4)
(4) .
In this study, the results are specified with a lag length of one. Additionally, we utilize 1000 bootstrap iterations and a significance level of 0.05. A lag length of one indicates that we measure the correlations between two days. The selection of bootstrap is evaluated with iterations between 100 and 1000. The significance level of 0.05 is selected based on standard econometric arguments to prevent rejecting a correct null hypothesis.