
 ?Mathematical formulae have been encoded as MathML and are displayed in this HTML version using MathJax in order to improve their display. Uncheck the box to turn MathJax off. This feature requires Javascript. Click on a formula to zoom.
Abstract
This investigation infers the time evolution causal effect of COVID-19 and SARS on China's stock market based on predicting the counterfactual market response using a diffusion-regression state-space model. The results show that SARS caused an average negative impact of 5.4% on stock prices. In comparison, COVID-19 had a negative impact of 5.3%. Furthermore, considering China's growing worldwide influence, this study carefully reselects the covariates and finds that the negative impact of COVID-19 on stock prices has conservatively increased to 10%, far stronger than the impact of SARS. The results show that the quantitative estimation of the causal effect of emergencies such as COVID-19 must be based on reliable counterfactual inference; only relying on statistical correlation measures may lead to biased estimation. The analysis of the time evolution characteristics of the causal effect shows that the negative impact caused by COVID-19 began to weaken within three days, while the impact of SARS lasted longer. The results show that the Chinese government's strict lockdown achieved the effect of stopping losses in time, and this finding helps to provide a positive demonstration for worldwide epidemic response strategies.
1. Introduction
In December 2019, COVID-19 began to break out in Wuhan, before gradually spreading to most of China’s provinces. The Chinese government attached great importance to the development of the epidemic; effective measures were quickly taken. On 11 January 2020, the national health commission of the People's Republic of China began to officially announce the COVID-19 situation. At 10 a.m. on 23 January 2020, one day before the lunar New Year, Wuhan, the capital of Hubei Province, applied the strictest control measures. There was a complete lockdown of the population, with all transportation in and out of the city of 9 million residents prohibited. After the outbreak in China, COVID-19 rapidly spread throughout the world. On 23 February 2020, South Korea officially entered the highest level of epidemic prevention. Meanwhile, some cities in northern Italy began to implement city-wide lockdown measures. On 10 March 2020, COVID-19 began to break out in the U.S., triggering four U.S. stock fusions on March 9, 12, 16, and 18. However, in contrast, China's stock market did not seem to attract much attention, which leads to the core concern of this paper: what is and has been the impact of COVID-19 on China's stock market?
The COVID-19 pandemic is not the first time a large-scale public health crisis has occurred in China. A typical example is SARS, which broke out at the end of 2002 and lasted throughout 2003. However, although many similarities exist between SARS and COVID-19 in terms of pathology, they are quite different in the scale, background, and consequences. First, SARS mainly impacted China, while COVID-19 has spread worldwide, with an extensive impact. Data from the World Health Organization (WHO) show that SARS caused 8422 infections and 919 deaths worldwide, including 829 deaths in China. By comparison, as of 17 November 2020, more than 54.77 million people had been infected with COVID-19, causing 1.324 million deaths, including 4749 deaths in China. Second, China was better prepared for COVID-19 than for SARS. When SARS broke out in 2002, China was not ready to deal with it. When the existence of COVID-19 was first confirmed in December 2019, Chinese scientists were able to quickly identify the virus and share the virus's genome sequencing data internationally, starting on 11 January 2020. Third, China did not impose large-scale population movement restrictions during the SARS period, but this policy was strictly implemented during the COVID-19 outbreak. Fourth, compared with 2003, China's influence in the world in 2020 is increasing day-by-day. China’s macroeconomic background and international political situation have also changed. Based on the above differences, this paper focuses on inferring and comparing the causal effect of SARS and COVID-19 on the stock market.
To date, numerous studies have examined the impact of COVID-19 (Mirza, Hasnaoui et al., Citation2020; Mirza, Naqvi et al., Citation2020; Mirza, Rahat et al., Citation2020; Rizvi et al., Citation2020; Yarovaya et al., Citation2021). However, the causal effect estimation of COVID-19 on the stock market may display greater complexity, due to the macroeconomic background and government response to the epidemic. One of the core reasons for this complexity is that causal inference is not a simple correlation. Since the outbreak of COVID-19, numerous studies have emerged that discuss the pandemic’s consequences for the stock market (Baker et al., Citation2020; Mazur et al., Citation2021). However, most of these studies focus on the correlation, rather than the causal inference. The event approach is mostly used to test the impact of emergencies such as SARS and COVID-19. Chen et al. (Citation2007) tested the impact of SARS on Taiwan's hotel stock performance using an event study approach. He et al. (Citation2020) used an event study approach to empirically study the market performance and response trends of Chinese industries to the COVID-19 pandemic. Other studies, such as Bash (Citation2020), Alam et al. (Citation2020) and Pandey and Kumari (Citation2021) have also used the event study approach to test the impact of COVID-19 on the stock market. However, though the event study approach has been widely used in previous literature (Obradović & Tomić, Citation2017), the defect of this approach is that it measures the impact caused by emergencies by comparing the stock market before and after the event, which is not equal to the causal effect.
Another cluster of literature on COVID-19 and the stock market is mainly based on the time series of daily new or death cases, which is used to investigate their relationship. These studies mostly use different kinds of time series models to focus on the correlation between COVID-19, the stock market, the oil market, and/or economic policy uncertainty. Sharif et al. (Citation2020) used a wavelet analysis to analyze the time-frequency relationship between the COVID-19 outbreak, oil prices, geopolitical risk, economic uncertainty, and the U.S. stock market. Jeris and Nath (Citation2020) tested the relationship between COVID-19, oil prices, and U.K. economic policy uncertainty, using an ARDL approach. Many other studies also use various time series methods to investigate the correlation between different time series variables (Hoque et al., Citation2019; Lee & Wang, Citation2015; Shaeri & Katircioğlu, Citation2018; Tang, Citation2013). However, the above methods cannot directly estimate the causal effect, because a causal estimation generally needs a well-designed counterfactual framework (Frangakis & Rubin, Citation2002).
To estimate the causal effect of COVID-19 and SARS on the stock market, this study utilizes a Bayesian structural time series model from Brodersen et al. (Citation2015) for the investigation. Based on this model, the causal effect is inferred. The results are based on a diffusion-regression state-space model that predicts the counterfactual market response in a synthetic control that would have occurred had no intervention taken place. In contrast to classical difference-in-differences (DD) schemes, state-space models infer the temporal evolution of attributable impact. The estimation of the time-varying causal effect is helpful into comparing the impact duration of COVID-19 and SARS on the stock market. As mentioned above, after the outbreak of COVID-19, the Chinese government adopted a more stringent population mobility restriction policy, thereby controlling the spread of the virus in China in a short period. This may be seen to imply that the impact of COVID-19 may be short-lived. In addition to the characteristic of temporal evolution, the model of Brodersen et al. (Citation2015) also incorporates empirical priors in the parameters in a fully Bayesian treatment. The model can also flexibly accommodate multiple sources of variation, including local trends, seasonality, and the time-varying influence of contemporaneous covariates.
Based on the above model application, this study tests the causal effect of COVID-19 and SARS using the model of Brodersen et al. (Citation2015). Compared to the DD model, the model of Brodersen et al. (Citation2015) uses a fully Bayesian approach to infer the temporal evolution of counterfactual activity and incremental impact. The advantage of this model is the flexibility with which posterior inferences can be summarized. The empirical results show that SARS caused an average negative impact of 5.4% on stock prices. In comparison, COVID-19 has had a negative impact of 5.3%. However, considering China's growing worldwide influence, this study carefully reselects the covariates and finds that the negative impact of COVID-19 on stock prices has conservatively increased to 10%, far stronger than the impact of SARS. The results show that quantitative estimations of the causal effect of emergencies such as COVID-19 must be based on reliable counterfactual inference; relying only on statistical correlation measures may lead to biased estimations. An analysis of the time evolution characteristics of the causal effect shows that the negative impact caused by COVID-19 began to weaken within three days; the impact of SARS lasted much longer. Our results support the argument that the Chinese government's strict lockdown achieved the effect of stopping losses in a timely manner, and the government’s approach could help to provide a positive demonstration for worldwide epidemic response strategists.
This investigation makes some contributions to previous literature, as follows: First, the huge impact of COVID-19 on the stock market is compared and confirmed. The impact is much higher than that of SARS, which means that the global spread of COVID-19 must be fully curbed. This will require the concerted efforts of all countries around the world. Second, we find that, in the absence of effective vaccines, China's strict lockdown policy can effectively curb the virus and significantly reduce the persistence of the negative impact of COVID-19 on the stock market. This finding has reference significance for other countries' epidemic control strategies. Third, from the perspective of methodology, this study provides a more robust research approach to quantitatively measuring the impact of emergencies such as COVID-19 or SARS on financial markets from the perspective of causal inference. Meanwhile, in the empirical design of counterfactual prediction, the results of this paper highlight the importance of exogenous covariates (not affected by event shocks), as mentioned by Brodersen et al. (Citation2015).
The rest of this paper is organized as follows: Section 2 reviews the background of SARS and COVID-19; Section 3 introduces the Bayesian structural time-series models, after which Section 4 introduces data and the corresponding empirical results; Section 5 concludes the paper.
2. Background of SRAS and COVID-19
2.1. The outbreak of COVID-19
The background of the outbreak of COVID-19 and Wuhan's lockdown is discussed in detail in a study by Huo and Qiu (Citation2020). Therefore, only a brief summary is provided here. The outbreak of COVID-19 in China started as early as December 2019; the virus began to gain global attention after mid-January 2020. Since the day that Zhong Nanshan, a famous fellow of the Chinese Academy of Engineering, confirmed the human-to-human transmission of COVID-19 on 20 January 2020, the number of infected patients increased dramatically in just a few days. On 23 January 2020, Wuhan was locked down completely. On 24 January 2020, the Chinese New Year holiday started. On 28 January 2020, the total number of people affected by COVID-19 surpassed the number that had been affected by SARS. After 30 January 2020, the virus began to spread rapidly in many countries around the world. On 12 February 2020, the number of new cases in Wuhan reached its peak. The number of new cases in Wuhan then decreased to zero for the first time on 18 March 2020. On 8 April 2020, the government stopped the Wuhan lockdown policy.
2.2. The outbreak of SARS
When the first SARS case appeared in Guangdong Province in early December 2002, SARS was not paid enough attention. By 10 February 2003, 305 confirmed cases and five deaths had occurred in Guangdong Province. On the same day, the Chinese government informed the WHO of the existence of the SARS infection. On 12 February 2002, the friendly football match between China and Brazil went ahead as normal, because the epidemic situation was not considered to be severe. On 6 March 2003, Beijing confirmed the first imported SARS case. On 12 March 2003, the WHO issued a global warning about SARS. In the first 10 days of April 2003, reports of SARS cases in China's official media gradually increased. However, the general impression given was that the epidemic situation was under control. On 15 April 2003, the WHO listed Singapore, Taiwan, Toronto, Hanoi, Guangdong, Shanxi, and Hong Kong as epidemic areas. On 20 April 2003, the National Health Commission of the People's Republic of China announced the implementation of a ‘one-day reporting system’. On 29 May 2003, there were no confirmed new SARS cases in Beijing. On 14 June 2003, the WHO lifted the travel warning for those traveling to Hebei, Inner Mongolia, Shanxi, and Tianjin. From 13 July 2003, the number of SARS patients and suspected cases in the world did not increase.
3. Methodology
Brodersen et al. (Citation2015) stated that DD designs are limited in three ways. First, DD models are traditionally based on a static regression model that assumes i.i.d. data, despite the fact that the design has a temporal component. When fit to serially-correlated data, static models yield overoptimistic inferences with uncertainty intervals that are too narrow (Bertrand et al., Citation2004; Hansen, Citation2007a, Citation2007b; Solon, Citation1984). Second, most DD analyses only consider two time points, namely: before and after the intervention. In practice, the manner in which an effect evolves over time (especially its onset and decay structure) is often a key issue. Third, when DD analyses are based on time series, previous studies have imposed restrictions on the way in which a synthetic control is constructed from a set of predictor variables. This is something the authors of this study wish to avoid.
The limitations of DD schemes can be addressed by using state-space models to explain the temporal evolution of an observed outcome. In addition, the spike-and-slab prior of the fully Bayesian treatment is able to integrate posterior uncertainty about which covariates to include and how strongly they should influence this study’s predictions, avoids overfitting. As a result, the causal inference procedure proposed by Brodersen et al. (Citation2015) is used here. The procedure begins with Bayesian structural time-series models, which can be defined in terms of a pair of equations:
where
and
are independent of all other unknowns. Equation (1) is the observation equation, which links the observed data
to a latent d-dimensional state vector
Equation (2) is the state equation, which governs the evolution of state vector
through time. In this paper,
is a scalar observation,
is a
-dimensional output vector,
is a
transition matrix,
is a
control matrix,
is a scalar observation error with noise variance
and
is a q-dimensional system error with a
state-diffusion matrix
where
The most important state component for the applications considered in this paper is a regression component that allows one to obtain counterfactual predictions. This is done by constructing a synthetic control based on a combination of markets that were not treated. Observed responses from such markets are important because they allow the authors to explain the variance components in the treated market that are not readily captured by more generic seasonal sub-models.
Control time series that received no treatment are critical to the method used here to obtain accurate counterfactual predictions. This is because they account for variance components that are shared by the series, including, in particular, the effects of other unobserved causes otherwise unaccounted for by the model. A natural way of including control series in the model is through a linear regression. The model’s coefficients can be static or time varying. This paper sets contemporaneous covariates with static coefficients, which can be written in state-space form by setting and
Let generically denote the set of all model parameters and let
denote the full state sequence. Brodersen et al. (Citation2015) suggests adapting a Bayesian approach to inference by specifying a prior distribution
on the model parameters as well as a distribution
on the initial state values, and sample from
using the Markov Chain Monte Carlo (MCMC).
As for the evaluation (pointwise) of the impact,
is established in order to obtain results from the a posteriori causal effect, for each draw
and for each time point
where
is the time point at which the treatment occurs.
The cumulative effect of the intervention over time can also be estimated. This cumulative sum of causal increments is estimated by
4. Empirical analysis
4.1. Data
The data used in this study are sourced from the WIND database. The Shanghai stock index is used to measure Chinese stock prices. All of the Shanghai stock index's sample stocks are listed on the Shanghai Stock Exchange, including A shares and B shares, reflecting changes in the listed stocks' prices. In the robustness analysis, the Shenzhen stock index is used as an alternative index of price changes in China's stock market. In addition, 12 important stock price indexes of the global stock market were selected as covariates. These covariates include the Dow Jones index (DJI), the NASDAQ index (IXIC), the S&P 500 index (SPX), the FTSE 100 index (FTSE), the French CAC 40 index (FCHI), the German DAX 300 index (GDAXI), the Nikkei 225 Index (N225), the Korea composite index (KS11), the Hang Seng Index (HSI), the Australian index (AS51), the Russian trading system index (RTS) and the Taiex index (TWII). Of the above, data of the KS11 index during SARS are not available in the WIND database. Thus the other 11 series are used as covariates of the state model for SARS estimation.
Two sample time intervals should be set to investigate the effects of COVID-19 and SARS, respectively. This paper chooses two landmark events as the starting point of the two shocks. For COVID-19, the landmark event is the Wuhan lockdown that commenced on 23 January 2020. The lockdown indicates that the Chinese government had begun to face COVID-19 squarely and decided to implement strict population mobility restrictions to avoid further spread of the virus. For SARS, the landmark event was the implementation of the ‘one-day reporting system’, which also represents the start of the Chinese government's formal recognition of SARS. Therefore, for COVID-19, this study sets 2 December 2019 to 22 January 2020 (37 trading days) as the pre-treatment period; 23 January 2020 to 18 February 2020 (13 trading days) is set as the post-treatment period. In addition, for SARS, the pre-treatment period is set as 2 September 2002 to 18 April 2003 (152 trading days), while 21 April 2003 to 20 May 2003 (15 trading days) is set as the post-treatment period. It should be noted that a longer post-treatment period was not chosen by the authors. The reason is that COVID-19 began to spread around the world from March 2020, which means that the stock markets of most countries were either directly or indirectly affected by the virus. Therefore, a shorter pre-treatment period is preferred in this paper, in order to ensure the reliability of causal inference.
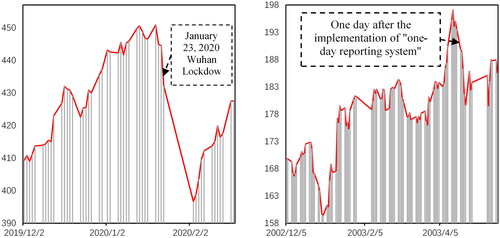
shows the trend of the Shanghai Composite Index during the COVID-19 (left) and SARS outbreaks (right). As can be seen, after the above two time points, the stock price declined significantly. In addition, in terms of the scale of the decline, the Shanghai index was at about 450 on 22 January 2020. After that, the New Year holiday began, when the index suddenly dropped to a minimum of about 400, where it stayed until the opening of 3 February 2020. During the SARS outbreak, after 20 April 2003, the Shanghai index dropped from a starting point of approximately 190. After several days of decline, the index reached its lowest point (about 180) on 25 April 2020. In contrast, the impact of COVID-19 seemed to have had a stronger but shorter impact than the SARS.
Figure 1. Shanghai index during the COVID-19 (left) and SARS (right) epidemics.
Source: By authors.
4.2. Causal effect on the stock price of COVID-19 and SARS
The above discussion about is not enough to show that the decline in the stock market was due to the impact on the stock market of COVID-19 and SARS. The reason is that the decline may have resulted from other confounding factors, such as monetary policy shocks, international shocks, or other possible shocks. As a result, it is necessary to construct a well-designed causal inference process, in order to provide more rigorous and robust evidence for the above observations and conjectures. In the empirical estimation of the basic Bayesian state-space model, this study first takes all 12 of the above-mentioned indexes as covariates. Brodersen et al. (Citation2015) pointed out that discussing the exogeneity of covariates is critical, because the existence of endogenous covariates will lead to a biased estimation of the causal effect. However, if it is reasonably certain that shocks of COVID-19 or SARS on the endogenous covariates are positive (or negative), one can know the direction of how the causal effect is biased.
To check the endogeneity of the covariates, shows the trend of the 12 covariates around the above setting time points (23 January 2020 and 20 April 2003). For the convenience of plotting, all series are normalized with the first observed value set at 100. As can be seen, after the closure of Wuhan (23 January 2020), all the covariates are similar to the Shanghai index, showing a relatively consistent downward trend. This finding means that, with China's continuous integration into the world economic integration process, the linkage between its stock market and the global stock market is stronger. In contrast, during the SARS outbreak, the trend of the covariates did not show an obvious consistent downward trend similar to the Shanghai index. This finding means that the above covariates could provide a better counterfactual prediction of the Shanghai index.
Figure 2. Covariates during the COVID-19 (left) and SARS (right) outbreaks.
Source: By authors.
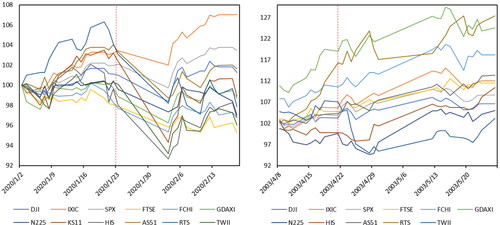
However, although the COVID-19 covariates are not desirable, their consistent downward trend means that the counterfactual prediction may underestimate the real potential results of the Shanghai index in the absence of COVID-19 shocks. Therefore, the findings make it basically clear that the causal inference based on the above covariates may be a conservative estimate for the impact of COVID-19, and a proper estimate for the impact of SARS.
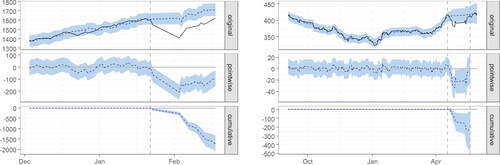
and show the result of causal inference using all available covariates during the COVID-19 and SARS outbreaks. Among them, the first panel displays the data (solid line) and a counterfactual prediction (dotted line) for the post-treatment period. The second panel shows the difference between observed data and counterfactual predictions. This is the pointwise causal effect, as estimated by the model. The third panel adds up the pointwise contributions from the second panel, resulting in a plot of the cumulative effect of the intervention. Additionally, the vertical dashed line is the dividing line of treatment.
Figure 3. The time-varying causal effect of COVID-19 on the Shanghai index.
Note: (a) In the time series of the Shanghai index, the dotted line is the counterfactual forecast value, (b) pointwise (daily) incremental impact of COVID-19, (c) cumulative impact of COVID-19.
Source: Authors' calculations.
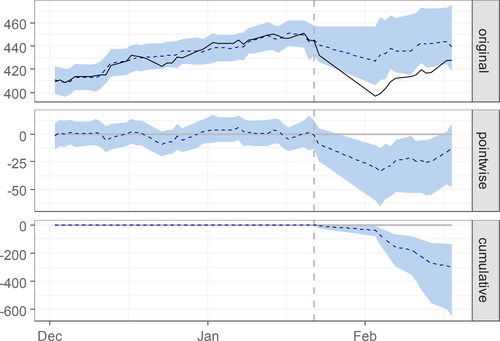
Figure 4. The time-varying causal effect of SARS on the Shanghai index.
Note: (a) In the time series of the Shanghai index, the dotted line is the counterfactual forecast value, (b) pointwise (daily) incremental impact of the SARS, (c) cumulative impact of SARS.
Source: Authors' calculations.
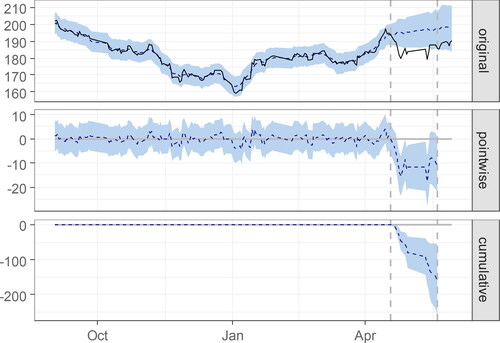
As shown in the first rows of and , the model provided an excellent fit for the Shanghai index before the treatment dates (23 January 2020 and 20 April 2003). Following Wuhan's lockdown and the ‘one-day reporting system’, observations quickly began to diverge from counterfactual predictions: the actual stock index was consistently lower than would have been expected in the absence of COVID-19 and SARS. For the impact of COVID-19, the two curves begin to show a reconvening trend after a short (two-day) deviation. In contrast, for the impact of SARS, the two curves show a continuous parallel trend. Subtracting observed data from predicted data, as was done in the second panels of and , the result is a posterior estimate of the decline of the Shanghai index caused by COVID-19 or SARS. shows that the pointwise causal effect reaches the bottom after three trading days (from 23 January 2020 to 4 February 2020, with a Spring Festival holiday during this period), and then converges to zero. In contrast, shows that the pointwise causal effect basically reaches the bottom after five trading days (from 21 April 2003 to 25 April 2003), and then remains at the bottom on subsequent trading days.
presents a numerical summary of and . In , the column entitled ‘Average’ talks about the average (across time) during the post-intervention period. The ‘Cumulative’ column sums up individual time points. For the impact of COVID-19, during the post-intervention period, the response variable had an average value of approximately 415. By contrast, in the absence of COVID-19, an average response of 438 would has been expected. The 95% interval of this counterfactual prediction is [425, 465]. Subtracting this prediction from the observed response yields an estimate of the causal effect the intervention had on the response variable. This effect is −23 with a 95% interval of [−50, −10]. The above results are given in terms of absolute numbers. In relative terms, the response variable showed a decrease of −5.3%. The 95% interval of this percentage is [−11%, −2.4%]. This finding means that the negative effect observed during the intervention period is statistically significant. The probability of obtaining this effect by chance is very small (Bayesian one-sided tail-area probability p = 0.001). This means the causal effect of COVID-19 can be considered statistically significant.
Table 1. The average causal effect of COVID-19 and SARS on the Shanghai index.
Similarly, with regard to the impact of SARS, during the post-intervention period, the response variable had an average value of approximately 185. By contrast, in the absence of SARS, the expected average response would have been 196. The 95% interval of this counterfactual prediction is [189, 202]. Subtracting this prediction from the observed response yields an estimate of the causal effect the intervention had on the response variable. This effect is −11, with a 95% interval of [−17, −3.7]. In relative terms, the response variable showed a decrease of −5.4%. The 95% interval of this percentage is [−8.9%, −1.9%]. The probability of obtaining this effect by chance is very small (Bayesian one-sided tail-area probability p = 0.002). This means the causal effect of SARS can be considered statistically significant.
4.3. Re-selection of covariates
The above result reveals two important findings. First, from the perspective of time evolution, China's stock market's shock response to COVID-19 was faster and recovered within a few days; the impact response to SARS lasted longer. Second, in relative terms, both SARS and COVID-19 had a significant impact on China's stock price movement. Specifically, on average, COVID-19 led to a fall of 5.3% (of stock prices); SARS led to a fall of 5.4%. The second finding seems to suggest that the shock of COVID-19 was almost the same as SARS, which, intuitively, is not in line with expectations. The impact of COVID-19 should be stronger than that of SARS in terms of infection rate, infection scale, and the pandemic’s impact on China's economy. Combined with the above analysis of , the authors of this study believe that the potential endogeneity of covariates may lead to an underestimated impact effect of COVID-19 on the stock market. In the above regression, both 12 and 11 available covariates were used to construct the model. Among them, the trends of some covariates aftershocks of COVID-19 or SARS are similar to that of the Shanghai index. If these variables are actually endogenously affected by COVID-19 or SARS, then the shock effect scale may be underestimated when they are included as covariates. Therefore, this study further removes the covariates that are similar to China's stock price trend aftershocks of COVID-19 or SARS, and estimates the model based on the new set of covariates. If the above conjecture is true, the new model estimation results should show a larger scale of causal effects.
By comparing and , one can find that the IXIC index decreases the least after the COVID-19 shock. Therefore, this study only uses the IXIC index as a covariate to reduce the estimation bias caused by the endogenous covariates. Another reason for choosing the IXIC index is that it reflects the price trend of the U.S. stock market. Due to the escalating friction between China and the U.S. in recent years, the degree of market fragmentation between those two countries is increasing, and this may weaken the endogeneity of the IXIC index to a certain extent. However, it should be noted that although there is only a slight decline, the IXIC index may still be endogenous in the context of global economic and financial integration. This means that, even if one only uses the IXIC index as the covariate, the estimation of the shock of COVID-19 is likely to be a conservative inference. For the impact effect estimation of SRAS, as mentioned above, the potential endogenous problem of the covariates set is relatively weak. However, as seen in , this study finds that the TWII index (the Taiex index of Taiwan) experienced a considerable decline after 20 April 2003. Considering that the geographical distance and economic links between Taiwan and the Chinese mainland are both relatively close, the model is re-estimated by removing the TWII index.
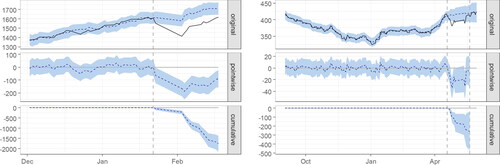
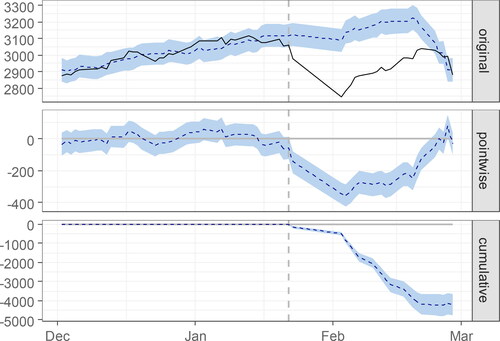
and , as well as , show the corresponding results. As can be seen, there is no significant difference between the estimated results pertaining to SARS and the results in Section 4.2. This finding indicates that there is no apparent endogenous problem with the covariates during the SARS period. In contrast, the estimated results pertaining to COVID-19 are quite different from those in Section 4.2. First, as can be seen from , when the COVID-19 shock occurred, the counterfactual forecast value of the Shanghai index showed an upward trend on the whole. This finding suggests that the endogenous problem was avoided to a large extent. Second, from the 95% confidence interval, shows that the confidence interval of the Shanghai index's counterfactual prediction value and pointwise causality effect is smaller than that in . This finding indicates that the significance of the causal inference improved. Third, and most important, the relative effect reported in is −10%, which is much larger than that in (−5.3%). The results show that the causal effect of COVID-19 on the stock market is further demonstrated when the endogenous problem of covariates is relieved. Compared with the relative effect of SARS (approximately −5.5%), the impact strength of COVID-19 is significantly higher, which is consistent with intuitive expectations.
Figure 5. Re-selection of covariates (COVID-19).
Note: (a) The time series of the Shanghai index, the dotted line is the counterfactual forecast value, (b) pointwise (daily) incremental impact of COVID-19, (c) cumulative impact of COVID-19.
Source: Authors' calculations.
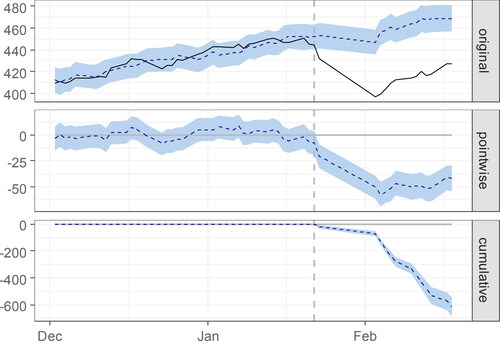
Figure 6. Re-selection of covariates (SARS).
Note: (a) The time series of the Shanghai index, the dotted line is the counterfactual forecast value, (b) pointwise (daily) incremental impact of the SARS, (c) cumulative impact of SARS.
Source: Authors' calculations.
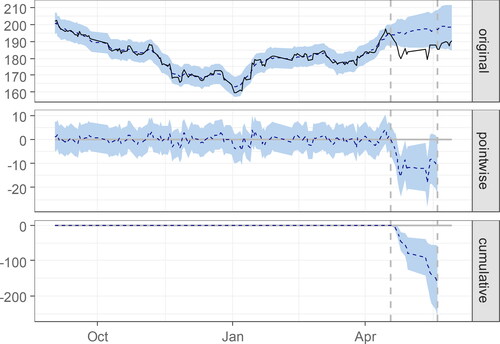
Table 2. Re-selection of covariates.
and also show certain similar characteristics in time evolution in addition to the above differences. Specifically, shows that the pointwise causal effect reached the bottom after four trading days (from 23 January 2020 to 5 February 2020, with a Spring Festival holiday during this period), and then showed a trend converging to zero. This means that COVID-19 had a more significant negative impact on the stock market than SARS, but the negative impact was only temporary (within four days). This phenomenon is in sharp contrast to the continuous fusing of the U.S. stock market in March 2020. In the U.S., COVID-19 broke outin early March, but the government did not formulate a strict isolation policy. After the outbreak was confirmed, the U.S. stock market began to fall sharply. The Federal Reserve responded by releasing a large amount of liquidity by decreasing the interest rate to boost the stock market. However, the stock market still experienced four fusions within 10 days. In contrast, China took a positive attitude towards COVID-19, adopting and implementing strict lockdown measures. Therefore, though the central bank did not make any large-scale monetary policy changes, the stock market was relatively stable.
4.4. Robustness check
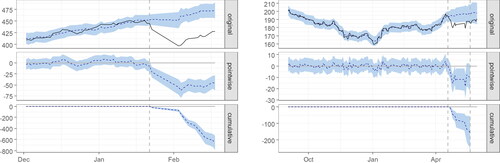
Four strategies are used to verify the robustness of the above estimation results. The first strategy is to replace the Shanghai index with the Shenzhen index. The corresponding results are shown in ; the results are similar to those of and .
Figure 7. Replacing the Shanghai index with the Shenzhen index.
Note: The impact of COVID-19 on the Shenzhen index is one the left. The impact of SARS on the Shenzhen index is on the right.
Source: Authors' calculations.
The second strategy is the further re-selection of covariates. For the COVID-19 shocks, this study uses two U.S. stock indexes (IXIC and SPX); for the SARS shocks, three Asian indexes (N225, HSI and TWII) are removed. The corresponding results are shown in , which is also similar to and .
Figure 8. Re-selection of covariates to check the robustness.
Note: On the left is the impact of COVID-19 on the Shanghai index. On the right is the impact of SARS on the Shanghai index.
Source: Authors' calculations.
The third strategy is using the one-period-lagged covariates. The corresponding results are shown in , which is also similar to and . All results of the robustness check suggest that the causal inference is reliable.
Figure 9. Using one-lagged-period covariates.
Note: The impact of COVID-19 on the Shanghai index is shown on the left. The impact of SARS on the Shanghai index is shown on the right.
Source: Authors' calculations.
The fourth strategy is to further consolidate the conclusions of this paper on the dynamic impact of COVID-19. All the findings suggest that the impact of COVID-19 began to fade after a few days, reflecting the remarkable success of the Chinese government’s fight against the virus. This conclusion was further tested by extending the sample date to 28 February 2020. The corresponding results in show that the effects of COVID-19 largely disappeared at the end of February, confirming the above conclusion.
Figure 10. Extending the sample date to February 28, 2020.
Note: (a) In the time series of the Shanghai index, the dotted line is the counterfactual forecast value, (b) pointwise (daily) incremental impact of COVID-19 and (c) cumulative impact of COVID-19.
Source: Authors' calculations.
5. Conclusions
This paper compares the negative impact of COVID-19 on China's stock market with that of SARS in 2003. The authors find that the impact of COVID-19 on the stock market was much higher than that of SARS. However, China's strict isolation measures effectively controlled the virus's spread and effectively curbed its continuous impact on the stock market. Without implementing the monetary policy of releasing liquidity on a large scale, the Chinese government successfully stopped losses by confronting the epidemic, strictly preventing and controlling it. As of 19 November 2020, COVID-19 was still rampant in many countries around the world. Although there may be differences in the political systems, cultural backgrounds and economic status of different countries, the successful epidemic prevention measures of some Asian countries (such as South Korea, North Korea, Singapore, etc.), as represented by China, can provide a reference for other countries.
The results of this study have two policy implications. First, investors, governments, and other entities should pay close attention to the significant impact of COVID-19 on the stock market and make corresponding investment decisions and policy adjustments accordingly. Second, timely control of the epidemic and prevention of its continuous spread can effectively block the sustainability of the impact of COVID-19 on the stock market. In addition, from the perspective of methodology, this study shows that the causal effect estimation based on counterfactual prediction is helpful in providing a concise and robust way to measuring the size of shocks in an emergency, as well as the shock’s time evolution. However, as Brodersen et al. (Citation2015) emphasized, the correct estimation of causal effects must be based on strictly exogenous covariates. This paper's empirical process can be used as one of the references to measure the real impact of COVID-19 in various aspects.
Disclosure statement
No potential conflict of interest was reported by the authors.
Additional information
Funding
References
- Alam, M. N., Alam, M. S., & Chavali, K. (2020). Stock market response during COVID-19 lockdown period in India: An event study. The Journal of Asian Finance, Economics and Business, 7(7), 131–137. https://doi.org/10.13106/jafeb.2020.vol7.no7.131
- Baker, S. R., Bloom, N., Davis, S. J., Kost, K., Sammon, M., & Viratyosin, T. (2020). The unprecedented stock market reaction to COVID-19. The Review of Asset Pricing Studies, 10(4), 742–758. https://doi.org/10.1093/rapstu/raaa008
- Bash, A. (2020). International evidence of COVID-19 and stock market returns: An event study analysis. International Journal of Economics and Financial Issues, 10(4), 34–38. https://doi.org/10.32479/ijefi.9941
- Bertrand, M., Duflo, E., & Mullainathan, S. (2004). How much should we trust differences-in-differences estimates? The Quarterly Journal of Economics, 119(1), 249–275. https://doi.org/10.1162/003355304772839588
- Brodersen, K. H., Gallusser, F., Koehler, J., Remy, N., & Scott, S. L. (2015). Inferring causal impact using Bayesian structural time-series models. The Annals of Applied Statistics, 9(1), 247–274. https://doi.org/10.1214/14-AOAS788
- Chen, M. H., Jang, S. S., & Kim, W. G. (2007). The impact of the SARS outbreak on Taiwanese hotel stock performance: An event-study approach. International Journal of Hospitality Management, 26(1), 200–212. https://doi.org/10.1016/j.ijhm.2005.11.004
- Frangakis, C. E., & Rubin, D. B. (2002). Principal stratification in causal inference. Biometrics, 58(1), 21–29. https://doi.org/10.1111/j.0006-341x.2002.00021.x
- Hansen, C. B. (2007a). Asymptotic properties of a robust variance matrix estimator for panel data when T is large. Journal of Econometrics, 141(2), 597–620. https://doi.org/10.1016/j.jeconom.2006.10.009
- Hansen, C. B. (2007b). Generalized least squares inference in panel and multilevel models with serial correlation and fixed effects. Journal of Econometrics, 140(2), 670–694. https://doi.org/10.1016/j.jeconom.2006.07.011
- He, P., Sun, Y., Zhang, Y., & Li, T. (2020). COVID –19's impact on stock prices across different sectors – An event study based on the Chinese stock market. Emerging Markets Finance and Trade, 56(10), 2198–2212. https://doi.org/10.1080/1540496X.2020.1785865
- Hoque, M. E., Soo Wah, L., & Zaidi, M. A. S. (2019). Oil price shocks, global economic policy uncertainty, geopolitical risk, and stock price in Malaysia: Factor augmented VAR approach. Economic Research-Ekonomska Istraživanja, 32(1), 3700–3732. https://doi.org/10.1080/1331677X.2019.1675078
- Huo, X., & Qiu, Z. (2020). How does China's stock market react to the announcement of the COVID-19 pandemic lockdown? Economic and Political Studies, 8(4), 436–461. https://doi.org/10.1080/20954816.2020.1780695
- Jeris, S. S., & Nath, R. D. (2020). Covid-19, oil price and U.K. economic policy uncertainty: Evidence from the ARDL approach. Quantitative Finance and Economics, 4(3), 503. https://doi.org/10.3934/QFE.2020023
- Lee, Y. M., & Wang, K. M. (2015). Dynamic heterogeneous panel analysis of the correlation between stock prices and exchange rates. Economic Research-Ekonomska Istraživanja, 28(1), 749–772. https://doi.org/10.1080/1331677X.2015.1084889
- Mazur, M., Dang, M., & Vega, M. (2021). COVID-19 and the March 2020 stock market crash. Evidence from S&P1500. Finance Research Letters, 38, 101690. https://doi.org/10.1016/j.frl.2020.101690
- Mirza, N., Hasnaoui, J. A., Naqvi, B., & Rizvi, S. K. A. (2020). The impact of human capital efficiency on Latin American mutual funds during Covid-19 outbreak. Swiss Journal of Economics and Statistics, 156(1), 1–7. https://doi.org/10.1186/s41937-020-00066-6
- Mirza, N., Naqvi, B., Rahat, B., & Rizvi, S. K. A. (2020). Price reaction, volatility timing and funds' performance during Covid-19. Finance Research Letters, 36, 101657. https://doi.org/10.1016/j.frl.2020.101657
- Mirza, N., Rahat, B., Naqvi, B., & Rizvi, S. K. A. (2020). Impact of Covid-19 on corporate solvency and possible policy responses in the EU. The Quarterly Review of Economics and Finance. https://doi.org/10.1016/j.qref.2020.09.002
- Pandey, D. K., & Kumari, V. (2021). Event study on the reaction of the developed and emerging stock markets to the 2019-nCoV outbreak. International Review of Economics & Finance, 71, 467–483. https://doi.org/10.1016/j.iref.2020.09.014
- Obradović, S., & Tomić, N. (2017). The effect of presidential election in the USA on stock return flow – A study of a political event. Economic Research-Ekonomska Istraživanja, 30(1), 112–124. https://doi.org/10.1080/1331677X.2017.1305802
- Rizvi, S. K. A., Mirza, N., Naqvi, B., & Rahat, B. (2020). Covid-19 and asset management in EU: A preliminary assessment of performance and investment styles. Journal of Asset Management, 21(4), 281–291. https://doi.org/10.1057/s41260-020-00172-3
- Shaeri, K., & Katircioğlu, S. (2018). The nexus between oil prices and stock prices of oil, technology and transportation companies under multiple regime shifts. Economic Research-Ekonomska Istraživanja, 31(1), 681–702. https://doi.org/10.1080/1331677X.2018.1426472
- Sharif, A., Aloui, C., & Yarovaya, L. (2020). COVID-19 pandemic, oil prices, stock market, geopolitical risk and policy uncertainty nexus in the U.S. economy: Fresh evidence from the wavelet-based approach. International Review of Financial Analysis, 70, 101496. https://doi.org/10.1016/j.irfa.2020.101496
- Solon, G. (1984). Estimating autocorrelations in fixed-effects models (No. t0032). National Bureau of Economic Research. https://doi.org/10.3386/t0032
- Tang, C. F. (2013). The linkage between stock price and economic growth in Australia: A chicken-and-egg paradox? Economic Research-Ekonomska Istraživanja, 26(2), 99–116. https://doi.org/10.1080/1331677X.2013.11517609
- Yarovaya, L., Mirza, N., Abaidi, J., & Hasnaoui, A. (2021). Human capital efficiency and equity funds’ performance during the COVID-19 pandemic. International Review of Economics & Finance, 71, 584–591. https://doi.org/10.1016/j.iref.2020.09.017