
 ?Mathematical formulae have been encoded as MathML and are displayed in this HTML version using MathJax in order to improve their display. Uncheck the box to turn MathJax off. This feature requires Javascript. Click on a formula to zoom.
Abstract
This study described an empirical link between COVID-19 fear and stock market volatility. Studying COVID-19 fear with stock market volatility is crucial for planning adequate portfolio diversification in international financial markets. The study used AR (1) – GARCH (1,1) to measure stock market volatility associated with the COVID-19 pandemic. Our findings suggest that COVID-19 fear is the ultimate cause driving public attention and stock market volatility. The results demonstrate that stock market performance and GDP growth decreased significantly through average increases during the pandemic. Further, with a 1% increase in COVID-19 cases, the stock return and GDP decreased by 0.8%, 0.56%, respectively. However, GDP growth demonstrated a slight movement with stock exchange. Moreover, public attention to the attitude of buying or selling was highly dependent on the COVID-19 pandemic reported cases index, death index, and global fear index. Consequently, investment in the gold market, rather than in the stock market, is recommended. The study also suggests policy implications for key stakeholders.
1. Introduction
The global economy was hit hard by the COVID-19 pandemic, which created panic in global financial markets. The aim of this study was two-fold: first, to determine how much of the increase in stock volatility can be traced to COVID-19, and second, to examine the relevant economic factors, such as financial development and economic growth. Drastic and impactful changes have been witnessed since the beginning of 2020, and their impact has led to various events that have interfered with different aspects of human life, including the social and economic arenas. Due to this impact, several economies are currently trying to recover from recessions. The pandemic hit almost every aspect of the economy hard, including consumption, trade, manufacturing, supply chains, and financial behaviours. Due to COVID-19 uncertainty, massive recovery plans are called for worldwide to counter these adverse effects on economies. Different approaches have been suggested by different sources internationally, but the ideal recovery method is considered to be based on sustainable post-COVID-19 strategies (Yoshino et al., Citation2021). Therefore, countries should plan for different stages of response to COVID-19, including an emergency stage, an exit strategy, and the new normal life (Mirza et al., Citation2020a; Citation2020b; Rizvi et al., Citation2020; Yarovaya et al., Citation2021). Moreover, the policies for all stages must be sustainable.
The impact of COVID-19 fear on public attention to stock market volatility has been under-studied. This is one of the first studies to test the effect of COVID-19 fear on stock market volatility. This acts as a pillar in its subject of the development of the economic growth that fulfills a country’s commercial and energy needs (Anser et al., Citation2020b; Citation2020c). Due to shock and fear, stock prices fell worldwide: According to data released by the British Broadcasting Corporation (BBC) on March 31, 2020, the Dow Jones Industrial Average and FTSE 100 fell by 23% and 25%, respectively the largest quarterly decline since 1987. During the same period, Standard & Poor’s 500 Index fell by 20%, the most since the 2008 financial crisis. Economists made terrible predictions about the economic recession. According to the ‘Global Economic Outlook’ (June 2020), the pandemic would plunge most of the world’s economies into recession, representing the world’s highest annual per capita production reduction since 1870. The report also pointed out that the real global GDP contraction would be 5.2%. Developed countries would have a growth rate of 7.5%, while emerging and developed markets would have a growth rate of 2.5%. Because multinational actors compete, a sudden spike in energy prices would have a detrimental effect on demand and could spark a global economic recession (Anser et al., Citation2020e) (Anser et al., Citation2020a).
The significant negative impacts of COVID-19 investment on stock exchange sector growth show that foreign direct investment (FDI) is the main determinant of foreign integration in both developed and developing economies. Most academics have emphasised the effect of FDI on economic growth. The global economy suffered significant losses because of COVID-19. As a result, ways to cope with the pandemic’s effect on the global economy have been a popular subject in recent months (Engelhardt et al., Citation2021; Lyócsa & Molnár, Citation2020; Uddin et al., Citation2021). Furthermore, academic study of the modelling and forecasting of stock market volatility has always been a challenge. This report nevertheless explored its impact on development in the stock exchange market for the first time, providing insights for policymakers. Policymakers should provide international buyers with enticing offers for stock exchange investments. Because FDI increases stock exchange sector efficiency, it also makes a positive contribution to GDP through stock exchange sector production. The stock exchange sector serves household and industry grain and raw material requirements. The positive effect of the entire selling price index on the stock exchange sector’s development indicates that local and foreign demand consume the stock exchange industry’s supply. Positive results mean that production falls short of demand, contributing to an increase in price costs and the ability of manufacturers to generate more. The rise in demand could be attributed to the growth and wages of the local and global populations.
It increased uncertainty in financial markets, which dragged stock market volatility into a hostile region (W. Zhang et al., Citation2020), halting market stability (Mirza et al., Citation2020a; Rizvi et al., Citation2020). This led to a new argument, linking the fear index of infectious disease and, simultaneously, the coronavirus, with a severe effect on stock market volatility (Alemzero et al., Citation2020a; Citation2020b; Mirza et al., Citation2020b; Yarovaya et al., Citation2021). Such conditions favour the activities, balance, and growth of business. Studies have also shown that the COVID-19 pandemic supported climate change well (Daughton, Citation2020; Rowan & Galanakis, Citation2020).
The purpose of this study was to test the positive and negative impacts of COVID-19 on stock market volatility. Our contribution also included the assessment of COVID-19 and stock price comments. We used the AR (1) – GARCH (1, 1) model, which is reliable for estimating the impact of COVID-19 fear on public attention to stock market volatility. This study also aimed to evaluate the plans and measures taken by different developed nations, the reasons for such approaches, and the efficiency of their recovery strategies (W. Zhang et al., Citation2020). We contributed to this area in several ways. We investigated the relationship between COVID-19 and stock exchanges, such as S&P500, NASDAQ, DOW, DAX, CRIA, and Cyprus. We highlighted that economic recovery strategies have been called for while the pandemic is ongoing.
The rest of the paper is organised as follows: Section 2 summarises the literature review and background. Section 3 explains the techniques used in this study. Section 4 describes the results and discussion, and Section 5 concludes the study and provides policy implications.
2. Literature review and background
In January 2020, COVID-19 was brought to the world’s attention. The accelerating spread of the virus and the growing number of reported cases prompted the Chinese government to move quickly. On January 23, 2020, the entire city of Wuhan was put under lockdown, shocking the world and later proving to be a highly powerful strategic move by the Chinese government. The WHO called the epidemic in China a global health emergency of international significance a week later (PHEIC). There were 7,711 reported cases at the time, with 83 cases in 18 countries outside China. The crisis began to affect the global economy. For instance, according to International Monetary Fund statistics, as a world leader in automobile exports, the Japanese economy was likely to shrink by 8% during the 2020 third quarter and later expected to expand to the new normal. Despite Japan’s strategies, the country’s economy did not respond as quickly as expected. The overall recovery plan is sub-divided into two phases: economic emergency support. During this period, the government would attempt to stabilise the economy as much as possible until the end of the contagion (Iqbal et al., Citation2020). It is a strategic period immediately following the end of the pandemic, the timing of which is unknown. This is a period when demand will be stimulated to normal levels, and other monetary tools will be in full control. During this period, there will be a focus on the most affected sectors, such as tourism, the leisure industry, and service sectors (restaurants, bars, etc.). Some of the strategies involve direct stipends to all citizens and to selected businesses to cover the minimum daily needs and to compensate a part of their business loss. The stipend also aims to maintain the daily demand for goods at a normal level. This will not only maintain purchasing power but also boost industrial output. Support plans also include the provision of loans at almost 0% interest. The country identified the core importance of the money supply within the economy and decided to provide risk- and interest-free loans through the Bank of Japan (Ashraf, Citation2020a), with the aim of encouraging more business people and other stakeholders to expand their business scope and retain the labour force (Phan & Narayan, Citation2020).
A total amount of JPY 1 billion was set aside to support small-scale businesses. To ensure the continuous flow of goods into Japan, Japanese customs declared import duty relief on all imported goods. This facilitates the availability of goods and provides price relief to consumers, thus boosting demand to a more normal level. This plan was accompanied by a sophisticated subsidy budget for goods that are less in demand during an era of lockdowns. It has been well explained that Japan cannot rely on external demand to recover its economy, but it could try to reduce the COVID-19 impact through massive export of automobiles, optimal operation of their heavy industries, and further investment in high-tech goods that are still in high demand, despite the pandemic. This will indirectly improve the Japanese economy’s progression towards recovery (Okorie & Lin, Citation2021). The co-movement of world equity markets is often used as a barometer of economic globalisation and financial integration. Several studies have tested co-movement within international stock markets (Corbet et al., Citation2020; Straif-Bourgeois & Robinson, Citation2020; Zaremba et al., Citation2020), revealing significant effects on international stock returns, volatility, portfolio diversification, and inter-temporal stability (Mirza et al., Citation2020b; Yarovaya et al., Citation2021). Studies have also revealed that financial crises significantly affect international stock market performance. Studying the co-movement of the global fear index of the COVID-19 crisis with study topicality is still a missing link. Therefore, this study hypothesised a significant relationship between the COVID-19 fear index and public attention to stock market volatility.
The world economy has faced enormous setbacks owing to the intensive lockdowns that numerous countries have enforced to deal with the numerous deaths and infections caused by the continued rapid spread of the coronavirus (Barbier & Burgess, Citation2020). The global economy suffered a significant decline during these government-imposed lockdowns and continues to suffer a great deal, because of the closure of various businesses. Many disputed the labour, whereas industries such as tourism, education, and transport completely shut down (Chandio et al., Citation2020; Quigley et al., Citation2020). We studied the relevant literature from two viewpoints, focusing on recent publications on the financial and socioeconomic impacts of the COVID-19 pandemic: (1) transmission instability during the COVID-19 crisis and (2) the association of COVID-19 indicators with stock market performance and economic uncertainty. Several new reports have looked at the financial and socioeconomic impacts of COVID-19. For example, during the pandemic, Akhtaruzzaman et al. (Citation2021) used the DCC method to investigate contagion dissemination for both financial and nonfinancial companies between China and the G7 economies. They discovered that conditional associations between equity returns of both financial and nonfinancial companies increased significantly (Salisu & Akanni, Citation2020). They also stated that the extent of the rise in these correlations was far higher for financial companies, indicating they played a major role in financial contagion propagation between China and the G7. Finally, they showed that, in most situations, the ideal hedge ratios increased considerably, implying higher hedging costs during the COVID-19 crisis era. According to Corbet et al. (Citation2020), it is not surprising that the Chinese markets were the epicentre of both the physical and financial contagion at the start of the COVID-19 pandemic. They also demonstrated that the word ‘corona’ has sharp, complex, and recent similarities. Zhang et al. (Citation2020) argued that COVID-19’s accelerated spread has had drastic consequences for stock markets across the globe, culminating in a substantial rise in global financial market instability and significant losses for investors in a brief span of time (Narayan et al., Citation2021).
3. Data and methodology
To measure stock market volatility, global COVID-19 pandemic-related daily volatility index statistics were used. According to WHO (2020), the incubation period of most coronavirus positive cases is approximately 14 days in incubation centres. Endorsing the WHO verdict, this period of 14 days shows the maximum number of days for positive coronavirus cases in incubation centres. For the empirical estimation, the data were analysed in four panels: 16 December 2019 to 16 April 2020 (Panel 1), 17 April 2020 to 16 June 2020 (Panel 2), 17 June 2020 to 16 August 2020 (Panel 3), and 17 August 2020 to 16 December 2020 (Panel 4). Using international stock index data, the study’s preliminary estimation highlighted the pattern of stock index volatility through figures during the COVID-19 outbreak (Akinsomi, Citation2020; Aydın & Ari, Citation2020). These figures provide a rich understanding of stock market volatility in co-movement with the global fear index of the COVID-19 outbreak persisting in international stock indexes. Thus, the fear index of the COVID-19 outbreak is trending towards fear in international markets and raising public attention to stock exchange issues. To estimate the research models of the recent study, marginal distributions showing AR (1) – GARCH (1,1) were used, and the results for the interconnected distribution estimation were used. The AR (1) – GARCH (1,1) model was previously discussed and operationalised. The AR (1) – GARCH (1, 1) model is explained as follows, where,
(1)
(1)
(2)
(2)
shows the conditional variance,
shows the residual error. The model holds eights constructs showing the parameters of estimation, three parameters (
in Equationequation (1)
(1)
(1) , three parameters (ω, α, β) have further been used in Equationequation (1)
(1)
(1) , with distributions representing the AR (1) – GARCH (1, 1) model. Moreover, ω shows the GARCH Using Log-Likelihood (L.L.), Akaike Information Criterion (AIC), and the Bayesian Information Criterion (BIC), the model vigorous of the recent study is analysed (Econ. Time Covid-19, 2020; Haroon & Rizvi, Citation2020). The variables used in the study include economic development, measured as GDP growth (annual %) and used as predictive variables, whereas green credit is used as a predictor and measured as the total green credit of the banks/total loans of the banks. In addition, green investment and green securities are also used as predictors and measured as the fiscal expenditure of industries/total fiscal expenditure, total market value, and total market value of all shares. Finally, capital formation and government educational expenditures are also used as predictors and measured as gross capital formation (% of GDP) and current education expenditure (% of total expenditures), respectively. We used the model proposed by He et al. (Citation2020), who concluded that the AR (1) – GARCH (1, 1) model was reliable for estimating the impact of COVID-19 fear on public attention to stock market volatility.
(3)
(3)
(4)
(4)
Using these equations, the co-movement of the variables was established for operationalisation, and these results were robust with the GARCH method. With the complete disruption of the economy, government should focus more on expansionary fiscal policies to stimulate recovery. This mainly means to increase government spending, which will increase cash flow and liquidity of assets, thereby putting more money in the hands of citizens to encourage higher demand for goods and services. This, in turn, will increase the levels or volumes of supply in the economy. Wavelet coherence is an empirical framework used to examine the relationship between two or two variables. To justify the use of wavelet coherence, we used two series sequences called x (t) and y (t), which justify and clarify the function as
(5)
(5)
Wherever the given wavelet transforms of x(t) and y(t) contribute in the objective function, for example, Wx (m, n) and Wy (m, n), the wavelet index to evaluate as n; therefore, the composite conjugate solution as the sign *.
(6)
(6)
Whereas
(7)
(7)
Consequently, the wavelet transform is used as an empirical method to measure the non-stationary time series underlying variables (Lopez-Tiro et al., Citation2020). The wavelet transformation frame contains fluctuations from high to low and low to high and the frequency between underlying entities. The objective function in the cross-wavelet transforms can estimate the cross-wavelet power between two variables in a series. The mathematical model and the coefficients of the adjusted wavelet coherence are measured as
(8)
(8)
R characterises the mechanism of smoothing in wavelet transformation, whereas 0 ≤ R2 (m, n) ≤ 1 denotes the interval of the squared coefficients of wavelet coherence. A score of 1 indicates a more vigorous correlation among the entities being measured, while the coefficients of wavelet coherence smaller than a threshold are eradicated by thresholding the estimating parameter. The hard threshold reduction objective function can be written as follows:
(9)
(9)
Mid thresholding is used as a flexible technique, which ensures that the mid-level reduction in the objective function is as follows:
(10)
(10)
(11)
(11)
The cross-wavelet transforms and
can be described in the form of W.X.Y. = W.X.W.Y.∗, whereas W.X. and W.Y. characterise bi-transforms designed for wavelets X and Y, respectively. The mixed debate (
) can be described as the original equivalent stage:
(12)
(12)
The level of assurance associated with the likelihood p and for density likelihood purposes is Uϑ (p), explained through the square root of multiplication of two χ2 distributions. The Granger causality (GC) incidence field is described to categorise the two series based on supernatural interdependency. Breitung and Candelon (Citation2006) demonstrated that the aforementioned test shows the association between x and y in the VAR (p) mathematical model, as follows:
(13)
(13)
The null hypothesis was verified through the test proposed by Geweke (Citation1991) in null linear restriction, as follows:
4. Results and discussion
4.1. Covid-19 fear nexus with public attention
In the first phase of the pandemic, we observed a long-term relationship between stock exchange performance and cumulative daily COVID-19 cases and deaths worldwide. In the second wave of COVID-19, after the general quarantine restrictions were relaxed following the first wave, the correlation remained. Between the first and second waves, the continuous rise of COVID-19 infections and deaths increased turmoil in the stock market and the entire economy and had a significant impact on finances. Unemployment rose steeply during the pandemic for various reasons, mainly the closure of many unessential businesses. This led to increased poverty rates because people were not working, and their disposable income was significantly reduced, making them unable to meet their tax burdens. Governments can ease this problem by increasing unemployment benefits for people who have lost their jobs ().
Table 1. Panel unit root test.
Our empirical findings on the nexus of COVID-19 fear and public attention to the environment extended their reporting using the unit root test and ARDL technique. The study results were stationary at l(1). The economy can recover mainly through geographical subsidies to encourage firms to invest in depressed areas, such as the agricultural sector. This means that a return shock in one economy will only have a short-term impact on other markets. The time domain effect to use the return spillover effect shows that NASDAQ (0.608%) paid the most to CRIA, followed by Cyprus (0.304%), DAX (0.247%), and SP500 (0.247%) (0.146%). This shows the pandemic had a significant influence on the returns of major stock exchange stock markets. We can see that SP500 revenue overflow was the largest (6.089%), SP500’s DAX revenue overflow is the largest (30.795%), S&P500 is the largest (21.428%), and DAX returns from SP500 (21.428%). (31.036%). This sector has been significantly affected by the pandemic, with reduced commodity prices and a lack of labour. Firms can be given subsidies for taking on long-term employees; for example, they can be given income tax breaks or tax holidays to sustain their economic activities (Okorie & Lin, Citation2021). Moving window research showed that the impact of COVID-19 on stock market instability was greater than that of the 2008 global financial crisis. During the COVID-19 pandemic, government-authorised non-profit organisations took many steps, including reducing travel abroad, closing classrooms, implementing mandatory lockdowns, banning public meetings, closing unnecessary businesses, and ordering the use of masks. These interventions had a direct impact on economic growth, leading to falling energy prices and four times the loss of stock exchange circuit breakers, resulting in significant losses for investors over a brief period of time.
shows that COVID-19 fear indices, such as RDI, GFI, and RCI, had a positive relationship with public attention to media stock exchange return variation at a p-value < 0.05. US economic policy uncertainties increased owing to US geopolitical risk fluctuations, causing volatility in COVID-19 and oil prices. However, only a 3.1% increase in power consumption will occur. The end of 2020 is more likely to have a moderate impact on the energy sector. The results show that the average return rate was 25.32%, which is less than the total correlation degree variance of 40.11% (for constant), indicating that the return rates of stock exchange index volatilities in the world are closely related to their respective volatility. The results show that the short-term volatility (S&P, 0.0024) had the largest total return spillover, whereas NASDAQ (0.0118) had the largest long-term return, and the others were as follows: DOW (90.0056), DAX (0.0456), CRIA (0.0026), and Cyprus (0.0016). COVID-19 affected industrial productivity, directing a substantial decrease in electricity consumption in China. Although research by ICIS China suggested that low levels were to be expected until April 2020, a capacity below 10% was served for knitting machines in textile factories, making it the lowest in the last five years. China is the world’s largest exporter of textiles and clothing. For example, with a two-tier pricing structure (for example, first and second tiers), a crude oil company can (i) independently ration, i.e., increase the price of the first shortage of crude oil without changing the price of the second shortage during the same period to satisfy the market ().
Table 2. Autoregressive distributed lag (ARDL) test.
Table 3. Robustness test.
This means that extreme events have a greater impact on volatility. In contrast to the return spillover effect in frequency dynamics, an absolute volatility spillover occurred in the long-term, medium-term, and short-term frequency dynamics. Furthermore, a sudden increase in stock market volatility was observed in mid-2020 due to the COVID-19 pandemic. More specifically, COVID-19 would have an impact of nearly 80% on stock market volatility in 2020, which is almost the same as the impact of the 2008 global financial crisis. Reduce the amount of crude oil that meets the primary price to reach consumers with medium demand levels or (iii) increase the first-level rate by 15% (from $1.943 per barrel to $2.321), and the second-level rate increases by 43% (from $2.78/barrel to $4.53). This policy will have the least impact on the welfare of low-demand households that consume less than 24 barrels per billing cycle. For users with more than 30 barrels per billing cycle, the marginal crude oil rate will increase by 43% (from $2.768 to $3.76 for 1-barrel consumption). Furthermore, uncertainty avoidance is a measure that tests how accepting a culture is to unpredictable consequences in the stock market. At the end of week three following the first outbreak declaration, countries with high individualism scores underwent a 12.71% lower stock price recession than countries with low individualism scores. Furthermore, we discovered that countries with higher uncertainty avoidance scores experienced a 5.40% greater stock price decline than those with poor uncertainty avoidance scores during the same time span. Greater stock price reductions are correlated with greater stock return volatility. In particular, within the first several weeks of the pandemic, countries with low individualism and strong ambiguity resistance had higher instability as well as larger price declines. The private sector, including small business enterprises with a low recovery period (Asif et al., Citation2020; Iram et al., Citation2021; Sarker et al., Citation2020; Tehreem et al., Citation2020), emphasised that the government should use import substitution or boost domestic consumer and production goods production. The results of our calculation showed a negative association between stock market returns and COVID-19 cases. The rise in the rate of COVID-19 caused a sudden decline in stock market returns (short-and long-run direct effects). Furthermore, it can be illustrated that negative spillover consequences, along with a rise in government reaction strength, causes stock market returns in similar countries to decline (short-and long-run indirect effects). Overall, spillover results aggravated the detrimental influence of lockdown interventions on the stock market. The finding that spillover effects are greater than direct effects is an outstanding outcome of our study. Although it can seem counterintuitive, because of the accumulated spillover effects across multiple cross-sectional units, this is not unusual.
4.2. Covid-19 fear nexus with stock market volatility
Although the current financial crisis players doubt the perseverance of a subsequently excellent ratio of profit, while a breakeven point bottommost of 7%, which recommends that the implementation scenario of the market flooding is questionable, it can concisely be stated that the exchange rates at the beginning of the study period (September 2014), for sanctions, both at the beginning or during the study period, positive co-movement between gold prices and foreign exchange rates was observed. In comparison, the foreign exchange rate was the most significant variable. The results are aligned with the report by Anser et al. (Citation2020d). Over time, a significant decrease in the degree of co-movement between these variables became prominent. However, investors faced significant gold market losses owing to government interventions in foreign exchange. No significant co-movement between foreign exchange, gold markets, and stock markets was observed, even after the outbreak. Stock market investors are likely to get with the help of an analysis related to exchange rates. Nevertheless, as the crisis evolves, co-movement analysis will no longer help investors interested in investing in the stock market. Although stock markets with foreign investors are vulnerable to the international shock caused by COVID-19, the long-term outlook for them is positive based on the geographical diversification of these countries. While holding foreign investment would indicate a more concrete international presence, the extent of COVID-19 for all stock markets with foreign revenue and foreign assets. We observed a negative relationship between these variables in the short run and the COVID-19 impacted economies, whereas long-term investors have more opportunities to invest in the long term during a recession. The post-COVID-19 scenario may entice a strong recovery in the stock market, and there is therefore a great opportunity for investors to enjoy capital gains and dividends.
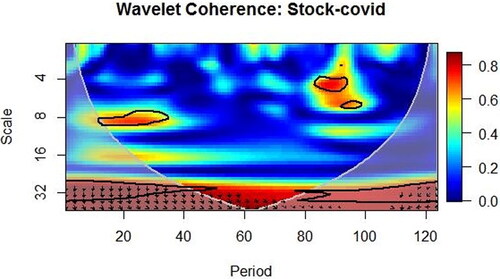
In , we first observe the wavelet coherence of each pair of variables during the first wave of the COVID-19 outbreak, and then find that there are many important co-movements between COVID-19 cases and stock performance. The large island in confirms a severe dependence on short-term frequency bands at the beginning, centre, and end of the first COVID-19 wave cycle. The wavelet coherence confirmed COVID-19 cases, and S&P500, NASDAQ, DAX, DOW, and Cyprus showed severe dependence at the beginning of the first fluctuating cycle. In the short term, shows another island in the top right corner, where the co-movement between these two variables is higher at the end of the wave. The small island in the left centre of shows that the reported cases are countercyclical associations with stock performance. Economic growth is higher with higher trade openness and education rates and lower due to higher government consumption and inflation. Simultaneously, a drop in oil prices is observed. Our findings are consistent with those of Huynh et al. (Citation2020) and Feng et al. (Citation2021).
Figure 1. Wavelet coherence between stock return and COVID-19 cases.
Source: Authors calculation.
Production and promoting processes were also affected by COVID-19 because they require local physical contact (Tehreem et al., Citation2020; Rasheed & Anser, Citation2017; Xu et al., Citation2020; Yousaf et al., Citation2020). Just as the digital economy produces many roles, it also destroys others (Ikram et al., Citation2019; Shah et al., Citation2019). NASDAQ and CRIA faced a 65% and 57% declining stock market volatility trend, respectively. In contrast, DAX declined around 17%, S&P (500) around 31%, Cyprus SE around 24%, and NASDAQ around 28%. Since the COVID-19 outbreak, the DOW has faced a V-shaped curve in different periods for a short time during the study period. The economic implications show that the time-varying conditional correlations shows that between the two markets has changed greatly, which means that investors will regularly change their portfolio structure during the volatility. The positive dynamic conditional correlation between stock markets supports the existence of contagious (due to extreme vases of COVID-19) effects. As a result, during the COVID-19 crisis, many risk spillover occurred between the stock markets. The market changes over time and is unpredictable, which means that a portfolio manager cannot adjust their portfolio structure during a period of crisis. The unit root test was applied, showing stationary matter of the data, and all the study constructs were found to fit at the first difference. The AR (1) – GJR (1, 1) model provided certain fascinating insights. The intercept (β0) and mean coefficient (β1) of the stock market volatility index with each sample market relative and near zero. The findings show an asymmetrical impact of COVID-19 on selected stock markets, which was consistent with the work done by (Mohsin et al., Citation2018b; Citation2021).
The relationship between stock market volatility and the COVID-19 pandemic has directly affected stock returns. The results in show that almost all stock exchange returns were negatively associated with the number of COVID-19 cases during this period; for example, a 1% increase in COVID-19 cases caused a 12.8% decrease in S&P 500, −0.161 in NASDAQ, variation in DOW from −0.188 to −0.054, and variation in DAX from −0.172 to −0.012. The CRIA was the stock exchange most affected by COVID-19; for example, a 1% increase in COVID-19 caused a 23.7% decrease in stock returns. Throughout the pandemic, the logarithm of GDP was taken as a control variable. The table shows the econometric estimation and results of COVID-19 and stock market volatility. Almost all stock market returns had a negative relationship with COVID-19 cases, indicating that they were near zero during the COVID-19 period. These findings suggest that the markets were facing less volatility during the pandemic period, caused by global COVID-19 outbreak fear (L. Sun et al., Citation2020b; H. Sun et al., Citation2020; L. Sun et al., Citation2020a). The GARCH coefficient (ω) for the Shanghai SE is great by means of a substantial margin, and the rest of the markets were observed using reasonably small GARCH coefficients. Disruptions in world trading are expected to have a major effect on stock markets. COVID-19 is projected to result in a 14–32% decrease in stock exchange and a 30–40% decrease in foreign direct investment in 2022 if the same trend continues. In 2020, multinational corporations also reduced their foreign investment by 20–30%. Only government efforts to bring trade chains back home are expected to boost these estimates. COVID-19, while professionals and policymakers signal the culmination of globalisation because it illustrates the costs of significant dependence on other economies, adding to the current spillover impact. Others contend that the effects of COVID-19 will be fleeting, and that turning trade inwards will not help countries weather the crisis ().
Table 4. Effects of Covid-19 on stock market volatility.
Table 5. Unit root test.
Considering the study results, we found novel findings that S&P500, Cyprus, CRIA, DOW, Shanghai, and NASDAQ correlated significantly with the global fear index of COVID-19. The coefficients of the study were significant at a p-value of 5%. Surprisingly, the Shanghai Stock Exchange and DAA had a larger coefficient. The volatility coefficients of all sample international stock exchanges were also statistically significant at the 5% level. However, this indicates that the international stock markets’ volatility index co-moved with the global fear index of the COVID-19 outbreak. The COVID-19 pandemic has also had an effect on the global economy, as stock market indexes have been shut down. The resulting financial turmoil can be seen in the movements of various stock market indexes. The S&P500, DAX, DOW Average, and NASDAQ indexes in the United States (US) both dropped significantly before the government enacted the Coronavirus Assistance, Relief, and Economic Protection Act, during which the three indices increased for specific periods by 7.3%, 17.73%, 2 and 7.33%, 3%, respectively. Furthermore, the yield on a 10-year US Treasury Bond fell to 0.67%. Several new studies have analysed and validated the COVID-19 pandemic’s drastic effects on stock markets ().
Table 6. AR (1) – GJR (1, 1) model estimates1.
C0 is the constant factor, C1 is the COVID-19 fear index, Υ is the dependent variable of study, β is the coefficient of the variance equation for the study stock market volatility index, υ is the level of autonomy parameter that equates to 2 for every market, λ is the asymmetry or skewness parameters, Γ is the AR (1) estimation parameter, Λ and Ω are the GJR (1, 1) estimation parameters.
The β coefficient of the variance equation for the study stock market volatility index was also significant at the 5% level. The proposed outcomes recommended for marketplace volatility index variance for all international stock markets, with the exclusion of the S&P500, were deeply co-moved by the global fear index (GFI) of the COVID-19 outbreak. The autonomy parameter υ equates to 2 for every market except the S&P500 index. A ‘sharp-V’ recovery feature also characterises the German economy. This means that the economy fell sharply, and it regained its form instantly. This shape economically implies a rapid loss and regain in employment pattern, gross domestic product, and industrial output rate. Finally, the economy, that is why it has adopted heavy penalties on citizens who fail to abide by face mask laws (50 euros). Therefore, from the strategies mentioned above for the country, it has been outlined that the Dutch economy will first shrink by 11% and will later expand rapidly and become more robust than before. Compared with the overall return spillover results, shows that the long-term frequency of volatility frequency is 0.7429, which has the largest total volatility spillover rate, followed by mid-term volatility (0.049%) and short-term volatility (0.297%), indicating the impact of each market transaction on volatility spillover. More importantly, the NASDAQ (28.433%) increased the most volatility spilled over to day trading during the peak period of COVID-19 cases, followed by S&P500 (7.384%), DAX (4.574%), and DOW (4.435%). This finding indicates that the volatility spillover effect between COVID-19 cases and stock market returns was greater than the income spillover effect. At the same time, the S&P500 had the largest volatility spillover from DAX (24.556%), DOW had the largest volatility impact from S&P500 (38.195%), and Cyprus had the largest volatility impact from S&P500 (46.901%).
Table 7. GARCHX estimation for robustness for GFI and SMVI co-movement.
(i) There is a cyclicality between COVID-19 cases and stock exchange return volatility, indicating that, in many countries, the average daily COVID-19 had a significant impact on the volatility of stock exchange returns; (ii) the strong association between COVID-19 cases and stock exchange return volatility indicates that COVID-19 cases had a significant long-term impact on the stock market gains in selected countries; (iii) the low frequency and strong connectivity indicate that COVID-19 cases had a strong co-movement with stock returns. The robust findings from the GARCHX table showed that all the coefficients of conditional variance were econometrically significant at the 5% significance level. This fostered acceptance of the alternative hypothesis that the coefficient of the variance equation was not zero. European countries have witnessed rapid economic recovery during the pandemic. It was later indicated that thorough improvements to the Dutch economy were necessary, and, indeed, good results were shown in the last quarter of 2020. Despite the loss experienced through the total deaths worldwide, the economy was saved. Contrary to other countries, the world imposed official lockdown measures and necessary recommendations, such as social distancing, working from home, and protective gear for citizens. The economic recovery plan is based on three aspects. The short-term recovery period: This package aims to provide a stimulus stipend worth 130 billion Euros. The aim is to soften the recession period and boost post-COVID-19 consumption. With this stipend in the roll-out, the economy is expected to get back on track by the end of 2022, possibly a bit earlier. In addition, it provides confidence to German citizens for future recovery.
5. Conclusion and policy implications
The rapid spread of the coronavirus disturbed global production and supply chains. The impact of COVID-19 triggered new planning and strategies for the future. The relationship between production and consumption was devastated, which caused an eruption during the pandemic. We used the AR (1) – GARCH (1, 1) model, as it is reliable for estimating the impact of COVID-19 fear on public attention to stock market volatility. The study also used wavelet coherence to measure the relationship between COVID-19 and stock market returns. Wavelet-based techniques helped to classify lead–lag interactions in the time–frequency domain, thereby overcoming certain inherent problems, including stationarity and nonlinearity. The COVID-19 stock crash showed a 26% reduction over four consecutive days. The massive sudden decrease in the stock market index caused the US GDP to fall by about 4.8% and 20% during the first quarter of 2020. According to our findings, the volatility of the stock market was lower in countries with more COVID-19 cases. In the univariate and multivariate models, the robustness test results held. In addition, the pandemic had a major indirect impact on stock performance. Stock returns seemed very low within a few weeks after countries-imposed lockdowns. NASDAQ and CRIA faced a 65% and 57% decline in stock market volatility, respectively, while DAX declined around 17%, S&P500 around 31%, Cyprus SE around 24%, and NASDAQ around 28% due to the pandemic. Furthermore, we found that S&P500, Cyprus, CRIA, DOW, Shanghai, and NASDAQ correlated significantly with the investor’s global fear index of COVID-19.
A summary of the findings shows that the performance of the stock market and GDP growth significantly decreased because of the pandemic, i.e., a 1% increase in the COVID-19, the stock return, and GDP decrease with a 0.8%, 0.56%, respectively. Investors’ uncertainty in the capital market and economic downturns negatively affected markets’ stock market performance. On the other hand, the lockdowns and the reduced number of tourists reduced energy consumption and diminished GHG emissions, which is good news for the environment. However, when economies enter the new everyday life, the required policies need to be implemented to achieve environmentally sustainable healing. Therefore, this study investigated the impact of COVID-19 fear on public attention to stock market volatility and discussed the environmental effects. Although the March 2020 COVID-19 stock crash was considered a significant decrease in the stock market, the stock exchange market showed a 26% reduction over four days. The massive reduction in stock exchanges caused the US GDP to decrease by 4.8% during the first quarter of 2020 and the unemployment rate to decrease by 20%.
Our results showed that the increase in confirmed cases and deaths caused by the coronavirus was related to a significant decline in market liquidity and stability. Then, the market rebounded, to a certain extent. To minimise the impact of external shocks on the markets, primarily in emerging capital markets, policy measures are required, including market monitoring, to monitor market price trends and the availability and liquidity of capital, and deregulation. Market function: To ensure the continued, orderly, and fair function of the securities market for stocks, bonds, funds, and other products. Issuer disclosure: To promote timely and accurate disclosure of vital information to ensure market transparency. Developing fiscal policies, such as cutting taxes and interest rates, is recommended to increase aggregate demand and increase people’s purchasing power. These policies will allow people to borrow money at subsidised interest rates and increase demand to foster recovery during the post-COVID-19 economic distress. Governments can implement educational reforms to reduce structural unemployment by adopting new and improved skills after the COVID-19 pandemic. For instance, it is recommended to use technology in industrial-intensive industries, such as online teaching in schools and workplaces. However, while remaining at home, the public paid much attention to COVID-19 news. Such attention to media is reportedly another cause of COVD-19 pandemic fear (Ashraf, Citation2020b; Topcu & Gulal, Citation2020).
In conclusion, the economic recovery of economies in the post-COVID-19 period can be achieved through mixed fiscal and monetary policies to establish high levels of liquidity and add to citizens’ purchasing power, thereby increasing the overall consumption and aggregate demand of individuals. Human capital is irreplaceable, as there is no substitute for the human brain’s decision-making capabilities. The progress of artificial intelligence (AI) made in this field is not comparable to the originality and capabilities of the human mind. Therefore, to recover, economies must first heal their human capital/populations with solutions to the spread of the coronavirus in terms of better health care and quicker and safer vaccines and protective gear.
Another essential part is the micro-, small-, and medium-sized enterprises (MSMEs), which shape over 50% of the economies in many countries. Supporting MSMEs through credit guarantee schemes, low-interest loan programs, and tax cuts, especially during the COVID-19 pandemic, could have multiple advantages for recovering from the economic recession, creating jobs, and decreasing imports. Considering the challenge of controlling the pandemic, how and when the COVID-19 crisis will end will determine the parameters of different policy responses.
Disclosure statement
No potential conflict of interest was provided by the author(s).
Additional information
Funding
References
- Akhtaruzzaman, M., Boubaker, S., & Sensoy, A. (2021). Financial contagion during COVID–19 crisis. Finance Research Letters, 38, 101604. https://doi.org/10.1016/j.frl.2020.101604
- Akinsomi, O. (2020). How resilient are REITs to a pandemic? The COVID-19 effect. Journal of Property Investment & Finance, 39(1), 19–24. https://doi.org/10.1108/JPIF-06-2020-0065
- Alemzero, D. A., Iqbal, N., Iqbal, S., Mohsin, M., Chukwuma, N. J., & Shah, B. A. (2020a). Assessing the perceived impact of exploration and production of hydrocarbons on households perspective of environmental regulation in Ghana. Environmental Science and Pollution Research, https://doi.org/10.1007/s11356-020-10880-3
- Alemzero, D. A., Sun, H., Mohsin, M., Iqbal, N., Nadeem, M., & Vo, X. V. (2020b). Assessing energy security in Africa based on multi-dimensional approach of principal composite analysis. Environmental Science and Pollution Research, 1–14. https://doi.org/10.1007/s11356-020-10554-0
- Anser, M. K., Abbas, Q., Chaudhry, I. S., & Khan, A. (2020a). Optimal oil stockpiling, peak oil, and general equilibrium: case study of South Asia (oil importers) and Middle East (oil supplier). Environmental Science and Pollution Research, 1–10. https://doi.org/10.1007/s11356-020-08419-7
- Anser, M. K., Ali, M., Anwar, F., & Usman, M. (2020b). Subjective age and job satisfaction: A moderated mediation model of job burnout and chronological age. Frontiers in Public Health, https://doi.org/10.3389/fpubh.2020.00062
- Anser, M. K., Yousaf, Z., Awan, U., Nassani, A. A., Abro, M. M., & Zaman, K. (2020c). Identifying the carbon emissions damage to international tourism: Turn a blind eye. Sustain. Sustainability, 12(5), 1937. https://doi.org/10.3390/su12051937
- Anser, M., Yousaf, Z., Majid, A., & Yasir, M. (2020d). Does corporate social responsibility commitment and participation predict environmental and social performance? Corporate Social Responsibility and Environmental Managemen, https://doi.org/10.1002/csr.1977
- Anser, M. K., Yousaf, Z., Usman, M., Yousaf, S., Fatima, N., Hussain, H., & Waheed, J. (2020e). Strategic business performance through network capability and structural flexibility. Management Decision, 59(2), 426–445. https://doi.org/10.1108/MD-06-2019-0741
- Ashraf, B. N. (2020a). Economic impact of government interventions during the COVID-19 pandemic: International evidence from financial markets. Journal of Behavioral and Experimental Finance, 27, 100371. https://doi.org/10.1016/j.jbef.2020.100371
- Ashraf, B. N. (2020b). Stock markets’ reaction to COVID-19: Cases or fatalities? Research in International Business and Finance, 54, 101249. https://doi.org/10.1016/j.ribaf.2020.101249
- Asif, M., Khan, K. B., Anser, M. K., Nassani, A. A., Abro, M. M. Q., & Zaman, K. (2020). Dynamic interaction between financial development and natural resources: Evaluating the ‘Resource curse’ hypothesis. Resources Policy, 65, 101566. https://doi.org/10.1016/j.resourpol.2019.101566
- Aydın, L., & Ari, I. (2020). The impact of Covid-19 on Turkey’s non-recoverable economic sectors compensating with falling crude oil prices: A computable general equilibrium analysis. Energy Exploration & Exploitation, https://doi.org/10.1177/0144598720934007
- Barbier, E. B., & Burgess, J. C. (2020). Sustainability and development after COVID-19. World Development, 135, 105082. https://doi.org/10.1016/j.worlddev.2020.105082
- Breitung, J., & Candelon, B. (2006). Testing for short- and long-run causality: A frequency-domain approach. Journal of Econometrics, https://doi.org/10.1016/j.jeconom.2005.02.004
- Chandio, A. A., Jiang, Y., Rehman, A., Twumasi, M. A., Pathan, A. G., & Mohsin, M. (2020). Determinants of demand for credit by small holder farmers’: a farm level analysis based on survey in Sindh, Pakistan. Journal of Asian Business and Economic Studies. https://doi.org/10.1108/JABES-01-2020-0004
- Corbet, S., Larkin, C., & Lucey, B. (2020). The contagion effects of the COVID-19 pandemic: Evidence from gold and cryptocurrencies. Finance Research Letters, 35, 101554. https://doi.org/10.1016/j.frl.2020.101554
- Daughton, C. G. (2020). Wastewater surveillance for population-wide Covid-19: The present and future. The Science of the Total Environment, 736, 139631. https://doi.org/10.1016/j.scitotenv.2020.139631
- Engelhardt, N., Krause, M., Neukirchen, D., & Posch, P. N. (2021). Trust and stock market volatility during the COVID-19 crisis. Finance Research Letters, 38, 101873. https://doi.org/10.1016/j.frl.2020.101873
- Feng, Q., Sun, X., Liu, C., & Li, J. (2021). Spillovers between sovereign CDS and exchange rate markets: the role of market fear. The North American Journal of Economics and Finance, 55, 101308. https://doi.org/10.1016/j.najef.2020.101308
- Geweke, J. (1991). Evaluating the accuracy of sampling-based approaches to the calculation of posterior moments (Vol. 196). Minneapolis, MN: Federal Reserve Bank of Minneapolis, Research Department.
- Haroon, O., & Rizvi, S. A. R. (2020). COVID-19: Media coverage and financial markets behavior—A sectoral inquiry. Journal of Behavioral and Experimental Finance, 27, 100343. https://doi.org/10.1016/j.jbef.2020.100343
- He, Q., Liu, J., Wang, S., & Yu, J. (2020). The impact of COVID-19 on stock markets. Economics and Political Studies, https://doi.org/10.1080/20954816.2020.1757570
- Huynh, T. L. D., Nasir, M. A., Vo, X. V., & Nguyen, T. T. (2020). Small things matter most”: The spillover effects in the cryptocurrency market and gold as a silver bullet. The North American Journal of Economics and Finance, 54, 101277. https://doi.org/10.1016/j.najef.2020.101277
- Ikram, M., Mahmoudi, A., Shah, S. Z. A., & Mohsin, M. (2019). Forecasting number of ISO 14001 certifications of selected countries: application of even GM (1,1), DGM, and NDGM models. Environmental Science and Pollution Research, https://doi.org/10.1007/s11356-019-04534-2
- Iqbal, N., Fareed, Z., Shahzad, F., He, X., Shahzad, U., & Lina, M. (2020). The nexus between COVID-19, temperature and exchange rate in Wuhan city: New findings from partial and multiple wavelet coherence. The Science of the Total Environment, 729, 138916. https://doi.org/10.1016/j.scitotenv.2020.138916
- Iram, R., Anser, M. K., Awan, R. U., Ali, A., Abbas, Q., & Chaudhry, I. S. (2021). Prioritization of Renewable Solar Energy to Prevent Energy Insecurity: An Integrated Role. The Singapore Economic Review, 66(02), 391–412. https://doi.org/10.1142/S021759082043002X
- Lopez-Tiro, F., Peregrina-Barreto, H., Rangel-Magdaleno, J., Ramirez-San-Juan, J. C., & Ramirez-Cortes, J. M. (2020). Effect of the Exposure Time in Laser Speckle Imaging for Improving Blood Vessels Localization: a Wavelet Approach. In 2020 IEEE International Instrumentation and Measurement Technology Conference (I2MTC) (pp. 1–6). IEEE.
- Lyócsa, Š., & Molnár, P. (2020). Stock market oscillations during the corona crash: The role of fear and uncertainty. Finance Research Letters, 36, 101707. https://doi.org/10.1016/j.frl.2020.101707
- Mirza, N., Naqvi, B., Rahat, B., & Rizvi, S. K. A. (2020a). Price reaction, volatility timing and funds’ performance during Covid-19. Finance Research Letters, 36, 101657. https://doi.org/10.1016/j.frl.2020.101657
- Mirza, N., Rahat, B., Naqvi, B., & Rizvi, S. K. A. (2020b). Impact of Covid-19 on corporate solvency and possible policy responses in the EU. The Quarterly Review of Economics and Finance, https://doi.org/10.1016/j.qref.2020.09.002
- Mohsin, M., Hanif, I., Taghizadeh-Hesary, F., Abbas, Q., & Iqbal, W. (2021). Nexus between energy efficiency and electricity reforms: A DEA-Based way forward for clean power development. Energy Policy, 149, 112052. https://doi.org/10.1016/j.enpol.2020.112052
- Mohsin, M., Zhou, P., Iqbal, N., & Shah, S. A. A. (2018). Assessing oil supply security of. Energy, 155, 438–447. https://doi.org/10.1016/j.energy.2018.04.116
- Narayan, P. K., Phan, D. H. B., & Liu, G. (2021). COVID-19 lockdowns, stimulus packages, travel bans, and stock returns. Finance Research Letters, 38, 101732. https://doi.org/10.1016/j.frl.2020.101732
- Okorie, D. I., & Lin, B. (2021). Stock markets and the COVID-19 fractal contagion effects. Finance Research Letters, 38, 101640. https://doi.org/10.1016/j.frl.2020.101640
- Phan, D. H. B., & Narayan, P. K. (2020). Country Responses and the Reaction of the Stock Market to COVID-19—a Preliminary Exposition. Emerging Markets Finance and Trade, 56(10), 2138–2150. https://doi.org/10.1080/1540496X.2020.1784719
- Quigley, M. C., Attanayake, J., King, A., & Prideaux, F. (2020). A multi-hazards earth science perspective on the COVID-19 pandemic: the potential for concurrent and cascading crises. Environment Systems and Decisions, 40, 199–215. https://doi.org/10.1007/s10669-020-09772-1
- Rasheed, H. M. W., & Anser, M. K. (2017). Effect on Brand Loyalty in Mobile Phone Purchasing (A Case Study in Bahawalpur, Pakistan). Journal of Public Administration and Governance, 7(1), 102–115. https://doi.org/10.5296/jpag.v7i1.11042
- Rizvi, S. K. A., Mirza, N., Naqvi, B., & Rahat, B. (2020). Covid-19 and asset management in EU: a preliminary assessment of performance and investment styles. Journal of Asset Management, 21(4), 281–291. https://doi.org/10.1057/s41260-020-00172-3
- Rowan, N. J., & Galanakis, C. M. (2020). Unlocking challenges and opportunities presented by COVID-19 pandemic for cross-cutting disruption in agri-food and green deal innovations: Quo Vadis? Science of the Total Environment, 141362. https://doi.org/10.1016/j.scitotenv.2020.141362
- Salisu, A. A., & Akanni, L. O. (2020). Constructing a Global Fear Index for the COVID-19 Pandemic. Emerging Markets Finance and Trade, https://doi.org/10.1080/1540496X.2020.1785424
- Sarker, S. A., Wang, S., Mehedi Adnan, K. M., Anser, M. K., Ayoub, Z., Ho, T. H., Tama, R. A. Z., Trunina, A., & Hoque, M. M. (2020). Economic viability and socio-environmental impacts of solar home systems for off-grid rural electrification in Bangladesh. Energies, 13(3), 679. https://doi.org/10.3390/en13030679
- Shah, S. A. A., Zhou, P., Walasai, G. D., & Mohsin, M. (2019). Energy security and environmental sustainability index of South Asian countries: A composite index approach. Ecological Indicators, 106, 105507. https://doi.org/10.1016/j.ecolind.2019.105507
- Straif-Bourgeois, S., & Robinson, W. (2020). About coronavirus disease 2019 (CoviD-19). J. Health Care Finance.
- Sun, L., Cao, X., Alharthi, M., Zhang, J., Taghizadeh-Hesary, F., & Mohsin, M. (2020a). Carbon emission transfer strategies in supply chain with lag time of emission reduction technologies and low-carbon preference of consumers. Journal of Cleaner Production, 264, 121664. https://doi.org/10.1016/j.jclepro.2020.121664
- Sun, H., Pofoura, A. K., Adjei Mensah, I., Li, L., & Mohsin, M. (2020). The role of environmental entrepreneurship for sustainable development: Evidence from 35 countries in Sub-Saharan Africa. The Science of the Total Environment, 741, 140132. https://doi.org/10.1016/j.scitotenv.2020.140132
- Sun, L., Qin, L., Taghizadeh-Hesary, F., Zhang, J., Mohsin, M., & Chaudhry, I. S. (2020b). Analyzing carbon emission transfer network structure among provinces in China: new evidence from social network analysis. Environmental Science and Pollution Research, https://doi.org/10.1007/s11356-020-08911-0
- Tehreem, H. S., Anser, M. K., Nassani, A. A., Abro, M. M. Q., & Zaman, K. (2020). Impact of average temperature, energy demand, sectoral value added, and population growth on water resource quality and mortality rate: it is time to stop waiting around. Environmental Science and Pollution Research, 27(30), 37626–37644. https://doi.org/10.1007/s11356-020-09822-w
- Topcu, M., & Gulal, O. S. (2020). The impact of COVID-19 on emerging stock markets. Finance Research Letters, 36, 101691. https://doi.org/10.1016/j.frl.2020.101691
- Uddin, M., Chowdhury, A., Anderson, K., & Chaudhuri, K. (2021). The effect of COVID – 19 pandemic on global stock market volatility: Can economic strength help to manage the uncertainty? Journal of Business Research, https://doi.org/10.1016/j.jbusres.2021.01.061
- Xu, Y., Chen, Z., Peng, M. Y. P., & Anser, M. K. (2020). Enhancing consumer online purchase intention through gamification in China: Perspective of cognitive evaluation theory. Frontiers in Psychology, 11. https://doi.org/10.3389/fpsyg.2020.581200
- Yarovaya, L., Mirza, N., Abaidi, J., & Hasnaoui, A. (2021). Human Capital efficiency and equity funds’ performance during the COVID-19 pandemic. International Review of Economics & Finance, 71, 584–591. https://doi.org/10.1016/j.iref.2020.09.017
- Yoshino, N., Taghizadeh-Hesary, F., & Otsuka, M. (2021). Covid-19 and optimal portfolio selection for investment in sustainable development goals. Finance Research Letters, 38, 101695. https://doi.org/10.1016/j.frl.2020.101695
- Yousaf, S., Anser, M. K., Tariq, M., Jawad, S. U. R. S., Naushad, S., & Yousaf, Z. (2020). Does technology orientation predict firm performance through firm innovativeness? World Journal of Entrepreneurship, Management and Sustainable Development, 17(1), 140–151. https://doi.org/10.1108/WJEMSD-11-2019-0091
- Zaremba, A., Kizys, R., Aharon, D. Y., & Demir, E. (2020). Infected markets: Novel coronavirus, government interventions, and stock return volatility around the globe. Finance Research Letters, 35, 101597. https://doi.org/10.1016/j.frl.2020.101597
- Zhang, D., Hu, M., & Ji, Q. (2020). Financial markets under the global pandemic of COVID-19. Finance Research Letters, 36, 101528. https://doi.org/10.1016/j.frl.2020.101528
- Zhang, W., Wang, Y., Yang, L., & Wang, C. (2020). Suspending classes without stopping learning: China’s education emergency management policy in the COVID-19 outbreak. Journal of Risk and Financial Management, 13(3), 55. https://doi.org/10.3390/jrfm13030055