
 ?Mathematical formulae have been encoded as MathML and are displayed in this HTML version using MathJax in order to improve their display. Uncheck the box to turn MathJax off. This feature requires Javascript. Click on a formula to zoom.
Abstract
This study uses hourly data to analyse the return and volatility transmission of oil-gold and oil-Bitcoin pairs during the pre-COVID-19 and COVID-19 periods. The results show that the return transmissions vary across the two periods for both pairs. There is a unidirectional volatility spill-over from gold to oil in the pre-COVID-19 period, and from oil to gold during the COVID-19 period. There is a significant volatility spill-over from Bitcoin to oil during the pre-COVID-19 period, whereas no evidence of volatility spill-over between oil and Bitcoin is shown during the COVID-19 period. Based on optimal weights, investors should increase their investments in, (a) gold for a portfolio of oil-gold, and (b) Bitcoin for a portfolio of oil-Bitcoin during the COVID-19 period. All hedge ratios are higher during the COVID-19 period, implying a higher hedging cost compared to the pre-COVID-19 period. The results of hedging effectiveness reveal that the risk-adjusted returns can be improved by constructing a portfolio of oil-gold and oil-Bitcoin during both sample periods. Further results reveal that gold is a strong safe haven and a hedge for the oil market, while Bitcoin serves as a diversifier for the oil market during the COVID-19 period.
1. Introduction
The COVID-19 outbreak has adversely affected the price dynamics of many asset classes (Bouri et al., Citation2021; Mirza, Rahat, et al., Citation2020; Yarovaya et al., Citation2021; Yousaf & Ali, Citation2021), including the crude oil market. For example, international Brent oil prices declined substantially from $66.5/barrel on January 1, 2020, to around $18/barrel on April 22, 2020Footnote1, one of the largest drops in 20 years. It is therefore informative to uncover the information (return and volatility) transmission between the oil and other asset classes during the COVID-19 outbreak, because if return/volatility is transmitted from one asset to another during such an unprecedented crisis period, then portfolio managers should adjust their asset allocation to meet their risk diversification goals, and financial policymakers should adapt their policies to mitigate the contagion risk. Moreover, the information transmission between asset classes during crisis periods provides valuable insights regarding portfolio diversification, optimal hedging, and energy risk management (Umar et al., Citation2021). Among the asset classes, gold and Bitcoin have received particular attention given that they are both considered safe havens during crisis periods (e.g., Baur & McDermott, Citation2010; Reboredo, Citation2013; Yousaf et al., Citation2021 (for gold); Shahzad, Bouri, et al., Citation2019; Bouri et al., Citation2020 (for Bitcoin)).
Recent studies have investigated the return and/or volatility transmission between oil and other asset classes such as Bitcoin (Guesmi et al., Citation2019; Al-Yahyaee et al., Citation2019; Jin et al., Citation2019; Das et al., Citation2020; Ji et al., Citation2019; Okorie & Lin, Citation2020), and gold (Kang et al., Citation2017; Bouri, Jain, et al., Citation2017; Maghyereh et al., Citation2017; Balcilar et al., Citation2021; Husain et al., Citation2019; Shahzad, Rehman, et al., Citation2019) during crisis and non-crisis periods. The gold-oil linkage is well established in academic literature through the safe haven feature of gold against oil (Reboredo, Citation2013; Selmi et al., Citation2018). The relationship between oil and Bitcoin markets can be explained through the extensive usage of energy in Bitcoin mining. The annual electrical consumption of Bitcoin mining has increased from 37 TWh on January 1, 2019, to 143 TWh on April 11, 2021Footnote2, making it larger than the electrical energy usage of Argentina. In fact, the rise/decline in crude oil prices is expected to affect the cost of production and value of Bitcoin (Bouri, Jalkh, et al., Citation2017; Das & Dutta, Citation2020; Das et al., Citation2020), and evidence on the Bitcoin-energy markets’ interrelationships is provided by Corbet et al. (Citation2021). However, the hedging ability of gold and Bitcoin against the risk of crude oil have not been explored during the COVID-19 period, although gold and Bitcoin are considered hedges and/or safe havens during turbulent periods (Baur & McDermott, Citation2010; Reboredo, Citation2013; Yousaf et al., Citation2021; Shahzad, Rehman, et al., Citation2019; Bouri et al., Citation2020).
In this paper, we examine return and volatility spill-over for the pairs of oil-gold and oil-Bitcoin during the pre-COVID-19 and COVID-19 periods using the DCC-GARCH model (Engle, Citation2002) which has been applied in previous studies covering crisis and non-crisis periods (Sadorsky, Citation2012; Yousaf & Ali, Citation2020b). The main advantages of the DCC-GARCH model are the positive definiteness of the conditional covariance matrices, and its ability to estimate time-varying volatilities, covariances, and correlations among assets in a parsimonious way. Accordingly, time-varying optimal weights, hedge ratios, and hedging effectiveness for various portfolios can be computed. Furthermore, hedge and safe haven analyses are performed using the time-varying correlations of the DCC-GARCH model. To check robustness, return and volatility analysis is undertaken using the VAR-GARCH model and the BEKK-GARCH model. Notably, the VAR-GARCH model calculates static correlations (Yousaf & Ali, Citation2020a), whereas the DCC-GARCH model can be used to calculate time-varying correlations. Moreover, the hedging effectiveness is higher for DCC-GARCH based estimates compared to those based on VAR-GARCH and BEKK-GARCH models.
Our study contributes to the literature in four ways. Firstly, we examine the return and volatility spill-over during the pre-COVID-19 and COVID-19 periods. The area of integration between financial markets is understudied during the COVID-19 outbreak; therefore, this study provides early insight into this area of research by examining the integration between oil and other financial markets (gold and Bitcoin) during the COVID-19 outbreak. Secondly, we use high-frequency data (hourly) for the return and volatility spill-over analysis for the pairs of oil-gold, and oil-Bitcoin, which can provide in-depth insights for portfolio managers and traders (Katsiampa et al., Citation2019) and useful information about the microstructures of the markets. Notably, the sample size becomes large due to the use of hourly data, which is also statistically worthy given that GARCH based models require a large number of observations to produce reliable estimates . Thirdly, we estimate the time-varying correlation, optimal weights, hedge ratios, and hedging effectiveness in order to provide useful understanding for portfolio managers about the pre-COVID-19 and COVID-19 periods. Fourthly, we explore the hedge and safe haven properties of gold against the oil market during the COVID-19 outbreak, which will help investors identify hedges and safe havens for the oil market during stressful periods.
The results of the current study reveal that the return transmission varies across the pre-COVID-19 and COVID-19 periods for the pairs of oil-gold and oil-Bitcoin. The results reveal a unidirectional volatility spill-over from gold to the oil market during the pre-COVID-19 period, and oil to the gold market during the COVID-19 period. The volatility spill-over is significant from Bitcoin to oil during the pre-COVID-19 period. In contrast, there is no evidence of volatility spill-over between oil and Bitcoin during the COVID-19 period. Based on optimal weights, investors are encouraged to increase their investments in, (a) gold for the portfolio of oil-gold, and (b) Bitcoin for the portfolio of oil-Bitcoin during the COVID-19 period. All hedge ratios are found to be higher during the COVID-19 period, implying a higher hedging cost during the COVID-19 period as compared to the pre-COVID-19 period. The results for hedging effectiveness reveal that risk-adjusted returns improve by constructing a portfolio of oil-gold and oil-Bitcoin during both sample periods. Lastly, the diversifier, hedge, and safe haven analyses reveal that gold is a strong safe haven and hedge for the oil market, whereas Bitcoin serves as a diversifier for the oil market during the COVID-19 period.
The remaining five sections of this paper are: Sections 2 and 3 consist of the literature review and empirical methodology, respectively. Section 4 consists of data and preliminary analysis. Section 5 reports the study's findings. Lastly, Section 6 provides the conclusion of the study.
2. Literature review
This section provides an overview of the past literature on the linkages between oil and gold markets, and oil and Bitcoin markets during crisis and non-crisis periods.
2.1. Oil and gold
Yaya et al. (Citation2016) use the CCC-MGARCH model to study the return transmission between oil and gold markets before and after the global financial crisis. They find a bidirectional return spill-over before the crisis, and unidirectional spill-over from gold to the oil market after the crisis. Kang et al. (Citation2017) employ the DECO-GARCH model to investigate the return and volatility transmission between the future markets of crude oil, gold, silver, wheat, corn, and rice during crisis periods. They provide evidence of bidirectional return and volatility transmission between future markets, including oil and gold, during the global financial crisis and European sovereign debt crisis. Mensi et al. (Citation2017) apply the DECO-FIAPARCH model to examine the time-varying volatility spill-over between crude oil, gold, and Islamic stock indices. They provide evidence of significant risk transmission between crude oil, gold, and various Islamic indices, and correlations are found to be higher after the global financial crisis. Dutta et al. (Citation2019) examine the relationship between crude oil and precious metal markets (gold and silver) using the ARDL and non-linear causality tests. They conclude that there is a bidirectional and non-linear causal relationship between oil and metal markets. Kang et al. (Citation2021) compare the performance of oil and gold against the US sector equity exchange traded funds (ETFs) and find that oil has a stronger impact on the US equity ETFs. Adekoya et al. (Citation2021) apply Markov-regime switching models and show that gold is a hedge against the stock and oil markets during the pandemic period. Gharib et al. (Citation2021) employ a Granger causality test and report evidence of contagion between gold and oil markets during various crisis episodes, including the 2015 crash and the COVID-19 outbreak. Mensi et al. (Citation2021) examine the return spill-overs between the commodity and Chinese equity sectors using a connectedness approach. They find asymmetric return spill-overs between the commodity and Chinese equity sectors during the global financial crisis, European debt crisis, and COVID-19 outbreak.
Based on the above literature, it can be noted that none of the studies explore the return and volatility spill-over between the oil and gold markets during the COVID-19 period. Therefore, the current study addresses this literature gap using high-frequency (hourly) data.
2.2. Oil and bitcoin
Guesmi et al. (Citation2019) apply the VARMA-DCC-GJR-GARCH model and provide evidence of significant volatility spill-over between Bitcoin and other financial markets, including the oil market. Moreover, Bitcoin provides hedging and diversification benefits against oil, gold, and emerging stock markets. Using the DCC-GARCH model, Al-Yahyaee et al. (Citation2019) examine the hedge and diversification characteristics of the Bitcoin and gold markets against the crude oil and international commodity markets. They report that both Bitcoin and gold can diversify the risk of crude oil and various commodity markets. Jin et al. (Citation2019) apply the DCC-GARCH model to examine the volatility spill-over and correlations between the Bitcoin, gold, and crude oil markets. They report significant volatility transmission among the three assets, and these volatility effects are stronger from oil and gold to the Bitcoin market. The time-varying correlations are found to be positive for the pair gold-oil, but negative for the pairs Bitcoin-oil and Bitcoin-gold. Okorie and Lin (Citation2020) look at the volatility transmission between oil and ten cryptocurrency markets using the VAR-MGARCH-GJR-BEKK model and find that volatility transmission is bidirectional between the Bit Capital vendor and the oil market. Moreover, unidirectional volatility spill-over is observed from oil to the Bitcoin cash market. Lastly, volatility transmission is also reported from Ripple and Ethereum to the oil markets. Das et al. (Citation2020) investigate the hedge and safe haven characteristics of Bitcoin, gold, and the US dollar against oil implied volatility. They find that Bitcoin is not superior to gold or the US dollar for hedging oil-related uncertainties. Zeng et al. (Citation2019) find significant return transmission between Bitcoin, oil, and gold using a connectedness-based approach. Ji et al. (Citation2019) show that the information spill-over changes over time, becoming stronger between cryptocurrencies and other markets such as energy, agriculture, and metals. Huynh et al. (Citation2020) examine the role of cryptocurrencies in risk management and financial modelling in the energy market by employing the VAR model. They indicate that WTI and Brent oil indices are strongly connected with most cryptocurrencies, and that cryptocurrencies can also be used to diversify the risk of oil markets.
It can be noted from the above-mentioned literature that no previous studies investigate the return and volatility transmission between oil and Bitcoin during the COVID-19 period. We address this literature gap using hourly data.
3. Methodology
The econometric specification has two components. The returns are modelled through vector autoregression (VAR) with one lag. This allows for cross-correlations and autocorrelations in the returns. Then, the time-varying covariances and variances are modelled using the DCC-GARCH model. For a robustness check, we use the VAR-GARCH and BEKK-GARCH models.
3.1. Conditional mean
The VAR model is employed as a conditional mean equation of the DCC-GARCH, VAR-GARCH, and BEKK-GARCH models. The mean equation is specified as:
(1)
(1)
where
is the vector of returns on the x (oil) and y (gold or Bitcoin) asset at time t;
refers to a 2 × 2 matrix of parameters measuring the influence of own lagged and cross mean transmissions between two assets;
is the vector of error terms of the conditional mean equations for the two series at time t;
indicates a sequence of independently and identically distributed random errors; and
= diag (
), where
and
indicate the conditional variances of the returns for x and y assets, respectively,
3.2. Conditional variance
The conditional variance equations of DCC-GARCH, VAR-GARCH, and BEKK-GARCH are specified in the following sections.
3.2.1. DCC-GARCH model
For two assets x and y, the bivariate DCC-GARCH model has the following specification:
(2)
(2)
where
represents the conditional covariance matrix;
= diag {
is the diagonal matrix of conditional standard deviations for the x and y return series at time t, obtained from the following univariate GARCH model:
(3)
(3)
where c is a constant, is the conditional variance; and a and b are the parameters that capture the ARCH and GARCH effects, respectively.
= [
is the time-varying conditional correlation matrix:
(4)
(4)
where
is the unconditional correlation matrix of
and a symmetric positive definite matrix. The time-varying correlation estimator is extracted by calculating:
(5)
(5)
(6)
(6)
where indicates the unconditional correlation matrix of standardised residuals. This model is mean-reverting if α + <1.
3.2.2. Var-GARCH model
The conditional variance is given by:
(7)
(7)
where
denotes the conditional covariance matrix;
and B are (2 × 2) matrices of the constant, the ARCH effect, and the GARCH effect, respectively. The ARCH effect captures, (a) the effects of past own shock on the conditional volatility of the same series, and (b) the effect of past shocks in one series on the conditional volatility of other series. The GARCH effect captures, (a) the effects of past own volatility on the conditional volatility of the same series, and (b) the effect of past volatility in one series on the conditional volatility of other series.
3.2.3. Bekk-GARCH model
The full BEKK-GARCH model imposes positive definiteness restrictions. It specifies as:
(8)
(8)
where
and
denotes the conditional variance-covariance matrix. The elements of matrix A indicate the coefficients of the ARCH term, which capture, (a) the effects of past own shock on the conditional volatility of the same series, and (b) the effect of past shocks in one series on the conditional volatility of other series. The elements of matrix B represent the coefficients of the GARCH term, which captures, (a) the effects of past own volatility on the conditional volatility of the same series, and (b) the effect of past volatility in one series on the conditional volatility of other series.
3.3. Optimal weights and hedge ratios
The variances and covariances of the DCC-GARCH, VAR-GARCH, and BEKK GARCH models are used to estimate the optimal portfolio weights and hedge ratios. The optimal portfolio weights for the pairs of markets (x, y) are:
where is the weight of
asset in a one-dollar portfolio of x and
assets at time t,
is the conditional covariance between the x and y assets,
and
are the conditional variance of
and
assets, respectively, and 1-
is the weight of
asset in a one-dollar portfolio of
and
assets.
It is also essential to estimate the risk-minimizing optimal hedge ratios for the portfolio of pairs of assets. We calculate the optimal hedge ratios as:
(10)
(10)
where
represents the hedge ratio. This shows that a short position in the
asset can hedge a long position in the
asset.
3.4. Hedging effectiveness
We consider the hedging effectiveness (HE) to compare the performances of optimal portfolios. If HE is equal to 1 (less than 1) then the hedge is perfect (not perfect), and if HE = 0 there is no hedging effect. Thus, a higher HE score shows a higher risk reduction. We estimate HE as:
(11)
(11)
where
represents the variance of the unhedged portfolio (x asset only) returns, and
indicates the variation in the returns for the portfolio of x and y assets, specified as:
(12)
(12)
where,
is the weight of asset x in a one-dollar portfolio of x and y assets at time t,
is the conditional covariance between x and y assets,
and
represent the conditional variance of the x and y assets, respectively, and 1-
is the weight of the y asset in a one-dollar portfolio of x and y assets.
3.5. Diversifier, hedge, and safe haven properties
Ratner and Chiu (Citation2013) use the DCC-GARCH model to refine the methodology of Baur and McDermott (Citation2010) and propose a new way to examine the properties of a safe haven, hedge, and diversifier. Accordingly, the following regression is estimated to examine the safe haven and hedge properties of asset y against asset x during the COVID-19 crisis:
(13)
(13)
where D represents the dummy variable, which is equal to 1 during the COVID-19 crisis and zero otherwise. Asset y is a diversifier for asset x if
is positively significant (not equal to 1). Asset y is a weak hedge for asset x if
is insignificant, or a strong hedge if
is negatively significant. Asset y is a weak/strong safe haven if
is insignificant/negatively significant.
4. Data and preliminary analysis
4.1. Data
The hourly price data of oil, gold, and Bitcoin are used for two sample periods, the pre-COVID-19 period (hourly data from May 21, 2019 to December 31, 2019) and the COVID-19 period (hourly data from January 1, 2020 to May 20, 2020). As the weekly trading days and all daily trading hours are different for oil, gold, and Bitcoin markets, we use common weekdays and daily trading hours of all markets for analysis. Following Corbet et al. (Citation2020), Rizvi, Yarovaya, et al. (Citation2020), Yarovaya, Mirza, Rizvi, & Naqvi, (Citation2020), and Mirza, Naqvi, et al. (Citation2020), the COVID-19 period is considered to be from January 1, 2020, because the Chinese authorities closed the Huanan seafood market after detecting a few cases there on January 1, 2020. Moreover, the new disease, which was later named COVID-19, was formally reported to the World Health Organization on January 1, 2020 (Mirza, Hasnaoui, et al., Citation2020; Rizvi, Mirza, et al., Citation2020; Yarovaya, Mirza, Rizvi, Saba, et al., Citation2020). We use Brent spot prices and gold spot prices. The Brent spot prices are used as a proxy for international crude oil prices for around two-thirds of the international oil trade (Yousaf & Hassan, Citation2019)Footnote3. The hourly data of oil and gold are taken from Thomson Reuters, whereas the hourly price data of Bitcoin are taken from Bittrex. All prices are in US dollars.
4.2. Preliminary analysis
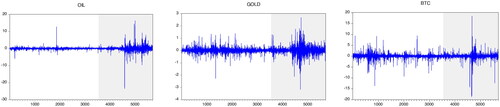
presents the hourly prices of oil, gold, and Bitcoin (BTC). It can be observed that oil prices remain almost stable in the pre-COVID-19 period, but sharply decline during the COVID-19 period. Gold prices, on average, show an upward trend during the pre-COVID-19 period and the COVID-19 period. Moreover, Bitcoin prices decline during the pre-COVID-19 period, but reveal an upward trend during the first half of the COVID-19 period then decline sharply and again show an upward trend during the second half of the COVID-19 period. Overall, COVID-19 adversely affects the oil market, but positively affects the gold and Bitcoin markets. Therefore, it is insightful to examine the pairs of oil-gold and oil-Bitcoin during the COVID-19 period. shows the volatility clustering in the returns of the oil, gold, and Bitcoin markets during the pre-COVID-19 period, and peaks of volatility clustering can be observed in all returns during the COVID-19 period.
Figure 1. Hourly prices of oil, gold, and Bitcoin.
Source: Authors' calculations.
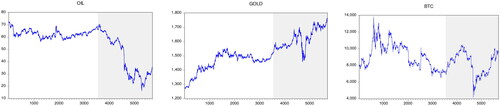
Figure 2. Hourly returns of oil, gold, and Bitcoin.
Source: Authors' calculations.
provides the descriptive statistics of the three return series in the pre-COVID-19 period (Panel A) and during the COVID-19 period (Panel B). During both periods, the average returns of the oil market are negative whereas the average returns of gold are positive. However, gold returns are higher during the COVID-19 period. In contrast, the mean returns of Bitcoin are negative in the pre-COVID-19 period, but positive during the COVID-19 period. The unconditional volatility of all return series is higher during the COVID-19 period. Gold provides higher returns with lower risk during both periods. The returns are skewed to the left (in most cases), and the kurtosis is higher than 3. The Jarque-Bera statistics reject the normality hypothesis. There are significant autocorrelation and ARCH effects in all returns during both sample periods. The presence of ARCH effects justifies the use of GARCH-based models to account for the presence of heteroskedasticity in the return series. Results of the augmented Dickey-Fuller (ADF) test indicate that all return series are stationary during both periods.
Table 1. Descriptive statistics.
provides the correlation matrix for the pairs oil-gold, oil-BTC, and gold-BTC. In the pre-COVID-19 period, the unconditional correlations are positive for the pairs oil-BTC and gold-BTC, but negative for the pair oil-gold. During the COVID-19 period, the unconditional correlations are positive for the pair oil-BTC, but negative for the oil-gold pair and gold-BTC pair. There is a higher degree of association between all pairs during the COVID-19 period, which can be explained by the higher uncertainty in the financial markets during the crisis which leads to similar kinds of investors behaviour (herding) in various markets and ultimately a rise in the correlations between assets (Yousaf et al., Citation2018).
Table 2. Correlation matrix.
5. Empirical results
5.1. Return and volatility spillovers
To examine the return and volatility spill-overs between the oil-gold and oil-BTC pairs, we mainly use the dynamic conditional correlations-generalised autoregressive conditional heteroskedasticity (DCC-GARCH) model. The selection of the DCC-GACH model is based on its higher hedging effectiveness score and lower Akaike information criterion (AIC) values, compared to the two competing models, the vector autoregressive moving average-generalized autoregressive conditional heteroskedasticity (VAR-GARCH) model and the Baba, Engle, Kraft and Kroner-generalized autoregressive conditional heteroskedasticity (BEKK-GARCH) model. The results are reported in . We note significant autocorrelation and ARCH effects for the returns of oil, gold, and Bitcoin, as shown in , hence we employ DCC-GARCH, VAR-GARCH, and BEKK-GARCH models in our analysis.
Table 3. Return and volatility spill-overs for the pair oil-gold in the pre-COVID-19 period (May 21, 2019 to December 31, 2019).
Table 4. Return and volatility spill-overs for the pair oil-gold during the COVID-19 period (January 1, 2020 to May 20, 2020).
Table 5. Return and volatility linkages for the pair oil-BTC during the pre-COVID-19 period (May 21, 2019 to December 31, 2019).
Table 6. Return and volatility linkages for the pair oil-BTC during the COVID-19 period (January 1, 2020 to May 20, 2020).
5.1.1. Oil and gold
The results for the return and volatility spill-over between the oil and gold markets in the pre-COVID-19 period and during COVID-19 are reported in and , respectively. Panel A of and reveal that the lagged returns are not significantly influenced by the current returns in the oil market during either period. For gold, past returns significantly affect the current returns only during the COVID-19 period. This finding highlights the possibility of short-term prediction of current returns through past returns in the gold market during the COVID-19 period. The findings regarding the cross return spill-overs (Panel A) in the mean equation, show that the return transmission is unidirectional from gold to the oil market during the pre-COVID-19 period. The results support Yaya et al. (Citation2016) who find that the return transmission is unidirectional from gold to the oil market during non-crisis periods. Therefore, lagged gold returns are useful in forecasting current oil returns during non-crisis periods. During the COVID-19 period, the return spill-over is not significant between the oil and gold markets.
The variance equation (Panel B) reveals that past shocks significantly influence the current conditional volatility in the oil and gold markets during both sample periods. Past volatility significantly affects the current conditional volatility in the oil and gold markets during both periods. However, the coefficients of past own volatility are higher than the coefficients of past own shocks, implying that past own volatilities are a more important factor in predicting the current volatilities than past own shocks during both periods. Based on the cross-market shock transmission, the shock spill-over is bidirectional between oil and the gold market during the pre-COVID-19 period, whereas unidirectional shock spill-over exists from oil to the gold market during the COVID-19 period.
The cross-market volatility transmission is unidirectional from gold to the oil market during the pre-COVID-19 period. This result is similar to the findings of Husain et al. (Citation2019), who find a volatility spill-over from gold to the crude oil market during non-crisis periods. In contrast, the volatility spill-over is unidirectional from oil to the gold market during the COVID-19 period. This implies that the past volatility of gold (oil) is an important factor in forecasting the risk of the oil (gold) market during non-crisis (crisis) periods.
5.1.2. Oil and bitcoin
Results for the return and volatility transmissions between oil and Bitcoin are reported for the pre-COVID-19 period () and COVID-19 period (). Based on the mean equation (Panel A), the findings reveal that the influence of lagged returns on current returns is not significant for the oil and Bitcoin markets during both periods, implying that short-term prediction of current returns is not possible through past returns in the oil and Bitcoin markets regardless of the sample period. Concerning cross-market transmissions (Panel A), the results reveal unidirectional return transmission from oil to the Bitcoin market during the pre-COVID-19 period. These results are similar to the findings of Symitsi and Chalvatzis (Citation2018), which indicate that the return spill-over is significant from the energy market to the Bitcoin market during non-crisis periods. Conversely, the return transmission is unidirectional from Bitcoin to oil during the COVID-19 period. Overall, the return spill-overs are different during the pre-COVID-19 period and the COVID-19 period.
The results of the variance equation (Panel B) show that the coefficient of past own shocks is significant in the oil and Bitcoin markets during both sample periods. In addition, the coefficient of past own volatilities is significant in the oil and Bitcoin markets during both periods. However, the coefficients of past own volatility are higher than the coefficients of past own shocks during both periods, suggesting that past own volatility is a more important factor in determining the current conditional volatility than the coefficient of past own shock. Regarding the cross-market shock spill-over, there is a unidirectional shock transmission from Bitcoin to the oil market during both pre-COVID-19 and COVID-19 periods.
Concerning the cross-market volatility transmission (Panel B), the results show evidence of a one-way directional volatility transmission from Bitcoin to the oil market during the pre-COVID-19 period. This result concords with Okorie and Lin (Citation2020) who find that the volatility transmission is unidirectional from cryptocurrencies to the crude oil market. As volatility transmission is unidirectional, the result shows that the past volatility of Bitcoin is an important factor in forecasting the risk of the oil market during the non-crisis period. Conversely, there is no evidence of volatility transmission between oil and the Bitcoin market during the COVID-19 period, suggesting that investors can get the maximum benefit of diversification by investing in a portfolio of oil and Bitcoin during the COVID-19 period.
5.2. Time-varying conditional correlations
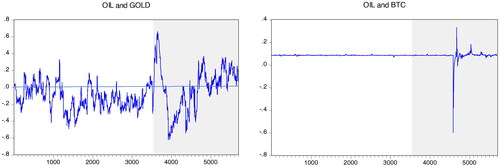
shows the time-varying correlations for the pairs oil-gold and oil-Bitcoin in the pre-COVID-19 and COVID-19 periods (highlighted area). For the pair oil-gold, it can be noted that the time-varying correlations are, on average, higher during the COVID-19 period. This result is similar to Baruník et al. (Citation2016) who report a higher correlation between the gold and oil markets during crisis periods. For the pair oil-Bitcoin, the time-varying correlations are stable during the pre-COVID-19 period but fluctuate a lot during the COVID-19 period. The time-varying correlations between oil and Bitcoin are higher during the COVID-19 period. The higher correlations for both pairs during the COVID-19 outbreak can be attributed to the changes in the beliefs of investors, which become more homogeneous following heightened uncertainty in the financial markets.
Figure 3. Pairwise dynamic conditional correlations.
Source: Authors' calculations.
5.3. Optimal weights and hedge ratios
The optimal weights and hedge ratios for the pairs oil-gold and oil-BTC in the pre-COVID-19 period and during the COVID-19 period are presented in . For the oil-gold pair, the optimal weight is 0.20 during the pre-COVID-19 period, suggesting that for a $1 portfolio of oil-gold, 20 cents should be invested in oil and the remaining 80 cents in gold. However, investors should decrease their investment in oil for a portfolio of oil-gold during the COVID-19 period given that the optimal weight is reduced to 0.09. For the pair oil-BTC, the optimal weights are lower during COVID-19 than the pre-COVID-19 period, suggesting that investors should decrease their investment in oil in a portfolio of oil-BTC during the COVID-19 outbreak.
Table 7. Optimal weights and hedge ratios.
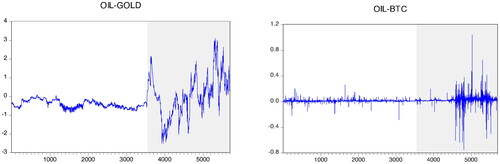
represents the time-varying hedge ratios for the pairs oil-gold and oil-BTC during both periods. The summary results from show that the optimal hedge ratio is −0.41 for the pair oil-gold, suggesting that a $1 long position in oil can be hedged for 41 cents with a long position in gold during the pre-COVID-19 period. However, the optimal hedge ratio is 0.07 for the pair oil-gold during the COVID-19 period, implying that a $1 long position in oil can be hedged for 7 cents with a short position in gold. These results imply that hedging oil through gold is more expensive during the COVID-19 period. For the pair oil-BTC, the optimal hedge ratios are higher during the COVID-19 period, suggesting that more Bitcoin is needed to minimise the risk of oil. It follows that the cost of hedging oil risk through Bitcoin is higher during the COVID-19 period.
Figure 4. Time-varying hedge ratio.
Source: Authors' calculations.
5.4. Results of HE
We present in the results of the HE of gold and Bitcoin for the oil market in the pre-COVID-19 and COVID-19 periods. The HE is computed based on the optimal weights and hedge ratios of our main models, the DCC-GARCH, and the competing VAR-GARCH and BEKK-GARCH models. shows that the risk-adjusted returns improve by constructing a portfolio of oil-gold and oil-BTC during the pre-COVID-19 period and the COVID-19 period, which is consistent with the findings of Guesmi et al. (Citation2019), and Al-Yahyaee et al. (Citation2019). The DCC-GARCH model provides the best risk-adjusted return ratio for the portfolio of oil-gold during the COVID-19 period. However, the VAR-GARCH model provides higher hedging effectiveness for a portfolio of oil-gold during the pre-COVID-19 period. Furthermore, the DCC-GARCH model provides higher hedging effectiveness during both sample periodsFootnote4. Lastly, the hedging effectiveness is higher during the COVID-19 period than the pre-COVID-19 period for portfolios of both oil-gold and oil-Bitcoin.
Table 8. Hedging effectiveness (HE) results.
5.5. Hedge and safe haven properties during COVID-19
The hedge and safe haven properties of gold and Bitcoin against the crude oil market are estimated during the COVID-19 period. The results are reported in . They reveal that the coefficient is negative and significant for gold, suggesting that gold is a strong hedge for the oil market during the COVID-19 period. The coefficient of
is negatively significant for gold, suggesting that gold serves as a safe haven against the oil market during the COVID-19 period. Gold has intrinsic value and has been used as a store of value over centuries, especially during war, turbulent, and crisis periods. Our results confirm the safe haven features of gold against oil during the COVID-19 period. The coefficient of
is significant and positive for Bitcoin, suggesting that Bitcoin serves as a diversifier. On the other hand, the coefficient of
is positive and significant for Bitcoin, implying that Bitcoin is not a safe haven for the oil market during the COVID-19 period. Our results are comparable to previous finings. For example, Conlon et al. (Citation2020) find that Bitcoin is not a safe haven for the international equity markets during COVID-19. Conversely, Goodell and Goutte (Citation2021) find that COVID-19 has led to a rise in Bitcoin prices.
Table 9. Estimation results for the hedge and safe haven properties of gold and Bitcoin against oil during the COVID-19 period.
6. Conclusion
The COVID-19 outbreak has adversely affected human life. The financial markets have been hit hard, including the oil market which declined sharply following the COVID-19 outbreak. For the sake of diversification, hedging, and portfolio risk management, we investigate in this study the return and volatility transmission between the pairs oil-gold and oil-Bitcoin using various multivariate GARCH models. We also estimate the optimal weights, hedging ratios, and hedging effectiveness for oil-gold and oil-Bitcoin portfolios during both sample periods and study the hedge and safe haven properties of gold and Bitcoin for the oil market during the COVOD-19 period.
Several interesting results emerge from our analyses. Firstly, the results involving return spill-overs show different patterns during the pre-COVID-19 period and COVID-19 period for both oil-gold and oil-Bitcoin pairs. Lagged gold returns can be used in forecasting current oil returns during the pre-COVID-19 period only. Furthermore, a unidirectional return transmission exists from oil to Bitcoin during the pre-COVID-19 period, whereas the transmission is significant from Bitcoin to the oil market during the COVID-19 period. Secondly, the results involving volatility spill-overs reveal a unidirectional volatility spill-over from gold to the oil market during the pre-COVID-19 period, whereas a unidirectional volatility spill-over exists from oil to the gold market during the COVID-19 period. The volatility spill-over effect runs from Bitcoin to oil during the pre-COVID-19 period only, suggesting that investors can diversify their portfolios by constructing portfolios of oil and Bitcoin during the COVID-19 outbreak. Thirdly, the analysis of optimal weights reveals that investors should increase their investment in gold (Bitcoin) for the portfolio of oil-gold (oil-Bitcoin) during the COVID-19 period, compared to the pre-COVID-19 period. Further results from the hedge ratios indicate that more gold and Bitcoin are needed to minimise the risk of oil during the COVID-19 period than the pre-COVID-19 period. Fourthly, risk-reduction can be improved by constructing a portfolio of oil-gold and oil-Bitcoin during both periods. Moreover, the hedging effectiveness of both portfolios is higher during the COVID-19 period. Fifthly, we reveal that gold is a strong hedge and safe haven for the oil market, whereas Bitcoin is a diversifier for the oil market during the COVID-19 period.
Overall, our findings provide useful information for portfolio managers and policymakers regarding diversification, optimal asset allocation, hedging, forecasting, and risk management. The above-mentioned findings are not only valuable for understanding the time-varying linkages between the oil-gold and oil-Bitcoin markets, but also of enormous interest to portfolio managers, investors, and investment funds that actively deal in oil, gold, and Bitcoin assets. Indeed, optimal portfolios and hedge ratios are useful for investors for constructing more robust portfolios that can reduce the risk exposure during crisis and non-crisis periods. The safe haven analysis also helps investors in the oil market reduce their risk exposure, especially during the COVID-19 outbreak. For policymakers, a change in the level of volatility transmission between the oil-gold and oil-Bitcoin markets implies that the instability of the oil market can significantly affect the other two markets. Therefore, any change in the stability of the oil market would require careful monitoring and follow-up from policymakers if they want to avoid adverse consequences from contagious shocks to the gold market.
The limitation of this study resides in its focus on the COVID-19 crisis only. Future studies could consider other crisis episodes such as the 2010-2012 European debt crisis, the 2014-2015 oil price crash, or the 2015-2016 Chinese stock market crash to uncover the similarities and differences in spill-overs during such episodes, using a frequency-based approach capable of revealing how the transmission of shocks varies between the short term and the long term for the sake of various market participants such as traders and investors. Another possibility for future research is covering a variety of sample periods, including the pre-COVID, during COVID, and recovery (after vaccination) periods using higher frequency data.
Disclosure statement
No potential conflict of interest was reported by the author(s).
Notes
2 Source: https://cbeci.org/
3 https://www.abbeycapital.com/insights/crude-oil-divergence-between-brent-crude-and-wti/. West Texas Intermediate (WTI) is considered the benchmark for US-produced crude oil, especially in light of the US fracking boom.
4 As the hedging effectiveness is higher in the DCC-GARCH model, we prefer the results of the DCC-GARCH model in this study compared to competing models.
References
- Adekoya, O. B., Oliyide, J. A., & Oduyemi, G. O. (2021). How COVID-19 upturns the hedging potentials of gold against stock markets risks: Nonlinear evidences through threshold regression and markov-regime switching models. Resources Policy, 70, 101926. https://doi.org/10.1016/j.resourpol.2020.101926
- Al-Yahyaee, K. H., Mensi, W., Al-Jarrah, I. M. W., Hamdi, A., & Kang, S. H. (2019). Volatility forecasting, downside risk, and diversification benefits of Bitcoin and oil and international commodity markets: A comparative analysis with yellow metal. The North American Journal of Economics and Finance, 49, 104–120. https://doi.org/10.1016/j.najef.2019.04.001
- Balcilar, M., Ozdemir, Z. A., & Ozdemir, H. (2021). Dynamic return and volatility spillovers among S&P 500, crude oil, and gold. International Journal of Finance & Economics, 26(1), 153–170. https://doi.org/10.1002/ijfe.1782
- Baruník, J., Kočenda, E., & Vácha, L. (2016). Gold, oil, and stocks: Dynamic correlations. International Review of Economics & Finance, 42, 186–201. https://doi.org/10.1016/j.iref.2015.08.006
- Baur, D. G., & McDermott, T. K. (2010). Is gold a safe haven? International evidence. Journal of Banking & Finance, 34(8), 1886–1898. https://doi.org/10.1016/j.jbankfin.2009.12.008
- Bouri, E., Cepni, B., Gabauer, D., & Gupta, R. (2021). Return connectedness across asset classes around the COVID-19 outbreak. International Review of Financial Analysis, 73, 101646. https://doi.org/10.1016/j.irfa.2020.101646
- Bouri, E., Jain, A., Biswal, P. C., & Roubaud, D. (2017). Cointegration and nonlinear causality amongst gold, oil, and the Indian stock market: Evidence from implied volatility indices. Resources Policy, 52, 201–206. https://doi.org/10.1016/j.resourpol.2017.03.003
- Bouri, E., Jalkh, N., Molnár, P., & Roubaud, D. (2017). Bitcoin for energy commodities before and after the December 2013 crash: diversifier, hedge or safe haven? Applied Economics, 49(50), 1–5073. https://doi.org/10.1080/00036846.2017.1299102
- Bouri, E., Shahzad, S. J. H., Roubaud, D., Kristoufek, L., & Lucey, B. (2020). Bitcoin, gold, and commodities as safe-havens for stocks: New insight through wavelet analysis. The Quarterly Review of Economics and Finance, 77, 156–164. https://doi.org/10.1016/j.qref.2020.03.004
- Conlon, T., Corbet, S., & McGee, R. J. (2020). Are cryptocurrencies a safe haven for equity markets? An international perspective from the COVID-19 pandemic. Research in International Business and Finance, 54, 101248. https://doi.org/10.1016/j.ribaf.2020.101248
- Corbet, S., Larkin, C., & Lucey, B. (2020). The contagion effects of the covid-19 pandemic: Evidence from gold and cryptocurrencies. Finance Research Letters, 35, 101554. https://doi.org/10.1016/j.frl.2020.101554
- Corbet, S., Lucey, B., & Yarovaya, L. (2021). Bitcoin-energy markets interrelationships-New evidence. Resources Policy, 70, 101916. https://doi.org/10.1016/j.resourpol.2020.101916
- Das, D., & Dutta, A. (2020). Bitcoin’s energy consumption: Is it the Achilles heel to miner’s revenue? Economics Letters, 186, 108530. https://doi.org/10.1016/j.econlet.2019.108530
- Das, D., Le Roux, C. L., Jana, R. K., & Dutta, A. (2020). Does Bitcoin hedge crude oil implied volatility and structural shocks? A comparison with gold, commodity and the US Dollar. Finance Research Letters, 36, 101335. https://doi.org/10.1016/j.frl.2019.101335
- Dutta, A., Bouri, E., & Roubaud, D. (2019). Nonlinear relationships amongst the implied volatilities of crude oil and precious metals. Resources Policy, 61, 473–478. https://doi.org/10.1016/j.resourpol.2018.04.009
- Engle, R. F. (1982). Autoregressive conditional heteroscedasticity with estimates of the variance of United Kingdom inflation. Econometrica: Journal of the econometric society, 987–1007.
- Engle, R. (2002). Dynamic conditional correlation: A simple class of multivariate generalized autoregressive conditional heteroskedasticity models. Journal of Business & Economic Statistics, 20(3), 339–350. https://doi.org/10.1198/073500102288618487
- Gharib, C., Mefteh-Wali, S., & Jabeur, S. B. (2021). The bubble contagion effect of COVID-19 outbreak: Evidence from crude oil and gold markets. Finance Research Letters, 38, 101703. https://doi.org/10.1016/j.frl.2020.101703
- Goodell, J. W., & Goutte, S. (2021). Co-movement of COVID-19 and Bitcoin: Evidence from wavelet coherence analysis. Finance Research Letters, 38, 101625. https://doi.org/10.1016/j.frl.2020.101625
- Guesmi, K., Saadi, S., Abid, I., & Ftiti, Z. (2019). Portfolio diversification with virtual currency: Evidence from bitcoin. International Review of Financial Analysis, 63, 431–437. https://doi.org/10.1016/j.irfa.2018.03.004
- Husain, S., Tiwari, A. K., Sohag, K., & Shahbaz, M. (2019). Connectedness among crude oil prices, stock index and metal prices: An application of network approach in the USA. Resources Policy, 62, 57–65. https://doi.org/10.1016/j.resourpol.2019.03.011
- Huynh, T. L. D., Shahbaz, M., Nasir, M. A., & Ullah, S. (2020). Financial modelling, risk management of energy instruments and the role of cryptocurrencies. Annals of Operations Research. https://doi.org/10.1007/s10479-020-03680-y
- Ji, Q., Bouri, E., Roubaud, D., & Kristoufek, L. (2019). Information interdependence among energy, cryptocurrency and major commodity markets. Energy Economics, 81, 1042–1055. https://doi.org/10.1016/j.eneco.2019.06.005
- Jin, J., Yu, J., Hu, Y., & Shang, Y. (2019). Which one is more informative in determining price movements of hedging assets? Evidence from Bitcoin, gold and crude oil markets. Physica A: Statistical Mechanics and Its Applications, 527, 121121. https://doi.org/10.1016/j.physa.2019.121121
- Kang, S. H., McIver, R., & Yoon, S. M. (2017). Dynamic spill-over effects among crude oil, precious metal, and agricultural commodity futures markets. Energy Economics, 62, 19–32. https://doi.org/10.1016/j.eneco.2016.12.011
- Kang, S., Hernandez, J. A., Sadorsky, P., & McIver, R. (2021). Frequency spillovers, connectedness, and the hedging effectiveness of oil and gold for US sector ETFs. Energy Economics, 99, 105278. https://doi.org/10.1016/j.eneco.2021.105278
- Katsiampa, P., Corbet, S., & Lucey, B. (2019). High frequency volatility co-movements in cryptocurrency markets. Journal of International Financial Markets, Institutions and Money, 62, 35–52.
- Maghyereh, A. I., Awartani, B., & Tziogkidis, P. (2017). Volatility spillovers and cross-hedging between gold, oil and equities: Evidence from the Gulf Cooperation Council countries. Energy Economics, 68, 440–453. https://doi.org/10.1016/j.eneco.2017.10.025
- Mensi, W., Al Rababa'a, A. R., Vo, X. V., & Kang, S. H. (2021). Asymmetric spill-over and network connectedness between crude oil, gold, and Chinese sector stock markets. Energy Economics, 98, 105262. https://doi.org/10.1016/j.eneco.2021.105262
- Mensi, W., Hammoudeh, S., Al-Jarrah, I. M. W., Sensoy, A., & Kang, S. H. (2017). Dynamic risk spillovers between gold, oil prices and conventional, sustainability and Islamic equity aggregates and sectors with portfolio implications. Energy Economics, 67, 454–475. https://doi.org/10.1016/j.eneco.2017.08.031
- Mirza, N., Hasnaoui, J. A., Naqvi, B., & Rizvi, S. K. A. (2020). The impact of human capital efficiency on Latin American mutual funds during Covid-19 outbreak. Swiss Journal of Economics and Statistics, 156(1), 1–7. https://doi.org/10.1186/s41937-020-00066-6
- Mirza, N., Naqvi, B., Rahat, B., & Rizvi, S. K. A. (2020). Price reaction, volatility timing and funds’ performance during Covid-19. Finance Research Letters, 36, 101657. https://doi.org/10.1016/j.frl.2020.101657
- Mirza, N., Rahat, B., Naqvi, B., & Rizvi, S. K. A. (2020). Impact of Covid-19 on corporate solvency and possible policy responses in the EU. The Quarterly Review of Economics and Finance, https://doi.org/10.1016/j.qref.2020.09.002
- Okorie, D. I., & Lin, B. (2020). Crude oil price and cryptocurrencies: Evidence of volatility connectedness and hedging strategy. Energy Economics, 87, 104703. https://doi.org/10.1016/j.eneco.2020.104703
- Ratner, M., & Chiu, C. C. J. (2013). Hedging stock sector risk with credit default swaps. International Review of Financial Analysis, 30, 18–25. https://doi.org/10.1016/j.irfa.2013.05.001
- Reboredo, J. C. (2013). Is gold a hedge or safe haven against oil price movements? Resources Policy, 38(2), 130–137. https://doi.org/10.1016/j.resourpol.2013.02.003
- Rizvi, S. K. A., Mirza, N., Naqvi, B., & Rahat, B. (2020). Covid-19 and asset management in EU: A preliminary assessment of performance and investment styles. Journal of Asset Management, 21(4), 281–291. https://doi.org/10.1057/s41260-020-00172-3
- Rizvi, S. K. A., Yarovaya, L., Mirza, N., & Naqvi, B. (2020). The impact of COVID-19 on valuations of non-financial European firms. Available at SSRN 3705462.
- Sadorsky, P. (2012). Correlations and volatility spillovers between oil prices and the stock prices of clean energy and technology companies. Energy Economics, 34(1), 248–255. https://doi.org/10.1016/j.eneco.2011.03.006
- Selmi, R., Mensi, W., Hammoudeh, S., & Bouoiyour, J. (2018). Is Bitcoin a hedge, a safe haven or a diversifier for oil price movements? A comparison with gold. Energy Economics, 74, 787–801. https://doi.org/10.1016/j.eneco.2018.07.007
- Shahzad, S. J. H., Bouri, E., Roubaud, D., Kristoufek, L., & Lucey, B. (2019). Is Bitcoin a better safe-haven investment than gold and commodities? International Review of Financial Analysis, 63, 322–330. https://doi.org/10.1016/j.irfa.2019.01.002
- Shahzad, S. J. H., Rehman, M. U., & Jammazi, R. (2019). Spillovers from oil to precious metals: Quantile approaches. Resources Policy, 61, 508–521. https://doi.org/10.1016/j.resourpol.2018.05.002
- Symitsi, E., & Chalvatzis, K. J. (2018). Return, volatility and shock spillovers of Bitcoin with energy and technology companies. Economics Letters, 170, 127–130. https://doi.org/10.1016/j.econlet.2018.06.012
- Umar, Z., Gubareva, M., Yousaf, I., & Ali, S. (2021). A tale of company fundamentals vs sentiment driven pricing: The case of GameStop. Journal of Behavioral and Experimental Finance, 30, 100501.
- Yarovaya, L., Mirza, N., Abaidi, J., & Hasnaoui, A. (2021). Human capital efficiency and equity funds’ performance during the COVID-19 pandemic. International Review of Economics & Finance, 71, 584–591. https://doi.org/10.1016/j.iref.2020.09.017
- Yarovaya, L., Mirza, N., Rizvi, S. K. A., & Naqvi, B. (2020). COVID-19 Pandemic and Stress Testing the Eurozone Credit Portfolios. Available at SSRN 3705474.
- Yarovaya, L., Mirza, N., Rizvi, S. K. A., Saba, I., Naqvi, B. (2020). The Resilience of Islamic Equity Funds during COVID-19: Evidence from Risk Adjusted Performance, Investment Styles and Volatility Timing. Investment Styles and Volatility Timing (November 25, 2020). https://ssrn.com/abstract=3737689
- Yaya, O. S., Tumala, M. M., & Udomboso, C. G. (2016). Volatility persistence and returns spillovers between oil and gold prices: Analysis before and after the global financial crisis. Resources Policy, 49, 273–281. https://doi.org/10.1016/j.resourpol.2016.06.008
- Yousaf, I., & Ali, S. (2020a). Discovering interlinkages between major cryptocurrencies using high-frequency data: new evidence from COVID-19 pandemic. Financial Innovation, 6(1), 1–18. https://doi.org/10.1186/s40854-020-00213-1
- Yousaf, I., & Ali, S. (2020b). The COVID-19 outbreak and high frequency information transmission between major cryptocurrencies: Evidence from the VAR-DCC-GARCH approach. Borsa Istanbul Review, 20, S1–S10. https://doi.org/10.1016/j.bir.2020.10.003
- Yousaf, I., & Ali, S. (2021). Linkages between stock and cryptocurrency markets during the COVID-19 outbreak: An intraday analysis. The Singapore Economic Review, https://doi.org/10.1142/S0217590821470019
- Yousaf, I., & Hassan, A. (2019). Linkages between crude oil and emerging Asian stock markets: New evidence from the Chinese stock market crash. Finance Research Letters, 31, 207–217. https://doi.org/10.1016/j.frl.2019.08.023
- Yousaf, I., Ali, S., & Shah, S. Z. A. (2018). Herding behavior in Ramadan and financial crises: the case of the Pakistani stock market. Financial Innovation, 4(1), 1–14. https://doi.org/10.1186/s40854-018-0098-9
- Yousaf, I., Bouri, E., Ali, S., & Azoury, N. (2021). Gold against Asian Stock Markets during the COVID-19 Outbreak. Journal of Risk and Financial Management, 14(4), 186. https://doi.org/10.3390/jrfm14040186
- Zeng, S., Liu, X., Li, X., Wei, Q., & Shang, Y. (2019). Information dominance among hedging assets: Evidence from return and volatility directional spillovers in time and frequency domains. Physica A: Statistical Mechanics and Its Applications, 536, 122565. https://doi.org/10.1016/j.physa.2019.122565