
 ?Mathematical formulae have been encoded as MathML and are displayed in this HTML version using MathJax in order to improve their display. Uncheck the box to turn MathJax off. This feature requires Javascript. Click on a formula to zoom.
Abstract
During the recent COVID-19 outbreak, the crude oil market experienced enormous price fluctuations. A large number of researchers contended the volatility observed in oil market as unprecedented and it was immediately attributed to the pandemic owing to its globally devastating nature. Whether or not this attribution is justified, is the major question we have raised in this paper. We perform the comparative analysis of the volatility spasms of oil market during the COVID-19 pandemic (COVID-19), the Global financial crisis of 2008 (GFC) and the SARS outbreak of 2002–2004 (SARS). Preliminary investigation is conducted using two proxies of market sentiment which are oil price returns and oil price spread. For further investigations we apply symmetric GARCH (1,1) and the asymmetric GJR-GARCH (1,1) models. Our results based on skewness and kurtosis, indicate an extremely high degree of fat tail risk implying COVID-19 crisis as low probability yet high severity event a.k.a. black swan event. Our results further confirm the presence of volatility clustering (GARCH effect) along with the highest degree of asymmetry during COVID-19. These facts collectively make COVID-19 crisis more uncertain and pessimistic compared to the GFC and SARS.
1. Introduction
The COVID-19 pandemic has caused the worst global economic recession since the Great Depression. Also, the financial markets including the oil market encountered a considerable and unparalleled rise in the uncertainty level that consequently stimulates various challenges to policymakers, firms, investors etc. Although the high degree of volatility and uncertainty is observed almost in all financial markets (Mirza et al., Citation2020b; Rizvi et al., Citation2020a) and for all asset classes (Mirza et al., Citation2020a; Mirza et al., Citation2020c; Yarovaya et al., Citation2021), yet the Oil market has shown its distinction by setting some new records. It caught the attention of practitioners, investors, regulators and policy makers during March 2020 when the Oil prices literally entered into a negative domain, although for a very brief period of time, and primarily because of the storage limitations since inventories all across the world piled up due to the lockdown and restriction on mobility.
Since the oil market has established causal impact on other financial markets which in turn are interconnected with each other, concerns started to arise about the volatility which is primarily driven by the pandemic and its further spillovers to the rest of the financial markets. Among the first ones, (Bouri et al., Citation2020) examined the predictive power of past uncertainty that is related to different infectious diseases for instance COVID-19, SARS, MERS, Ebola, H1N1, H5N1) for volatility of oil return. However, the technique used by (Bouri et al., Citation2020), is based on the most recent newspaper-based index developed by (Baker et al., Citation2020). Although it facilitates in tracking volatility of equity market, particularly the changes in Chicago Board Options Exchange’s Volatility Index, due to transmittable diseases, yet it could be biased by other events and thus ignores the heterogeneity in the volatility of different assets and their prices.
Similarly (Narayan, Citation2020) documented that COVID-19 infections have a significant impact on volatility and returns in oil market. Further, (Demirer et al., Citation2020) reported that significant predictive information over volatility of oil market is apprehended by shocks in financial risk even after supply and demand shocks in the market are taken as control variables. The result of this study also suggested that a discrete channel of risk transmission exists between commodity and financial markets. They also asserted that shocks related to financial markets could be transferred to the oil market due to the pandemic through the following ways: (a) the mutual vital factors that are shared by oil and financial markets, (b) variations in the risk appetite of investors that give rise to hedging as well as speculating activities in the oil market. These findings are of course not new. If we look at the past literature available on this topic, we find that a number of researchers have investigated the determinants of oil price volatility and its spillovers. For instance the studies conducted by (Balcilar et al., Citation2017; Degiannakis & Filis, Citation2017; Bahloul et al., Citation2018; Bonaccolto et al., Citation2018; Gkillas et al., Citation2020).
Given the ongoing situation of COVID-19 pandemic, it is imperative to analyze how much differently this pandemic is capable to hurt oil market. There could be several dimensions of that analysis yet the first step is to compare the impact of pandemic led crisis on oil market relative to the similar crises in past. To achieve this objective, we perform the comparative analysis of the volatility spasms occurred in oil market during COVID-19 pandemic (COVID-19), Global financial crisis of 2008 (GFC) and SARS outbreak of 2002–2004 (SARS). We carefully structure our sample periods of the three crises so that the maximum yet relevant period during which the markets were exposed to the crises led shocks, can be covered. Our preliminary investigation is based on two proxies of market sentiment which are oil price returns and oil price spread. We further extend our analysis to capture volatility spasms in oil market by applying symmetric GARCH (1,1) and the asymmetric GARCH (1,1) models. Our results not only confirm the huge negative returns in oil market during COVID-19, but also highlight severe negative skewness and high kurtosis. This indicate a high degree of fat tail risk implying COVID-19 situation as low probability but high severity event a.k.a. black swan event. Our results further confirm the presence of volatility clustering (GARCH effect) in oil prices during the three crises periods and huge asymmetries during COVID-19.
The major contribution of this paper is in the form of providing readers a quantifiable comparative perspective on the volatility in oil market primarily triggered by the globally catastrophic events. Since the COVID-19 crisis is ongoing, this investigation helps policy makers and investors in laying down the foundations of an informed and calculated response should the turmoil in oil market persists.
Rest of the paper is organized as follows. In Section 2 we provide the relevant literature review. Section 3 highlights and elaborates methodology, data and sample period. Section 4 discusses the results and Section 5 concludes.
2. Review of literature
Health is vital to a prosperous and productive society; however, illness and distress are likely to affect production, travel, recreation, consumption of goods and overall economy. Various health disasters like Ebola in West Africa, the ‘Middle East Respiratory Syndrome’ (MERS) in Korea and many other epidemics resulted in more investments in global health security. Public health community is continuously working to support national systems in order to halt the global spread of diseases. Since, it is evident that such epidemics or pandemics not only have global health effects but also result in various socio-economic disturbances (UNGD, Citation2015).
The Ebola in West Africa confirmed that such infectious disease could have some serious and unforeseen economic toll. The GDP growth in Liberia reduced from 8.7% to 0.7% in Liberia due to this disease. Also, GDP growth in Sierra Leone declined from 5.3% to 0.8% (World Bank, Citation2016).
In 2016, the significance of applying the overall societal standpoint rather than only health sector viewpoint when taking into account economic influences of an infectious disease, was highlighted by the Second Panel on cost-effectiveness in health and medicine (Sanders et al., Citation2016). Likewise, World Health Organization came up with a framework within which comprehensive economic effect of diseases can be evaluated (World Health Organization, Citation2009).
As asserted by (Taylor et al., Citation2001) that sixty percent of all these infectious pathogens come from animals, so agricultural sectors involved in such infectious diseases often suffer substantial economic impacts. Also, the travel and tourism sector is hit badly by such infectious diseases. In 2003, during the SARS outbreak, the tourism sector was badly impacted as the tourist arrivals in Hong Kong decreased 68% within only two months after a warning was issued by WHO about the epidemic (Begley, Citation2013). Likewise, Singapore tourism fell more than seventy percent (Anon n.d.). Almost 800 people died and more than 8000 were infected with the SARS. The total international economic loss due to SARS outbreak was calculated to be approximately US $40 billion (The World Bank, Citation2012; Knobler, Citation2004).
World Bank conducted an analysis in which they estimated the economic losses from six main outbreaks between the period of 1997 and 2009 and their analysis revealed the losses of at least US $80 billion (The World Bank, Citation2012). Therefore, it was concluded that the extensive as well as significant economic effects of such epidemics are not only limited to health sector and such epidemics have impacts far beyond the health sector.
The findings of this review also suggested that effects of human health crises are quite significant but reporting of these impacts are likely to be inadequate. The authors also suggested that both public and private investors at all levels must work together in a more systematic way in order to warrant informed systems and a detailed risk assessment.
COVID-19 outbreak has hit the global economy badly and has amplified the volatility of financial markets. COVID-19 is very contagious and it causes great uncertainty in the financial markets and the real economy. Also, COVID-19 poses a negative impact on the overall demand by generating short-run volatility in the prices of foodFootnote1, also it hinders the movement of workers as well as tourists. The impact of this outbreak was so devastating and so multifaceted that it jeopardized the financial sustainability of firms, financial instruments and economies at the same time (Rizvi et al., Citation2020b; Yarovaya et al., Citation2020a, Citation2020b). At the same time, Saudi Arabia flooded the market with oil in March 2020 in anticipation of a strong decline in the global demand due to COVID-19. As a result, a sharp decline of more than 20% was seen in international price of oil. This oil price shock spilled over the financial markets that crashed during the same day. The association between oil prices and stock prices has been extensively discussed in the literature given the Financialization of commodity markets, for instance (Balcilar et al., Citation2019; Wen et al., Citation2019). However, the link between financial volatility and oil prices has not gained much attention.
The first strand of literature discusses the association between oil price and the financial volatility. (Illing & Liu, Citation2006) concluded that the episodes of financial stress have an impact on the stock returns and also generate volatility. It was also suggested that stock prices and oil prices are highly interrelated. Also, many studies like (Basher & Sadorsky, Citation2016; Das et al., Citation2018; Nazlioglu et al., Citation2015) reported a bidirectional association between oil prices and financial volatility.
(Nazlioglu et al., Citation2015) conducted an analysis of volatility spillover on US for the time span of twenty-three years from 1991 to 2014. The authors also used financial volatility of S&P 500 (VIX) as a proxy for financial volatility and financial stress and it was reported that there is a bidirectional link between VIX and US economic policy uncertainty. Likewise, (Das et al., Citation2018) investigated the reliance among commodity and stock prices and financial stress. The authors also reported a two-sided relationship between financial volatility and oil prices. The results also go in line with the study conducted by (Basher & Sadorsky, Citation2016).
Another strand of literature investigates the association between oil price and economic policy uncertainty (EPU). For instance, (Kang et al., Citation2017) investigated the relationship between US economic policy uncertainty and other financial and economic variables (including oil price). The results revealed that the shocks in oil price that are originated from US and non-US almost elucidate more than 20% of the variation in US economic policy uncertainty. Similar conclusions were drawn by (Antonakakis et al., Citation2014) who utilized the spillover index proposed by (Diebold & Yilmaz, Citation2012) and conjectured that that shocks in economic policy uncertainty negatively reacts to the oil price shocks and vice versa. Another study conducted by (Chen et al., Citation2020) showed that the influence of oil price shocks is positive on economic policy uncertainty (EPU) at all frequencies.
3. Methodology
3.1. Data and sample
This study takes three samples of oil prices (Crude Oil WTI Futures) based on three different crises periods. The first sample is for the period of SARS outbreak of 2002–2004 which we will be referring in this study as (SARS). The first official case of SARS was reported in the mid of November 2002, and on May 15th 2005, Jim Yardley of the New York Times wrote:
“Not a single case of the severe acute respiratory syndrome has been reported this year [2005] or in late 2004. It is the first winter without a case since the initial outbreak in late 2002. In addition, the epidemic strain of SARS that caused at least 774 deaths worldwide by June 2003 has not been seen outside of a laboratory since then.”
Nonetheless we started our sample from 1st September 2002 for full three-years period completed on 31st August 2005. In our view this sample covers sufficiently the entire period during which SARS virus emerged and then subsequently faded away.
The second sample for this study is based on the period pertaining to the Global Financial Crisis of 2008 which we will be referring as (GFC). Although the crisis is generally associated with 2008 but there are compelling evidences that it actually started in April 2007 when the New Century, an American Real Estate Investment Trust (REIT) specializing in Sub-Prime mortgages went bankrupt. This bankruptcy started turbulence in financial market which eventually led to the collapse of several related entities. Keeping in view these time lines we set the sample for GFC also for full three years to make it compatible with SARS sample, starting from 1st April 2007 and ending at 31st March 2010.
The third and the last sample of oil prices for this study is based on Corona Virus Pandemic which we term as (COVID-19). The outbreak started in Wuhan, China in December 2019 and by the time of writing this paper, it hasn’t been concluded and the situations is evolving with the third wave and different variants of virus upon us. We, therefore, are bound to rely only on the data which is available till date. The sample for COVID-19 starts from 1st December 2019 and ends at 13th April, 2021.
For preliminary investigations of Oil prices during three different events, we decide to work with two proxies of market sentiment which could reveal a lot about prices behavior, uncertainty in the market and response behavior of investors and market participants. These two proxies are daily oil price returns calculated as percentage change in one day by comparing day close price to the price of previous day and the second proxy is daily oil price spread calculated as the difference between the highest and lowest price of the day represented in terms of percentage of opening price of the same day. EquationEquations 1(1)
(1) and Equation2
(2)
(2) show the calculation of these two proxies respectively;
(1)
(1)
Where is the daily return of Crude oil futures on day t,
and
are the closing prices on day t and day t-1.
(2)
(2)
Similarly is the daily spread in oil prices on day t,
and
are the highest and lowest price on day t and
is the opening price of Crude oil futures on day t.
3.2. Model
For further investigation of returns and volatility behavior of oil prices during the three crisis period we propose to apply GARCH model on oil price returns estimated through EquationEq. 1(1)
(1) . The major utility of using GARCH family models is that they help us understanding the dynamics of returns spillovers in oil market and their role in triggering subsequent volatility (ARCH effect) and the volatility clustering mechanism (GARCH effect). We choose univariate GARCH family model to estimate the oil price volatility the three crisis periods. Two distinct specifications are chosen for each period of SARS, GFC and COVID-19. First one is the symmetric GARCH (1,1) which assumes perfect symmetry in the current volatility in response to the positive or negative shock in yesterday’s returns. The second model is asymmetric GJR-GARCH (1,1) that assumes negative shocks in yesterday’s returns will increase volatility today by a greater amount compared to the positive shocks.
Before employing the selected GARCH models, we conduct Unit Root test and ARCH tests to ensure the stationarity in data and that ARCH effect is present in all samples. Our results reject the presence of Unit Root in Oil returns in all samples and confirm the presence of ARCH effect which justifies our use of ARCH/GARCH family models.
3.3. Garch models and the construction of mean and variance equations
Engle (Citation1982) was the first one to put forward the idea of Autoregressive Conditional Heteroscedastic (ARCH) with conditional variance followed by (Bollerslev, Citation1986) who extended ARCH to Generalized Autoregressive Conditional Heteroscedastic (GARCH). Since then ARCH/GARCH models are the most widely used models to estimate returns spillovers and volatility clustering. For the purpose of constructing mean equation of returns, we assume that returns follow autoregressive process of order one AR (1) and thus returns in t period are strictly the function of returns in previous period. This choice is most appropriate for the returns in financial and futures market and has been adopted by a large number of researchers (Al-Maadid et al., Citation2017; Ji & Guo, Citation2015; Mensi et al., Citation2014; Rizvi et al., Citation2014; Rizvi & Naqvi, Citation2010; Sadorsky, Citation2012; Umar et al., Citation2021)
(3)
(3)
As for the estimation of conditional variance of returns through a symmetric GARCH model we use the following equation;
(4)
(4)
Where is conditional variance or volatility of returns on day t, based on past (t-i) squared residuals derived from mean equation as well as past volatility itself
.
While the coefficient of
is an ARCH term, and the coefficient of
is the GARCH term, measuring returns spillovers on volatility and volatility clustering or volatility persistence respectively.
To capture asymmetric behavior of volatility; we use asymmetric GJR- GARCH model (Glosten et al., Citation1993) which is one specification of asymmetric GARCH models (Baillie et al., Citation1996; Engle & Ng, Citation1993; Hentschel, Citation1995; Nelson, Citation1991)
GJR-GARCH is extended version of GARCH (p, q) and uses to capture additional asymmetric volatility.
(5)
(5)
Where the only additional term is which is a product of past squared residuals with a dummy variable
which would take value of 1 if the past residuals are negative (Actual returns < Average or Expected Returns), or the 0 otherwise. This asymmetric effect is captured through parameter
which if significant implies negative shocks in oil returns may have a pronounced effect on today’s volatility or conditional variance.
4. Results
4.1. Preliminary comparison
To begin with we first look at the descriptive statistics of daily oil price returns during the three events that we have included in our analysis i.e. SARS Outbreak of 2002–2004 (SARS), Global Financial Crisis of 2007–2010 (GFC) and the ongoing Corona Virus Pandemic (COVID-19). There are several features in that could help us understand the severity of COVID-19 crisis for oil prices. The mean returns during the entire period of COVID-19 till today are negative but the most horrifying statistics come after that. The value of minimum daily returns reflects a loss of around 305% a day with a standard deviation of 18% which is almost nine times higher than the previous two crises. Similarly, one cannot ignore the mind boggling statistics of skewness (−13.66) and kurtosis (215.85) which are roughly 43 times worse than SARS crisis and 23 times worse than GFC and indicate a high degree of fat tail risk implying COVID-19 situation as low probability but high severity event.
Table 1. Descriptive statistics of daily oil returns.
Similarly, if we look at the which shows the descriptive statistics of daily oil price spread. Daily oil price spread has been calculated as the difference between the highest and lowest price of the day represented percentage of opening price of the same day. Again the COVID-19 attributes are unique as the mean percentage spread is 5.7% almost twice as big compared to SARS and little over the GFC crisis. But the most significant observation is the maximum value of spread in a day which is 328%. This was the situation of April 20, 2020 when the market opened at $17.73, went up slightly to $17.85 but crashed during the day and prices fell, for the first time in the history to the negative of $40.32, although on that day market closed at $37.63. The negative territory for oil prices was something which had never been observed by the market participants before and it was almost unconceivable to many investors even after its happening.
Table 2. Descriptive statistics of daily oil price spread.
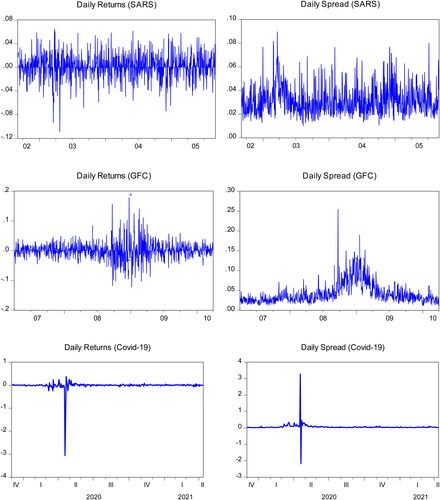
The consolidated picture of daily oil price returns and spread has also been explained with the help of below. These graphs provide a reader an opportunity to visualize the wild swings and volatility in the oil market during the three crises situations and give an instant idea of how different COVID-19 is for the oil market and investors compared to the previous two crises. It is clearly visible that during the previous two crises, the range within which daily returns and spread moved was quite narrow. During COVID-19 it seems that there is no limit or barriers and returns and spread could fall to any level.
Figure 1. Daily oil returns and daily oil price spread during SARS, GFC and COVID-19.
Source: Author's computation.
4.2. Comparison Based on returns spillovers and volatility clustering
To understand the dynamics of returns spillovers in oil market and their role in triggering subsequent volatility (ARCH effect) and the volatility clustering mechanism (GARCH effect), we ran univariate GARCH (1,1) model for oil price returns during the three crisis situation. We deployed two specifications of model for each situation, symmetric GARCH (1,1) and Asymmetric GARCH (1,1) and the results are presented below.
below presents the results of symmetric GARCH (1,1) model for the three crises periods. These results confirm the presence of volatility clustering (GARCH effect) in the three crises, however, the return spillovers on volatility (ARCH effect) can only be confirmed during global financial crisis (GFC) and during COVID-19. The relative magnitude of ARCH effect during COVID-19 is significantly larger than what it was during GFC. These results indicate that during the entire sample period of COVID-19, volatility in the oil market not only remained persistent but it was also extremely sensitive to the return shocks of previous day. This phenomenon (ARCH coefficient) seems completely insignificant during SARS and although significant yet much smaller during GFC (0.0408).
Table 3. Results of symmetric GARCH (1,1).
Despite the shocking results of , we are of the view that the information provided in are even better for our understanding of the severity of COVID-19 crisis in comparison to the other two crises. We believe due to the very nature of all three crises, Asymmetric GARCH specification is more appropriate as it is capable to capture the asymmetry effect i.e. volatility response to the negative vs positive shock. During crisis period, market tends to be more reactionary towards negative shocks in terms of triggering volatility. Results of show that the presence of volatility clustering (GARCH effect) in oil prices is significant for all three crises, however the magnitude of GARCH effect in COVID-19 is much smaller compared to its magnitude in GFC and SARS. Another important observation is the magnitude of asymmetry parameter in COVID-19, the highest among all samples. This indicates that negative shocks in oil price returns can generate huge volatility in subsequent days and because the volatility is persistent as well (GARCH effect), once it is triggered due to the negative shocks, it will prolong for several days in oil market. Finally the negative and significant value of
(ARCH effect) in SARS indicates that the positive shocks in oil market, which may be the result of increased demand or the arrival of positive news, tend to cool down the market in subsequent days by dampening the subsequent volatility. Unfortunately, the similar dampening effect of positive return shocks is not visible in GFC and COVID-19 crisis making these two crisis more uncertain pessimistic. It is important to note, however, if the returns shock is negative, it will completely erode the dampening ARCH effect and create huge volatility in oil market ().
Figure 2. Conditional standard deviations in oil returns during SARS, GFC and COVID-19 Crises.
Source: Author's computation.
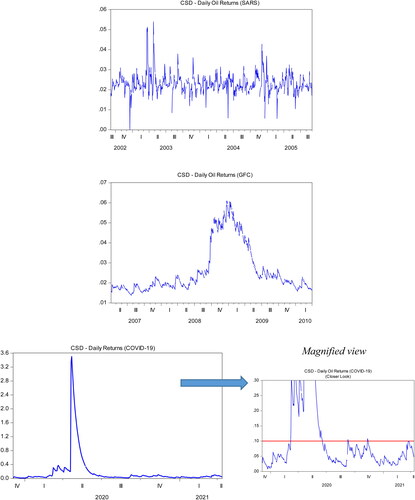
Table 4. Results of Asymmetric GARCH (1,1) [GJR-GARCH].
5. Conclusion
Among several financial markets, one of the major victim of COVI-19 pandemic is the oil market. Almost all those sectors generating the primary demand of oil such as transport, tourism, airline, were put on halt due to the worldwide lockdown imposed immediately after the outbreak of COVID-19. Unfortunately, the collapse of oil market and panic in investors has a contagion effect and it could make worsen the situation of other financial markets and could even disturb the economic growth and development in oil producing and exporting countries which may have a domino effect for their trading partners and thus has a tendency to become a full-fledged global financial crisis. This paper is an attempt to understand the response behavior of oil market to such crises. We compare the dynamics of oil market during COVID-19 crisis with that of during Global financial crisis of 2008 and SARS outbreak of 2002–2004.
We conducted our preliminary investigation by relying on two different proxies of market sentiment which are daily oil price returns daily oil price spread. For further investigation of returns and volatility behavior of oil prices during the three crisis period we apply two specifications for each crisis period, symmetric GARCH (1,1) which assumes that the impact of good or bad shock in yesterday’s returns would be symmetric on next day’s volatility and the asymmetric GARCH (1,1) models which assumes that bad shocks in yesterday’s returns will increase volatility today by a greater amount compared to the good shock. In addition to huge negative returns in oil market during COVID-19, our results confirm high negative skewness and high positive kurtosis during COVID-19 which are roughly 43 times worse than SARS crisis and 23 times worse than GFC and indicate a high degree of fat tail risk implying COVID-19 situation as low probability but high severity event.
The results of symmetric GARCH model confirm the presence of spillovers on volatility (ARCH effect) only during global financial crisis (GFC) and during COVID-19. The relative magnitude of ARCH effect during COVID-19 is significantly larger than what it was during GFC. We also found the volatility persistence (GARCH effect) is present in all three crises. These results indicate that during the entire sample period of COVID-19, volatility in the oil market not only remained persistent but it was also extremely sensitive to the return shocks of previous day.
As for the results of asymmetric GJR-GARCH model are concerned, the presence of volatility clustering (GARCH effect) in oil prices is found to be significant for all three crises, however the magnitude of GARCH effect in COVID-19 is much smaller compared to its magnitude in GFC and SARS. We also found that the asymmetry parameter is not only significant but also the highest in COVID-19.This indicates that negative shocks in oil price returns can generate huge volatility in subsequent days and because the volatility is persistent as well (GARCH effect), once it is triggered due to the negative shocks, it will prolong for several days in oil market. Finally the negative and significant value of
(ARCH effect) in SARS indicates that the positive shocks in oil market, which may be the result of increased demand or the arrival of positive news, tend to cool down the market in subsequent days by dampening the subsequent volatility. Unfortunately, the similar dampening effect of positive return shocks is not visible in GFC and COVID-19 crisis making both these crises more uncertain and pessimistic. It is important to note, however, that if the returns shock is negative, it will completely erode the dampening ARCH effect and create huge volatility in oil market.
Notes
1 Supermarkets were emptied in several countries like Italy, UK, Germany.
References
- Al-Maadid, A., Caporale, G. M., Spagnolo, F., & Spagnolo, N. (2017). Spillovers between food and energy prices and structural breaks. International Economics, 150, 1–18. https://doi.org/10.1016/j.inteco.2016.06.005
- Anon. (nd). Painful Side-Effects | The Economist.
- Antonakakis, N., Chatziantoniou, I., & Filis, G. (2014). Dynamic spillovers of oil price shocks and economic policy uncertainty. Energy Economics, 44, 433–447. https://doi.org/10.1016/j.eneco.2014.05.007
- Bahloul, W., Balcilar, M., Cunado, J., & Gupta, R. (2018). The role of economic and financial uncertainties in predicting commodity futures returns and volatility: Evidence from a nonparametric causality-in-quantiles test. Journal of Multinational Financial Management, 45, 52–71. https://doi.org/10.1016/j.mulfin.2018.04.002
- Baillie, R. T., Bollerslev, T., & Mikkelsen, H. O. (1996). Fractionally integrated generalized autoregressive conditional heteroskedasticity. Journal of Econometrics, 74(1), 3–30. https://doi.org/10.1016/S0304-4076(95)01749-6
- Baker, S., Nicholas, B., Steven, D., & Stephen, T. (2020). COVID-induced economic uncertainty (Working Paper No. 26983). National Bureau of Economic Research. https://doi.org/10.3386/w26983
- Balcilar, M., Bekiros, S., & Gupta, R. (2017). The role of news-based uncertainty indices in predicting oil markets: A hybrid nonparametric quantile causality method. Empirical Economics, 53(3), 879–889. https://doi.org/10.1007/s00181-016-1150-0
- Balcilar, M., Demirer, R., & Hammoudeh, S. (2019). Quantile relationship between oil and stock returns: Evidence from emerging and frontier stock markets. Energy Policy, 134, 110931. https://doi.org/10.1016/j.enpol.2019.110931
- Basher, S. A., & Sadorsky, P. (2016). Hedging emerging market stock prices with oil, gold, VIX, and bonds: A comparison between DCC, ADCC and GO-GARCH. Energy Economics, 54, 235–247. https://doi.org/10.1016/j.eneco.2015.11.022
- Begley, S. (2013). Flu-conomics: The next pandemic could trigger global recession. Reuters.
- Bollerslev, T. (1986). Generalized autoregressive conditional heteroskedasticity. Journal of Econometrics, 31(3), 307–327. Retrieved August 19, 2017 http://citeseerx.ist.psu.edu/viewdoc/download?doi=10.1.1.468.2892&rep=rep1&type=pdf. https://doi.org/10.1016/0304-4076(86)90063-1
- Bonaccolto, G., Caporin, M., & Gupta, R. (2018). The dynamic impact of uncertainty in causing and forecasting the distribution of oil returns and risk. Physica A: Statistical Mechanics and Its Applications, 507, 446–469. https://doi.org/10.1016/j.physa.2018.05.061
- Bouri, E., Demirer, R., Gupta, R., & Pierdzioch, C. (2020). Infectious diseases, market uncertainty and oil market volatility. Energies, 13(16), 4090. Retrieved March 25, 2021. https://www.mdpi.com/1996-1073/13/16/4090. https://doi.org/10.3390/en13164090
- Chen, X., Sun, X., & Li, J. (2020). How does economic policy uncertainty react to oil price shocks? A multi-scale perspective. Applied Economics Letters, 27(3), 188–193. https://doi.org/10.1080/13504851.2019.1610704
- Das, D., Kumar, S. B., Tiwari, A. K., Shahbaz, M., & Hasim, H. M. (2018). On the relationship of gold, crude oil, stocks with financial stress: A causality-in-quantiles approach. Finance Research Letters, 27, 169–174. https://doi.org/10.1016/j.frl.2018.02.030
- Degiannakis, S., & Filis, G. (2017). Forecasting oil price realized volatility using information channels from other asset classes. Journal of International Money and Finance, 76, 28–49. https://doi.org/10.1016/j.jimonfin.2017.05.006
- Demirer, R., Gupta, R., Pierdzioch, C., & Shahzad, S. J. H. (2020). The predictive power of oil price shocks on realized volatility of oil: A note. Resources Policy, 69, 101856. https://doi.org/10.1016/j.resourpol.2020.101856
- Diebold, F. X., & Yilmaz, K. (2012). Better to give than to receive: Predictive directional measurement of volatility spillovers. International Journal of Forecasting, 28(1), 57–66. https://doi.org/10.1016/j.ijforecast.2011.02.006
- Engle, Robert F. 1982. Autoregressive conditional heteroscedasticity with estimates of the variance of United Kingdom inflation. Econometrica, 50(4), 987–1007.
- Engle, R. F., & Ng, V. K. (1993). Measuring and testing the impact of news on volatility. The Journal of Finance, 48(5), 1749–1778. https://doi.org/10.1111/j.1540-6261.1993.tb05127.x
- Gkillas, K., Gupta, R., & Pierdzioch, C. (2020). Forecasting realized oil-price volatility: The role of financial stress and asymmetric loss. Journal of International Money and Finance, 104, 102137. https://doi.org/10.1016/j.jimonfin.2020.102137
- Glosten, L. R., Jagannathan, R., & Runkle, D. E. (1993). On the relation between the expected value and the volatility of the nominal excess return on stocks. The Journal of Finance, 48(5), 1779–1801. https://doi.org/10.1111/j.1540-6261.1993.tb05128.x
- Hentschel, L. (1995). All in the family nesting symmetric and asymmetric GARCH Models. Journal of Financial Economics, 39(1), 71–104. https://doi.org/10.1016/0304-405X(94)00821-H
- Illing, M., & Liu, Y. (2006). Measuring financial stress in a developed country: An application to Canada. Journal of Financial Stability, 2(3), 243–265. https://doi.org/10.1016/j.jfs.2006.06.002
- Ji, Q., & Guo, J. F. (2015). Oil price volatility and oil-related events: An internet concern study perspective. Applied Energy, 137, 256–264. https://doi.org/10.1016/j.apenergy.2014.10.002
- Kang, W., Ratti, R. A., & Vespignani, J. L. (2017). Oil price shocks and policy uncertainty: New evidence on the effects of US and Non-US oil production. Energy Economics, 66, 536–546. https://doi.org/10.1016/j.eneco.2017.01.027
- Knobler, S. (2004). Learning from SARS. National Academies Press.
- Mensi, W., Hammoudeh, S., Nguyen, D. K., & Yoon, S. M. (2014). Dynamic spillovers among major energy and cereal commodity prices. Energy Economics, 43, 225–243. https://doi.org/10.1016/j.eneco.2014.03.004
- Mirza, N., Hasnaoui, J. A., Naqvi, B., & Rizvi, S. K. A. (2020a). The impact of human capital efficiency on Latin American Mutual Funds during COVID-19 outbreak. Swiss Journal of Economics and Statistics, 156(1), 16. Retrieved October 27, 2020. https://doi.org/10.1186/s41937-020-00066-6
- Mirza, N. Naqvi, B., Rahat, B., & Rizvi, S. K. A, (2020b). Price reaction, volatility timing and funds’ performance during COVID-19. Finance Research Letters, 36, 101657. https://doi.org/10.1016/j.frl.2020.101657
- Mirza, N., Rahat, B., Naqvi, B., & Rizvi, S. K. A. (2020c). Impact of COVID-19 on corporate solvency and possible policy responses in the EU. The Quarterly Review of Economics and Finance. Retrieved September 23, 2020 https://linkinghub.elsevier.com/retrieve/pii/S1062976920301125. https://doi.org/10.1016/j.qref.2020.09.002
- Narayan, P. K. (2020). Oil price news and COVID-19—Is there any connection? Energy research letters, 1(1). https://doi.org/10.46557/001c.13176
- Nazlioglu, S., Soytas, U., & Gupta, R. (2015). Oil prices and financial stress: A volatility spillover analysis. Energy Policy, 82(1), 278–288. https://doi.org/10.1016/j.enpol.2015.01.003
- Nelson, D. B. (1991). Conditional heteroskedasticity in asset returns: A new approach. Econometrica, 59(2), 347. https://doi.org/10.2307/2938260
- Rizvi, S. K. A., Mirza, N., Naqvi, B., & Rahat, B. (2020a). COVID-19 and asset management in EU: A preliminary assessment of performance and investment styles. Journal of Asset Management, 21(4), 1–211. https://doi.org/10.1057/s41260-020-00172-3
- Rizvi, S. K., & Naqvi, B. (2010). Asymmetric behavior of inflation uncertainty and friedman-ball hypothesis: Evidence from Pakistan. The Lahore Journal of Economics, 15 (2), 1–33. Retrieved http://ideas.repec.org/p/pra/mprapa/19488.html. https://doi.org/10.35536/lje.2010.v15.i2.a1
- Rizvi, S. K. A., Naqvi, B., Bordes, C., & Mirza, N. (2014). Inflation volatility: An Asian perspective. Economic Research-Ekonomska Istraživanja, 27(1), 280–303. https://doi.org/10.1080/1331677X.2014.952090
- Rizvi, S. K. A., Yarovaya, L., Mirza, N., & Naqvi, B. (2020b). The impact of COVID-19 on valuations of non-financial european firms. SSRN Electronic Journal. Retrieved April 30, 2021 https://papers.ssrn.com/abstract=3705462.
- Sadorsky, P. (2012). Correlations and volatility spillovers between oil prices and the stock prices of clean energy and technology companies. Energy Economics, 34(1), 248–255. https://doi.org/10.1016/j.eneco.2011.03.006
- Sanders, G. D., Neumann, P. J., Basu, A., Brock, D. W., Feeny, D., Krahn, M., Kuntz, K. M., Meltzer, D. O., Owens, D. K., Prosser, L. A., Salomon, J. A., Sculpher, M. J., Trikalinos, T. A., Russell, L. B., Siegel, J. E., & Ganiats, T. G. (2016). Recommendations for conduct, methodological practices, and reporting of cost-effectiveness analyses: Second panel on cost-effectiveness in health and medicine. JAMA, 316(10), 1093–1103. https://doi.org/10.1001/jama.2016.12195
- Taylor, L. H., Latham, S. M., & Woolhouse, M. E. J. (2001). Risk factors for human disease emergence. Philosophical Transactions of the Royal Society of London. Series B: Biological Sciences, 356(1411), 983–989. https://doi.org/10.1098/rstb.2001.0888
- The World Bank. (2012). People, pathogens and our planet.
- Umar, M., Rizvi, S. K. A., & Naqvi, B. (2021). Dance with the devil? The Nexus of Fourth industrial revolution, technological financial products and volatility spillovers in global financial system. Technological Forecasting and Social Change, 163, 120450. Retrieved November 20, 2020 https://linkinghub.elsevier.com/retrieve/pii/S0040162520312762. https://doi.org/10.1016/j.techfore.2020.120450
- UNGD. (2015). Socio-economic impact of Ebola virus disease in West African countries a call for national and regional containment, recovery and prevention.
- Wen, F., Zhang, M., Deng, M., Zhao, Y., & Ouyang, J. (2019). Exploring the dynamic effects of financial factors on oil prices based on a TVP-VAR model. Physica A: Statistical Mechanics and Its Applications, 532, 121881. https://doi.org/10.1016/j.physa.2019.121881
- World Bank. (2016). 2014–2015 West Africa Ebola crisis: Impact update. World Bank Fiscal Report 4.
- World Health Organization. (2009). WHO guide to identifying the economic consequences of disease and injury Department of Health Systems Financing Health Systems and Services.
- Yarovaya, L., Mirza, N., Abaidi, J., & Hasnaoui, A. (2021). Human capital efficiency and equity funds’ performance during the COVID-19 pandemic. International Review of Economics & Finance, 71, 584–591. https://doi.org/10.1016/j.iref.2020.09.017
- Yarovaya, L., Mirza, N., Rizvi, S. K. A., & Naqvi, B. (2020a). COVID-19 Pandemic and stress testing the eurozone credit portfolios. SSRN Electronic Journal. Retrieved April 30, 2021 https://papers.ssrn.com/abstract=3705474.
- Yarovaya, L., Mirza, N., Rizvi, S. K. A., Saba, I., & Naqvi, B. (2020b). The resilience of Islamic equity funds during COVID-19: Evidence from risk adjusted performance, investment styles and volatility timing. SSRN Electronic Journal. Retrieved April 30, 2021 https://doi.org/https://papers.ssrn.com/abstract=3737689.