
 ?Mathematical formulae have been encoded as MathML and are displayed in this HTML version using MathJax in order to improve their display. Uncheck the box to turn MathJax off. This feature requires Javascript. Click on a formula to zoom.
Abstract
As an important part of e-commerce, online reviews play a significant role in consumers’ purchase decisions. This study investigated the dynamic effects of electronic word of mouth (eWOM) and the number of people wishing to watch a movie on movie sales and supplies in the Chinese movie market. Using a dynamic simultaneous equation system and data of 76 films, this study analyzed the interrelationships between eWOM and movie sales and supplies. Our findings showed that both the volume and valence of eWOM affected movie sales and supplies significantly. The number of people who wanted to watch a movie had an opposite effect on movie sales and supply; eWOM volume had a positive impact on movie sales and supplies; and eWOM valence had a negative impact on movie sales and a positive impact on movie supplies. The number of people who wish to watch a movie was another important variable for movie sales and supplies, and it had a negative impact on the daily movie sales but a positive impact on the daily movie supplies. This study provided a detailed explanation of these results and thus contributed to improving the efficiency of movie suppliers' utilization of online reviews.
1. Introduction
The advancement of technology has improved the level of connectivity between enterprises and customers. As a product of technological advancement, social platforms have become an important means of helping customers communicate. Word of mouth (WOM) is the interpersonal communication between consumers relating to products and services, and it is one of the most influential sources of market information for consumers' purchasing decisions (Arndt, Citation1967).
Electronic word of mouth (eWOM) is a way of communication on the internet, which can be diffused across online platforms, such as forums, blogs, reviews sites, and social networks. It is an important source of product information that influences consumers’ behavior (Goldsmith, Citation2006). Consumers often share their experiences regarding products and services with eWOM. A previous study found that eWOM is one of the most influential resources of information transmission (Banerjee et al., Citation2017). Potential consumers often rely on the information provided by others to make their decisions (Chen & Xie, Citation2008; Chevalier & Mayzlin, Citation2006; Jing & Chao, Citation2021). A survey showed that 83% of consumers agree that eWOM affects their final decisions (Channel Advisor, Citation2011). eWOM communication was suggested to be a more efficient communication channel with less investments than traditional advertising (Milaković et al., Citation2020) and has been recognized as a process of personal influence that affects consumers’ attitudes, decision-making, and purchases (Ansary & Hashim, Citation2018; Lee & Choeh, Citation2018; Bucko & Kakalejčík, Citation2018). Kim et al. (Citation2019) believe that eWOM volume have a very important impact on DVD sales. Kim et al. (Citation2019) believes that the convenience of the platform is the key to drive eWOM's behavior, and the eWOM valence is more conducive to product sales. With the demand for cultural consumption and the number of movie theaters and screens, China's film industry has registered rapid growth. Films, however, are a high-investment and high-risk industry. During the COVID-19 period in particular, understanding consumer preferences and adjusting the number of film screenings to obtain better returns have had a substantial impact on the film industry. In this context, businesses should understand how eWOM affects consumers' decision-making processes that in turn play a very important role in the company's product marketing, supply chain, and competitive advantages (Akar & Dalgic, Citation2018; Ahmed et al., Citation2017; Kou et al., Citation2021).
Although the relationship between eWOM and product sales have been investigated intensively, and they are very useful in marketing strategy, there still exist shortcomings that must be addressed because of the following reasons:
First, prior studies usually focus on the influence of eWOM volume on box office sales (Duan et al., Citation2008; Liu, Citation2006). Recognizing that eWOM valence, which refers to the daily user average rating, may have a large impact on the movie market, the dynamic effect of user ratings should be investigated on movie sales and supplies. This plays an important role in predicting the economic performance of the movie at the box office.
Secondly, the prior research on the eWOM effect focuses only on the end consumers (i.e., the viewers), which overlooks the exhibitors’ decisions regarding whether or not to keep a movie on screen. eWOM is generated by consumers and significantly affects the potential viewing behavior of consumers (Chen et al., Citation2020). While making their programming choices, exhibitors may refer to the feedback of online reviews delivered by consumers.
Finally, major Chinese movie distributors’ websites provide a ‘wishing-to-watch’ button (e.g., www.maoyan.com) for each movie during its prerelease period. Customers can show their prior interest before a movie is released. The information collected from the wishing to watch feature can be used to predict the movie’s eventual popularity and future sales. Although Ding et al. (Citation2017) investigated the effect of the ‘Like’ button in Facebook on movie sales, no paper has studied the effect of customers’ prior preferences regarding a movie on movie sales and supplies.
In order to overcome previous shortcomings, this study aims to measure the impact of eWOM on product sales and supplies and explore the impact of eWOM on consumer and supplier decision-making processes. Specifically, we proposed six hypotheses to describe the effects of eWOM volume, valence, and audience’s wishes to watch a movie on movie sales and supplies. Then, we analyzed the dynamic effect of eWOM on movie sales and supplies, which is more helpful for analyzing the benefits of eWOM on the movie market and optimizing the allocation of resources. This study collected data from a Chinese movie website and developed two models to test the six hypotheses. The results showed that eWOM volume, valence, and the number of individuals wishing to watch a movie had significant influence on movie sales and supplies.
The possible contribution of this paper is to reveal the impact of eWOM lag on consumer purchase decisions, and discover the dynamic impact of eWOM on product supply. The conclusion is an important and feasible basis for predicting the impact of eWOM on product sales, and then, it improves the efficiency of the information economics.
The remainder of this paper is organized as follows. The next section describes the conceptual framework and hypotheses. Section 3 details the data collection, model specification, and results analysis. Section 4 summarizes the conclusions, and the last section offers future research directions.
2. Theoretical background and hypotheses
2.1. eWOM impact on product sales
2.1.1. The effect of eWOM volume
The effect of eWOM can be considered in terms of the number of online comments, which represents the eWOM volume. The volume of eWOM reflects the popularity of the product and can provide plentiful feedback and information about the product or service. Consumers are influenced by popularity, which provides valuable information regarding a product or service (Chevalier & Mayzlin, Citation2006; Phan & Pilík, Citation2018). Thus, consumers find that popular eWOM is difficult to ignore. At the same time, the popularity of information also reflects consumer interaction, which is closely linked to persuasiveness (Liu, Citation2006). In fact, the volume of eWOM is an important influence cue for consumers with respect to the reliability of eWOM (Duan et al., Citation2008). Prior studies have found that the volume of eWOM can increase consumer awareness about products and generate greater sales (Godes & Mayzlin, Citation2004; Liu, Citation2006). Moreover, the volume is an external, high-scope cue that can increase the persuasiveness of eWOM because an opinion expressed by more people potentially indicates a higher likelihood of the correctness of the opinion (Salganik & Watts, Citation2008). Empirical studies support these arguments; it has been found that the volume of eWOM has a positive relationship with product sales (You et al., Citation2015; Babić et al., Citation2016; Lee & Choeh, Citation2018). Therefore, eWOM volume is an important factor affecting consumer decision-making and business outcomes.
2.1.2. The effect of eWOM valence
Valence refers to ratings, positive reviews, and negative reviews. It typically is a reflection of consumers' attitudes toward products (Karniouchina, Citation2011; Yoon, Citation2013). From the perspective of marketers, eWOM valence is the simplest form of a positive or negative score card. When consumers appreciate a product, a positive review may be generated. Conversely, when consumers are dissatisfied, a negative review may be produced (Kim et al., Citation2019). Prior studies have found that positive reviews typically enhance consumer expectations, and negative reviews may have an unfavorable impact on product sales (Minnema et al., Citation2016; Floyd et al., Citation2014). The impact of negative reviews is more strong than positive information. It has been proposed that it is difficult to resist negative information (Baumeister et al., Citation2001).
An analysis of the ratings of books after purchase on Amazon found that the valence of eWOM directly affects the sales of the books (Chevalier & Mayzlin, Citation2006). Similarly, in the film industry, negative reviews directly reduce box office performance (Basuroy et al., Citation2006). Prior studies, however, also provided results that indicated that valence had no significant association with product sales. These studies found that most of the explanatory power of eWOM came from volume and not valence (Liu, Citation2006; Duan et al., Citation2008). Generally, the existing studies have suggested that management has a certain degree of control over the direction of post-purchase eWOM (Kim et al., Citation2019; Phan et al., Citation2020). Therefore, the present study focused on the effects of eWOM valence on box office revenue. The literature is summarized in .
Table 1. Prior Studies on the Effect of eWOM.
The extant literature consistently found that eWOM had a strongly influence on box office revenue in a given week (Duan et al., Citation2008; Liu, Citation2006; Elberse & Eliashberg, Citation2003). By integrating the literature findings in our study of the determinants of motion picture performance, we developed a conceptual framework that described the interrelationships among eWOM, movie sales, and movie supplies. The conceptual framework is shown in .
Figure 1. The effect of eWOM on movie sales and movie screenings in multi-lag terms.
Source: Author's computation.
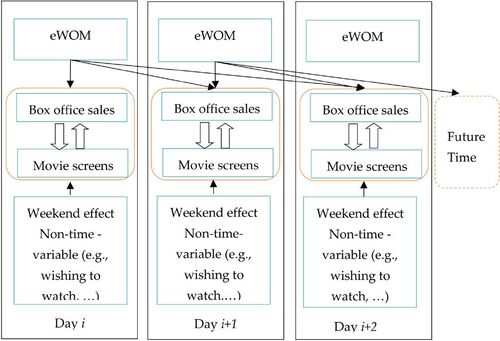
As shown in , eWOM can influence current and future box office sales and movie screenings. To analyze the dynamic effects of eWOM volume, valence, and the number of individuals wishing to watch a movie on movie sales and supplies, we developed two sets of hypotheses for each of the three components. This study re-evaluated the interrelationship of eWOM volume and box office sales by measuring both concurrent and lagged effects. We made a distinction between the opening week (the first three days in the first release week) and the subsequent days. From the managerial perspective, the opening week is considered to be different from the other days in the release period (Dellarocas et al., Citation2007; Elberse & Eliashberg, Citation2003).
2.2. Hypotheses
During the sequential release of a film, eWOM continues to be produced by consumers and spreads to the film market. According to the behavioral learning theory, consumers actively use eWOM to enhance their ability to evaluate products. Therefore, eWOM will affect consumers' final decision-making (Moon et al., Citation2010). In the movie market, eWOM affects movie sales in two ways. One is by increasing consumers’ awareness of the products, and the other is by influencing consumers’ evaluation of the product and the final purchase decision (Liu, Citation2006). As positive eWOM spreads, the box office sales of the movie rise (Dellarocas et al., Citation2007). Prior studies have proved that WOM awareness was the primary effect in the positive feedback mechanism. These studies investigated the dynamic relationship between WOM volume and box office sales (Duan et al., Citation2008). Liu (Citation2006) found that WOM volume affected box office sales significantly. Increasing the WOM volume could lead to higher box office sales (Duan et al., Citation2008). eWOM is often stored by websites; thus, prior reviews can influence potential consumers. Therefore, the influence of eWOM could prevail beyond the concurrent term (Duan et al., Citation2008). Our objective was to re-evaluate the dynamic effect of eWOM on box office sales. We proposed the first hypothesis as follows.:
H1: The influence of eWOM volume on daily movie sales is positive during the theater release days; however, this influence diminishes quickly.
As a retailer of movies, exhibitors’ main task is to allocate their screenings across selected movies. Specifically, the exhibitor must first decide on the number of screenings to allocate to a movie after it has been selected and then decide on withdrawing the movie from a screen after release (Legoux et al., Citation2016). Some studies have found that exhibitors usually allocate screens based on a movie’s expected revenue (Elberse & Eliashberg, Citation2003; De & Walls, Citation1996). In general, the demand for a movie first falls and then collapses after some days. Therefore, the number of screenings of a movie abruptly decreases after some days. There are exceptions to this pattern, however—for example, if WOM for a movie is strong after its release (Legoux et al., Citation2016). A prior study found that movies’ eWOM affected the expectations of revenue, which influenced screen allocation (Karniouchina, Citation2011). Popular movies attract a large volume of online review communications, which increase the number of screenings allocated to them. Exhibitors use eWOM as an indicator of future movie performance to support their allocation of screens (Reinstein & Snyder, Citation2005). Therefore, exhibitors adapt movie screening supplies according to consumer demand (Elberse & Eliashberg, Citation2003). The second hypothesis is as follows:
H2: The influence of eWOM volume on daily movie supplies is positive during the theater release days; however, this influence diminishes quickly.
Unlike traditional retailers, when reviewing a product, users often provide summaries of overall ratings to potential buyers even before user reviews (Kim et al., Citation2019; Wang et al., Citation2015). The user ratings often contain information about a product’s ‘average quality’ (Brown et al., Citation2012; Chintagunta et al., Citation2010). This information is useful for potential consumers, especially when consumers are not yet committed to any products while searching information online (Chang & Wang, Citation2019; Wang et al., Citation2015). Overall ratings often indicate how much users like the focal products in general. By using ratings, users indicate their different degrees of satisfaction regarding how their idiosyncratic preferences and the focal product match (Sun, Citation2012). In that case, there is a high possibility that potential buyers often use the rating to make a purchase decision (Yoon et al., Citation2019; Minnema et al., Citation2016). This behavior leads to an increase in product sales, and the influence of eWOM could thus go beyond the concurrent term (Duan et al., Citation2008). In the film industry, when movies receive high ratings from viewers, positive eWOM is generated that can increase box office revenues (Moon et al., Citation2010). Therefore, the third hypothesis is as follows:
H3: The influence of eWOM valence on daily movie sales is positive during the theater release days; however, this influence diminishes quickly.
In fact, exhibitors are usually aware that the success of many films can be attributed to the audience; thus, their better strategy is to support a positive WOM information cascade effect. Specifically, movies that are still being screened may provide useful information concerning the dynamics of WOM and the decisions of exhibitors (McKenzie, Citation2009). If a movie is rated as extremely good or extremely bad, exhibitors increase their monitoring of the movie performance to make their allocation decision (Legoux et al., Citation2016). When a film has strong WOM, exhibitors have a higher incentive to prolong its run (McKenzie, Citation2009). When films receive excellent reviews, their lower showing at the box office may be forgiven by the exhibitors. This measure will act on the box office in subsequent time and continue the life cycle of the movie. This shows that excellent reviews play an important role in persuading exhibitors to enhance the screening of films (Legoux et al., Citation2016). Moreover, the excellent reviews will have a positive impact on movie survival in theaters. This can significantly increase the probability that the exhibitor will assign the movie to the high-quality category (Hennig-Thurau et al., Citation2012). A prior study found that the more a movie receives positive eWOM communication, the more it is screened (Elberse & Eliashberg, Citation2003). Therefore, the fourth hypothesis is as follows:
H4: The influence of eWOM valence on daily movie supplies is positive during the theater release days; however, this influence diminishes quickly.
Nowadays, consumers can get a lot of information about upcoming movies. A wishing-to-watch button is embedded in Chinese movie distributors’ websites, where people could indicate their preference and thus help spread WOM about the movie. Before the prerelease date, wishing to watch is generally based on consumers’ own preference, which is largely influenced by advertisements and marketing campaigns (Lie, Citation2015). The clicks of wishing to watch create an important social impact with an unlimited audience coverage. A large number of consumers who wish to watch demonstrates that many people are interested in the movie. These consumers may have been motivated by the marketing promotions (Wu, Citation2019). Like the wishing to watch, the Like button of Facebook is widely embedded in movie-related promotions before movie releases, which also leads to a strong social impact. The study results showed that prerelease Facebook Likes had a significantly positive impact on box office performance; a 1% increase in the number of Likes was associated with an increase in the opening week box office by about 0.2% (Ding et al., Citation2017). Therefore, we hypothesized the following:
H5: The influence of the number of people who wish to watch a movie on daily movie sales is positive during the theater release days.
A prior study found that the Facebook Like button can help industry practitioners gain useful insights (Ding et al., Citation2017). Exhibitors often allocate screens based on expectations of the box office revenue (Karniouchina, Citation2011; Dellarocas et al., Citation2007). The number of people who wish to watch represents the popularity and attention of the movie. If the number of people who wish to watch a movie reaches a certain scale, even if later marketing promotions are reduced, it will still attract a large number of users to watch the movie. The effective popularity can determine the subsequent box office and subsequent eWOM may drive more users to watch movies later (Wu, Citation2019). Therefore, the number of consumers who are interested in a movie before its theater release date can be an objective indicator of the popularity of a movie and can be used as an important criterion during screen allocation. The sixth hypothesis is as follows:
H6: The influence of the number of people who wish to watch a movie on daily movie supplies is positive during the theater release days.
3. Experiment
3.1. Data
We extracted data for our study from a popular and publicly available source: Maoyan Entertainment (http://piaofang.maoyan.com). It is a platform for online tickets and a social network for users to post their reviews about movies. Maoyan is a leader among movie portals, and its box office revenue accounts for more than 90% of Chinese movie revenue. In January 2015, Maoyan had nearly 200 million users, and its market share was over 60%. We collected the following details about each movie from Maoyan: movie name, average review grade from opening, number of cumulative ratings from opening, daily revenue, and daily screens. The movie sales of our sample data accounted for approximately 98% of the total box office during their released periods (Wang et al., Citation2015; Gopinath et al., Citation2013; Liu, Citation2006).
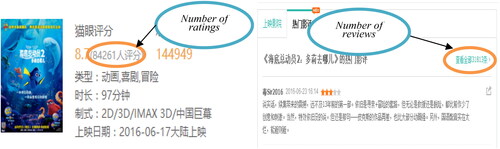
The eWOM valence of a movie is its daily average rating. We calculated eWOM volume by adding the number of daily numbers of user ratings. Previous studies collected the eWOM volume data from the number of movie reviews (Wang et al., Citation2015; Duan et al., Citation2008). A common phenomenon in the Chinese movie market, however, is that consumers are more willing to rate a movie than post a review. uses ‘Finding Dory’ as an example to illustrate this situation. The number of reviews was collected six days after the number of ratings to allow audience to write reviews if they wanted. Each user can rate and review each movie only once. The left side of shows that there were 84,261 ratings from people who had watched the movie, and the right side shows that the number of reviews for the same movie at the same website was 31,813. The difference between the number of reviews and the number of ratings was significant. Although ratings do not provide detailed information about the audience’s opinions about a movie, they are a more accurate indicator of a movie’s popularity than the number of reviews and reflect the general attitudes of audiences.
Figure 2. Difference between the Number of Rating and Reviews.
Source: Maoyan Entertainment (http://piaofang.maoyan.com).
We selected 107 movies that covered the thriller, action, animation, comedy, and romance genres. The movies were released between March 2016 and August 2016 at national theaters. As the objective of this study was to analyze the effect of movie user reviews on movie sales and supplies, we excluded movies without user reviews and reduced the final data set to 76 movies. The key variables for empirical analysis are described in . The final data set contained 1,596 daily box offices results. summarizes the statistics of the key variables. gives the correlation matrix of the data.
Table 2. Description and Measurement of Key Variables.
Table 3. Summary statistics of the data.
Table 4. Key Variables Correlation Matrix of Data.
3.2. Model specification
On the basis of the objectives and data collected, we formulated the prediction models with the following considerations:
First, we constructed two equations to analyze the effects of eWOM on audiences and exhibitors: one equation had daily box office revenue as the dependent variable, and the other had daily screenings as the dependent variable. Both had eWOM as the main independent variable.
Second, recognizing that the different interactions between consumers’ viewing behavior and eWOM can go beyond the concurrent term (Duan et al., Citation2008; Elberse & Eliashberg, Citation2003), we developed a system of dynamic equations to express the effect of eWOM.
Third, the opening week and subsequent days were treated differently in the model. The opening week box office revenue generally is based on the movie’s quality (Morgan, 2009; Elberse & Eliashberg, Citation2003). Audiences go to the theater with their expectations about the movie and review the movie afterward. Reviews from previous viewers have an important impact on the viewing decisions of potential audiences (Elberse & Eliashberg, Citation2003). Exhibitors often allocate screenings based on their experience regarding the movie quality in the opening week and adjust screenings in the subsequent days (Elberse & Eliashberg, Citation2003). We used a regression model to analyze the effect of eWOM following Duan et al. (Citation2008).
The two system equations are as follows:
Revenue equations
Opening weekdays:
(1)
(1)
Subsequent days:
(2)
(2)
Screen equations
Opening weekdays:
(3)
(3)
Subsequent days:
(4)
(4)
EquationEquations (1)(1)
(1) and Equation(2)
(2)
(2) reflect the daily revenue, and EquationEquations (3)
(3)
(3) and Equation(4)
(4)
(4) reflect the daily screenings, where i = 1,2 … N represents the movies; (Daily Revenue
denotes the daily box office revenue of movie i at day t; (Daily Rating Number
is the number of people’s viewer ratings for movie i at day t
is the multi-lag terms of (Daily Rating Number
(Duan et al., Citation2008);
is the average rating of movie i at day t;
is the multi-lag term of
is the number of allocated movie screens i at day t; and
is number of people who want to see the movie before the release date. EquationEquations (3)
(3)
(3) and Equation(4)
(4)
(4) reflect the effects of (Daily Rating Number
and
on the multi-lag term of daily screens. The data collected showed that 98% of the movies opened on Friday, Saturday, or Sunday. Therefore, the effect of the weekend was not considered in the opening week. For the days after the opening, we constructed a dummy variable
denote some fixed characteristics associated with each movie, namely, the genre, budget, and other unobserved heterogeneity; thus, we were able to control for unobserved differences across movies (see Duan et al., Citation2008).
3.3. Estimation results
Previous studies have used the three-stage least-square (3SLS) procedure to estimate the system of equations (Duan et al., Citation2008; Elberse & Eliashberg, Citation2003). This study also utilized 3SLS to avoid endogeneity in the ordinary least squares regression process. and illustrate the 3SLS results, and and list the specific goodness of fit.
Figure 3. Fitting of Daily Revenues. (a) Opening week; (b) Subsequent days.
Source: Author's computation.
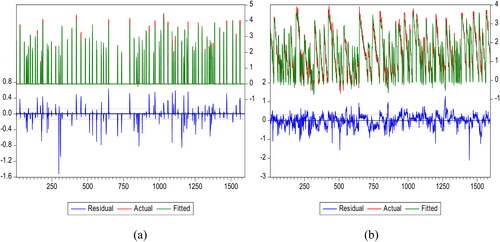
Figure 4. Fitting of Daily Screens. (a) Opening week; (b) Subsequent days.
Source: Author's computation.
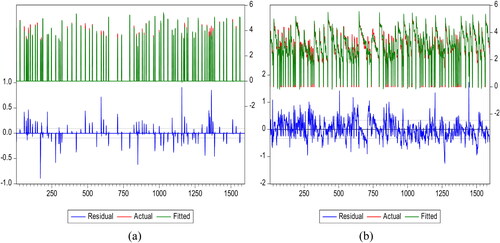
Table 5. SLS Results (Log (Daily Revenues)it as the Dependent Variable).
Table 6. SLS Results (Log (Daily Screens)it as the Dependent Variable).
The results showed that eWOM volume, eWOM valence, and the number of people wishing to watch a movie had a strong relationship with the movie’s revenue. As indicated in , the Daily Rating Numberit was strongly correlated to the Daily Revenue it. According to , in the opening week, the coefficient between Daily Rating Number and Daily revenue was 0.967, which was significant at the 0.01 significance level. The lagged terms of Daily Rating Numberit-1 and Daily Rating Numberit-2 were 0.074 and −0.014, which also were significant at the 0.01 confidence level. Therefore, eWOM volume had a positive influence on movie sales, but the influence diminished quickly in the opening week. This result was consistent with the findings of Duan et al. (Citation2008).
In subsequent days, the coefficients of Daily Rating Numberit, Daily Rating numberit-1, and Daily Rating Numberit-2 were 0.740, 0.141, and 0.086, respectively, and were significant at the 0.01 confidence level (see ). The coefficients suggested that with every 10% increase of Daily Rating Number, the Daily Revenue would increase by 9.67% in the same day and 0.74% in the next day during the opening week. In subsequent days, box office revenue increased by 7.40% on the same day, by 1.41% the next day, and by 0.86% the third day. These results were consistent with previous studies using data from the U.S. movie market (Duan et al., Citation2008; Liu, Citation2006).
Whereas previous studies have found that eWOM valence had a positive impact (Chen et al., Citation2011; Chintagunta et al., Citation2010; Moon et al., Citation2010; Holbrook & Addis, Citation2007) or no impact on product sales (Duan et al., Citation2008; Liu, Citation2006), this study found that Daily Average Ratingit had a negative impact on the daily movie box office sales in all released days ().
In , the coefficients of Daily Average Ratingit, Daily Average Ratingit-1, and Daily Average Ratingit-2 were −0.990, −0.178, and 0.025, respectively, in the opening week, and the coefficients of Daily Average Ratingit and Daily Average Ratingit-1 were −1.036 and −0.495, respectively, in the subsequent days, and were significant at the 0.01 confidence level. The coefficient of Daily Average Ratingit-2 (−0.201), however, was not significant and much smaller than the coefficient of Daily Average Ratingit (−1.036), indicating that it may have a negligible impact (see Duan et al., Citation2008). The coefficient between the concurrent term and the first lag of eWOM valence was 0.812 (this result came from the difference between the concurrent term and first lag coefficients) in the opening week and 0.541 in subsequent days. The results showed that eWOM valence had a negative influence on box office sales, and the influence diminished quickly. Its coefficient suggested that with every 10% increase in the Daily Average Rating, the box office revenue would decrease by 9.9% the same day, by 1.78% the next day, and by 0.25% the third day during the opening week. In the subsequent days, the box office revenue decreased by 10.36% on the same day and by 4.95% the next day. Therefore, this result did not support H3.
The possible explanation of the negative effect of eWOM valence on revenue was not related to the helpfulness of eWOM. In other words, this meant that potential users would calibrate their comments between their own taste and the reviewer’s tastes and make an independent judgment about the true quality of the film (Lee & Choeh, Citation2018). China has several movie evaluation sites, including Maoyan, Douban, and Weipiao. When potential consumers want to watch a movie, they will search many movie evaluation sites. There are, however, different user ratings about the same movie in the different sites. This difference will further increase the consumers’ reliance on their own judgment about the quality of the film (Wang et al., Citation2015). When the score cannot fully match the consumer's judgment on the quality of the product, the consumer will reduce the expected value of the product score through self-judgment, thereby reducing the risk of the product after purchase. Therefore, the eWOM valence was negatively associated to box office sales.
We also found that the wishing-to-watch variable had a negative impact on the daily movie box office revenue in all released days. The possible explanation is that the number of people wishing to watch a movie could foreshadow a serious loss after a movie is released. Statistically, such people constitute the cumulative number of people of a movie’s audience before the movie’s release. Potential consumers, however, may forget or lose interest in the movie after it is released (Ding et al., Citation2017). This situation leads to a reduction in the number of actual viewers, which leads to a sizeable loss. Thus, the wishing-to-watch variable had a negative impact on the daily movie box office sales. This result did not support H5.
shows the estimation results for EquationEquations (3)(3)
(3) and Equation(4)
(4)
(4) with respect to H2, H4, and H6. The Daily Rating Numberit had a significant impact on the Daily Screens it in the opening week, but it was not significant on subsequent days. In the opening week, the coefficient of Daily Rating Numberit was 0.263, which was significant at the 0.01 confidence level. The lagged terms of Daily Rating numberit-1 and Daily Rating numberit-2 were −0.043 and 0.013, which were significant at the 0.01 confidence level. The substitution effect of eWOM volume between t, t-1, and t − 2 on the supply of screenings was obvious (Duan et al., Citation2008). In the subsequent days, the supply of Daily Screenings it was not affected by Daily Rating Numberit. The results showed that Daily Rating Numberit was an important index for the supply of screenings in concurrent terms in the opening week, which partly supported H2. A possible explanation is that the number of reviews reflected the popularity of the movie. Therefore, the more people who follow a movie, the more screenings a movie receives.
Another interesting finding is that that Daily Average Ratingit had a positive impact on the daily movie supplies in all released days. To the best of our knowledge, no study has examined the effect of the lagged terms of eWOM on product supplies. Some previous studies have discussed the effect of eWOM volume and valence on product sales, but there has been little discussion from the perspective of product supplies (Chintagunta et al., Citation2010; Duan et al., Citation2008; Liu, Citation2006; Basuroy et al., Citation2006; Elberse & Eliashberg, Citation2003). The coefficients of Daily Average Ratingit, Daily Average Ratingit-1, and Daily Average Ratingit-2, were 1.249, 0.170, and −0.058 respectively, in the opening week. The coefficients of Daily Average Ratingit and Daily Average Ratingit-1 were 1.121 and 0.460 in subsequent days and were significant at the 0.01 confidence level. In the subsequent days, however, the coefficient of Daily Average Ratingit-2 was not significant. As the coefficient of Daily Rating Numberit-2 was negative, the magnitude effect on the supply of screenings may be negligible (Duan et al., Citation2008). The coefficients between the concurrent term and the first lag of eWOM valence were 1.079 in the opening week and then 0.661 in the subsequent days. The result showed that eWOM valence had a positive effect on the daily supply of screenings, and the influence diminished quickly. Concerning the eWOM valence in the opening week, the coefficient suggested that every 10% increase in the daily rating would increase the movie screens by 12.49% in the same day and 1.7% in the next day. In the subsequent days, the movie screenings increased by 11.21% on the same day and 4.6% in the next day. Therefore, the results strongly supported H4. The findings we reported in this research extend to previous research. In summary, eWOM increased the popularity of movies, and exhibitors adjusted the number of movie screens based on the expected effect of the already released eWOM, thereby increasing the expected revenue (Kim et al., Citation2019).
We also found that wishing to watch was another important index for the supply of daily screenings in all released days. Given a large number of people who want to see a movie, the supply of movie screenings would be greater than it would be for other movies (i.e., movies with a smaller number of wishing to watch people). Thus, the number of people wishing to watch a movie had a positive impact on the supply of daily movie screenings. In other words, the number of people wishing to watch a movie had a positive impact on the daily movie supplies in all released days. This result strongly supported H6. A possible explanation is that the number of people who wish to watch reflected the amount of attention consumers gave to the movie, and these consumers were likely to be converted into viewers. To maximize revenue, the exhibitor would estimate the expected revenue based on the number of people who wish to watch and, accordingly, would arrange for the appropriate number of screens.
Overall, we found that the evidence supported hypotheses H1, H4, and H6 and partly supported H2. It did not support, however, H3 and H5. eWOM volume and valence had an important impact on movie sales and supplies. The number of people who wish to watch a movie also had a signaling effect on the movie’s success, which was different from prior studies (Ding et al., Citation2017; Duan et al., Citation2008; Elberse & Eliashberg, Citation2003).
4. Conclusions and discussion
4.1. Conclusions
This study used a dynamic equation system to examine the interrelationship between the eWOM volume, valence, prior interest, and movie sales and supplies. Our model provided a novel way to analyze the relationship between eWOM and product sales and supplies. Furthermore, considering the effect of eWOM on the behavior of consumers and exhibitors, our findings had strong support. The main findings can be summarized as follows:
Given the dynamic system, the box office sales were highly interrelated with the eWOM volume. This conclusion was consistent with previous studies (Duan et al., Citation2008; Elberse & Eliashberg, Citation2003). eWOM volume had a positive impact on the movie sales in all release days. However, the dynamic effect on the supply of screenings supply was significant in concurrent terms only in the opening week and not in all release days.eWOM valence had a negative impact on the box office revenue and a positive impact on movie supplies. This finding contradicted previous studies (Yoon et al., Citation2019; Elberse & Eliashberg, Citation2003). This showed that when consumers cannot judge the quality of a product by scoring, they lowered their quality expectations through independent judgment, thereby reducing the risk of purchasing decisions. Our study extended the research of eWOM valence’s impact on product sales and further highlighted the important role of eWOM valence with respect to product sales and product supplies.
The number of people wishing to watch a movie is important for estimating movie sales and supplies. People wishing to watch a movie directly influences box office revenue and screenings. Such influence is negative on the daily box office revenue but positive on the daily screenings supply.
4.2. Discussion and implications
By building on prior studies on the economics of information, this paper provided a conceptual framework to understand the informational value of eWOM in China’s motion picture industry. In particular, our work extended the explanatory value of eWOM on product sales. Furthermore, we demonstrated an asymmetric effect of eWOM volume and valence, namely, that eWOM volume had a positive effect on product sales and eWOM valence had a negative effect on product sales.
The research results indicated that marketers should pay attention to eWOM. In China, nearly half of the box office revenue goes to theaters. Predicting a movie’s popularity and allocating appropriate number of screenings to movies are vital for theaters. The findings of this study provide certain management insights into the Chinese movie market.
First, theaters can adjust the supply of screenings based on the first-day eWOM volume because the eWOM volume positively affects box office revenue.
Second, theaters should refine the film's rating criteria to reduce uncertainties among potential consumers. If the user rating highly matches with the needs of potential buyers’ needs, they will make a viewing decision more quickly. Because eWOM valence has a positive impact on the supply of screenings, theaters should consider the dynamic influence of daily user ratings and take timely measures to adjust the supply of screenings.
Third, the number of people wishing to watch a movie has a significant negative impact on daily movie sales and a positive impact on the daily supply of screenings. The result showed that the number of people wishing to watch a movie would decrease after the release date. By means of evaluation websites, theaters and movie production companies can use advertisements to sustain the interest of potential consumers until the movie release dates.
5. Limitations and future research
There are some opportunities to extend the current research. First, this study used the rating number rather than the number of posts. Future research can use both types of data to analyze their different effects on movie sales. Second, we discussed the eWOM effect on the movie during the released days, but there are also many movie point mappings before their release. How does eWOM affect the point mapping? Are there any differences in the eWOM effects between point mapping and released days? Third, this study focused on the impact of eWOM. However, there are many other factors, such as the lead stars of the film and the story of the film, among others, which may affect the sales and supply of movies. These questions warrant further research.
Acknowledgement
The authors thank the editor and anonymous referees for their valuable comments and insightful recommendations.
Additional information
Funding
References
- Ahmed, R. R., Vveinhardt, J., & Streimikiene, D. (2017). Interactive digital media and impact of customer attitude and technology on brand awareness: Evidence from the South Asian countries. Journal of Business Economics and Management, 18(6), 1115–1134. https://doi.org/10.3846/16111699.2017.1400460
- Akar, E., & Dalgic, T. (2018). Understanding online consumers’ purchase intentions: A contribution from social network theory. Behaviour & Information Technology, 37(5), 473–487. https://doi.org/10.1080/0144929X.2018.1456563
- Ansary, A., & Hashim, N. N. (2018). Brand image and equity: The mediating role of brand equity drivers and moderating effects of product type and word of mouth. Review of Managerial Science, 12(4), 969–1002. https://doi.org/10.1007/s11846-017-0235-2
- Arndt, J. (1967). Role of product-related conversations in the diffusion of a new product. Journal of Marketing Research, 4(3), 291–295. https://doi.org/10.1177/002224376700400308
- Babić, R. A., Sotgiu, F., & Valck, D. K., & Bijmolt, T. (2016). The effect of electronic word of mouth on sales: A meta-analytic review of platform, product, and metric factors. Journal of Marketing Research, 53(3), 297–318. https://doi.org/10.1509/jmr.14.0380
- Banerjee, S., Bhattacharyya, S., & Bose, I. (2017). Whose online reviews to trust? Understanding reviewer trustworthiness and its impact on business. Decision Support Systems, 96, 17–26. https://doi.org/10.1016/j.dss.2017.01.006
- Basuroy, S., Desai, K. K., & Talukdar, D. (2006). An empirical investigation of signaling in the motion picture industry. Journal of Marketing Research, 43(2), 287–295. https://doi.org/10.1509/jmkr.43.2.287
- Baumeister, F., Bratslavsky, E., Finkenauer, C., & Kathleen, D. (2001). Bad is Stronger than Good. Review of General Psychology, 5(4), 323–370. https://doi.org/10.1037/1089-2680.5.4.323
- Brown, A. L., Camerer, C. F., & Lovallo, D. (2012). To review or not to review? Limited strategic thinking at the movie box office. American Economic Journal: Microeconomics, 4(2), 1–26. https://doi.org/10.1257/mic.4.2.1
- Bucko, J., & Kakalejčík, L. (2018). Website usability and user experience during shopping online from abroad. Economics and Management, 21(3), 205–219. https://doi.org/10.15240/tul/001/2018-3-013
- Chang, J. H., & Wang, S. H. (2019). Different levels of destination expectation: The effects of online advertising and electronic word-of-mouth. Telematics and Informatics, 36, 27–38. https://doi.org/10.1016/j.tele.2018.11.004
- Channel Advisor. (2011). Consumer survey: Global consumer shopping habits. Channel Advisor.
- Chen, J., Kou, G., Peng, Y., Chao, X., F Xiao, & Alsaadi, F. E. (2020). Effect of marketing messages and consumer engagement on economic performance: evidence from weibo. Internet Research, 30(5), 1565–1581. https://doi.org/10.1108/INTR-07-2019-0296
- Chen, Y., & Xie, J. (2008). Online consumer review: Word-of-mouth as a new element of marketing communication mix. Management Science, 54(3), 477–491. https://doi.org/10.1287/mnsc.1070.0810
- Chen, Y., Wang, Q., & Xie, J. (2011). Online social interactions: A natural experiment on word of mouth versus observational learning. Journal of Marketing Research, 48(2), 238–254. https://doi.org/10.1509/jmkr.48.2.238
- Chevalier, J. A., & Mayzlin, D. (2006). The effect of word of mouth on sales: Online book reviews. Journal of Marketing Research, 43(3), 345–354. https://doi.org/10.1509/jmkr.43.3.345
- Chintagunta, P. K., Gopinath, S., & Venkataraman, S. (2010). The effects of online user reviews on movie box office performance: Accounting for sequential rollout and aggregation across local markets. Marketing Science, 29(5), 944–957. https://doi.org/10.1287/mksc.1100.0572
- De, V. A., & Walls, W. D. (1996). Bose-Einstein dynamics and adaptive contracting in the motion picture industry. The Economic Journal, 106 (439), 1493–1514. https://doi.org/10.2307/2235197
- Dellarocas, C., Zhang, X. M., & Awad, N. F. (2007). Exploring the value of online product reviews in forecasting sales: The case of motion pictures. Journal of Interactive Marketing, 21(4), 23–45. https://doi.org/10.1002/dir.20087
- Ding, C., Cheng, H. K., & Duan, Y., & Jin, Y. (2017). The power of the “like” button: The impact of social media on box office. Decision Support Systems, 94, 77–84. https://doi.org/10.1016/j.dss.2016.11.002
- Duan, W., Gu, B., & Whinston, A. B. (2008). The dynamics of online word-of-mouth and product sales—An empirical investigation of the movie industry. Journal of Retailing, 84(2), 233–242. https://doi.org/10.1016/j.jretai.2008.04.005
- Elberse, A., & Eliashberg, J. (2003). Demand and supply dynamics for sequentially released products in international markets: The case of motion pictures. Marketing Science, 22(3), 329–354. https://doi.org/10.1287/mksc.22.3.329.17740
- Floyd, K., Freling, R., Alhoqail, S., Cho, H. Y., & Freling, T. (2014). How online product reviews affect retail sales: A meta-analysis. Journal of Retailing, 90(2), 217–232. https://doi.org/10.1016/j.jretai.2014.04.004
- Godes, D., & Mayzlin, D. (2004). Using online conversations to study word-of-mouth communication. Marketing Science, 23(4), 545–560. https://doi.org/10.1287/mksc.1040.0071
- Goldsmith, R. E. (2006). Encyclopedia of E-Commerce, E-Government and mobile commerce. Idea Group Publishing.
- Gopinath, S., Chintagunta, P. K., & Venkataraman, S. (2013). Blogs, advertising, and local-market movie box office performance. Management Science, 59(12), 2635–2654. https://doi.org/10.1287/mnsc.2013.1732
- Hennig-Thurau, T., Marchand, A., & Hiller, B. (2012). The relationship between reviewer judgments and motion picture success: Re-analysis and extension. Journal of Cultural Economics, 36(3), 249–283. https://doi.org/10.1007/s10824-012-9172-8
- Holbrook, M. B., & Addis, M. (2007). Taste versus the market: An extension of research on the consumption of popular culture. Journal of Consumer Research, 34(3), 415–424. https://doi.org/10.1086/518529
- Hossein, N., & Miller, D. W. (2018). Predicting motion picture box office performance using temporal tweet patterns. International Journal of Intelligent Computing and Cybernetics, 11(1), 64–80. https://doi.org/10.1108/IJICC-04-2017-0033
- Jing, F., & X. Chao. (2021). Fairness concern: an equilibrium mechanism for consensus-reaching game in group decision-making. Information Fusion, 72(3), 147–160. https://doi.org/10.1016/j.inffus.2021.02.024
- Karniouchina, E. V. (2011). Impact of star and movie buzz on motion picture distribution and box office revenue. International Journal of Research in Marketing, 28(1), 62–74. https://doi.org/10.1016/j.ijresmar.2010.10.001
- Kim, K., Yoon, S., & Choi, Y. K. (2019). The effects of eWOM volume and valence on product sales–an empirical examination of the movie industry. International Journal of Advertising, 38(3), 471–488. https://doi.org/10.1080/02650487.2018.1535225
- Kou, G., Peng, Y., Chao, X., Viedma, E., & Alsaadi, F., E. (2021). A geometrical method for consensus building in GDM with incomplete heterogeneous preference information. Applied Soft Computing, 105, 107224. https://doi.org/10.1016/j.asoc.2021.107224
- Lee, S., & Choeh, J. Y. (2018). The interactive impact of online word-of-mouth and review helpfulness on box office revenue. Management Decision, 56(4), 849–866. https://doi.org/10.1108/MD-06-2017-0561
- Legoux, R., Larocque, D., & Laporte, S., Belmati, S., & Boquet, T. (2016). The effect of critical reviews on exhibitors’ decisions: Do reviews affect the survival of a movie on screen? International Journal of Research in Marketing, 33(2), 357–374. https://doi.org/10.1016/j.ijresmar.2015.07.003
- Lie, H. (2015). An Empirical Study on the factors affecting the movie box office revenue in China [dissertation]. Beijing JiaoTong University, pp. 18–19.
- Liu, Y. (2006). Word of mouth for movies: Its dynamics and impact on box office revenue. Journal of Marketing, 70(3), 74–89. https://doi.org/10.1509/jmkg.70.3.074
- McKenzie, J. (2009). Revealed word-of-mouth demand and adaptive supply: Survival of motion pictures at the Australian box office. Journal of Cultural Economics, 33(4), 279–299. https://doi.org/10.1007/s10824-009-9104-4
- Milaković, I., Anić, I., & Mihić, M. (2020). Drivers and consequences of word of mouth communication from the senders’ and receivers’ perspectives: The evidence from the Croatian adult population. Economic Research-Ekonomska Istraživanja, 33(1), 1667–1684. https://doi.org/10.1080/1331677X.2020.1756373
- Minnema, A., Bijmolt, T. H. A., Gensler, S., & Wiesel, T. (2016). To keep or not to keep: Effects of online customer reviews on product returns. Journal of Retailing, 92(3), 253–267. https://doi.org/10.1016/j.jretai.2016.03.001
- Moon, S., Bergey, P. K., & Iacobucci, D. (2010). Dynamic effects among movie ratings, movie revenues, and viewer satisfaction. Journal of Marketing, 74(1), 108–121. https://doi.org/10.1509/jmkg.74.1.108
- Phan, Q., Pham, T. N., & Nguyen, L. H. L. (2020). How to drive brand engagement and EWOM intention in social commerce: A competitive strategy for the emerging market. Journal of Competitiveness, 12(3), 136–155. https://doi.org/10.7441/joc.2020.03.08
- Phan, Q. P. T., & Pilík, M. (2018). The relationship between website design and positive ewom intention: Testing mediator and moderator effect. Journal of Business Economics and Management, 19(2), 382–398. https://doi.org/10.3846/jbem.18.5690
- Reinstein, D. A., & Snyder, C. M. (2005). The influence of expert reviews on consumer demand for experience goods: A case study of movie critics. Journal of Industrial Economics, 53(1), 27–51. https://doi.org/10.1111/j.0022-1821.2005.00244.x
- Salganik, M. J., & Watts, D. J. (2008). Leading the herd astray: An experimental study of self-fulfilling prophecies in an artificial cultural market. Social Psychology Quarterly, 71(4), 255–338. https://doi.org/10.1177/019027250807100404
- Sun, M. (2012). How does the variance of product ratings matter? Management Science, 58(4), 696–707. https://doi.org/10.1287/mnsc.1110.1458
- Wang, F., Liu, X., & Fang, E. E. (2015). User reviews variance, critic reviews variance, and product sales: An exploration of customer breadth and depth effects. Journal of Retailing, 91(3), 372–389. https://doi.org/10.1016/j.jretai.2015.04.007
- Wu, H. (2019). Influencing Factors and Forecast Analysis of Chinese Film Box Office. Capital University of Economics and Business.
- Yoon, S. (2013). Do negative consumption experiences hurt manufacturers or retailer? Psychology & Marketing, 30(7), 555–565. https://doi.org/10.1002/mar.20627
- Yoon, Y., Kim, A. J., & Kim, J., & Choi, J. (2019). The effects of eWOM characteristics on consumer ratings: Evidence from TripAdvisor.com. International Journal of Advertising, 38(5), 1–20. https://doi.org/10.1080/02650487.2018.1541391
- You, Y., Vadakkepatt, G. G., & Joshi, A. M. (2015). A meta-analysis of electronic word-of-mouth elasticity. Journal of Marketing, 79(2), 19–39. https://doi.org/10.1509/jm.14.0169
- Zhou, W., & Duan, W. (2016). Do professional reviews affect online user choices through user reviews? An empirical study. Journal of Management Information Systems, 33(1), 202–228. https://doi.org/10.1080/07421222.2016.1172460