
 ?Mathematical formulae have been encoded as MathML and are displayed in this HTML version using MathJax in order to improve their display. Uncheck the box to turn MathJax off. This feature requires Javascript. Click on a formula to zoom.
Abstract
This paper firstly puts forward to employ investor attention obtained from Google trends to explain and forecast carbon futures return in the European Union-Emission Trading Scheme (EU-ETS). Our empirical results show that investor attention is a granger cause to changes in carbon return. Furthermore, investor attention generates both linear and non-linear effects on carbon return. The results demonstrate that investor attention shows excellent explanatory power on carbon return. Moreover, we conduct several out-of-sample forecasts to explore the predictive power of investor attention. The results indicate that incorporating investor attention indeed improve the accuracy of out-of-sample forecasts both in short and long horizons and can generate significant economic values. All results demonstrate that investor attention is a non-negligible pricing factor in carbon market.
1. Introduction
Economic growth exhausts huge amount of energy resources and thus emits lots of carbon dioxides, which induces the global warming to become one urgent issue for all human beings (Batrancea et al., Citation2019). Global warming further affects agricultural, industrial manufacture and economic growth, and even the human sustainable development (Haseeb et al., Citation2019; L. Batrancea et al., Citation2020; Grzeszczyk et al., Citation2021). For the sake to prevent these effects, the famous Kyoto Protocol was signed and thus a carbon trading mechanism in EU called European Union-Emission Trading Scheme, aiming to regulate carbon emissions for mitigating global warming (I. Batrancea et al., Citation2020), was approved. The mechanism shows excellent efficiency as it reduces emissions with the help of capital market, making carbon reduction a financial activity to some extent (Teixidó et al., Citation2019). Due to the huge trading volumes, drastic price changes and strict financial regulations, the EU-ETS was regarded as a common financial market for analyzing financial characteristics, i.e., return (Arouri et al., Citation2012), volatility (Balietti, Citation2016), price forecasting (Zhao et al., Citation2018) etc.
In this paper, we focus on the carbon price explaining and forecasting since many puzzles remain to be solved and attract numerous researchers (Segnon et al., Citation2017; Zhao et al., Citation2018). Specifically, we introduce and suppose one novel factor, i.e., investor attention, generated from behavior finance that affects carbon price. Thus, the main body of this paper is to empirically discuss whether the above hypothesis is tenable. In fact, investor attention has broadly researched in other financial markets like stock markets (Wen et al., Citation2019), FX markets (Han et al., Citation2018) and commodity markets (Kou et al., Citation2018) and has proved to be an influential pricing factor in these markets.
Our purpose is to combine the studies of energy economics and behavior finance in order to discover the potential linkages between investor attention and carbon futures return. This paper makes following contributions to the existing literature. First, it is the first attempt to explain carbon futures return from investor attention. We adopt the granger causality test, vector autoregressive model (VAR), linear and non-linear model specifications to illustrate the influences of attention on carbon return. The results show investor attention is too important to ignore for explaining carbon futures variation. Second, we conduct several out-of-sample forecasts. The results show the predictive models incorporated with attention outperform the historical average both in one and longer period ahead predictions. The results indicate great importance of investor attention in carbon market forecasting from statistical level. Third, we construct simple portfolios including carbon asset and risk-free asset to further illustrate the usefulness of investor attention. Specifically, we compare the portfolio performances of the benchmark model and the predictive models. The results show the predictive models have a greater average utility and a higher sharp ratio, which indicates that it is beneficial to take attention into consideration as it surely generates economic values. Finally, several robustness checks are made. Specifically, the selected keywords and the time scale are changed. Fortunately, these changes do not alter our results. The four aspects lead to the conclusion that investor attention is a non-negligible pricing factor in carbon market.
The rest of this paper is summarized as follows. Section 2 shows a brief literature review. Section 3 presents our data. Empirical results of the in-sample analysis and the out-of-sample forecasts are shown in Sections 4 and 5, respectively. Section 6 presents the asset allocation analysis. Section 7 shows the robustness checks and Section 8 concludes the paper.
2. Literature review
Ever since the establishment of the EU-ETS, it quickly becomes one center of energy economics research. Regarding the financial performance of the carbon allowance market, numerous studies have investigated the financial characteristics of carbon prices (Segnon et al., Citation2017; Dutta, Citation2018; Jia et al., Citation2020). Research regarding the carbon markets in developing countries are also booming, especially the Chinese carbon market (Y. Zhang et al., Citation2018; Fu & Zheng, Citation2020). Research on the correlations between carbon spot and futures also become a new research hotspot, as it is widely researched in the traditional financial markets, i.e., the oil market (Holmes & Otero, Citation2019; Shao et al., Citation2019).
Analysts explicitly recognized that the energy markets play crucial roles in shaping the carbon prices. The reason was that marginal fuel-switching costs from highly carbon-intensive sources of energy to less-carbon-intensive sources for power and heat generation form an important determinant of the carbon prices (Dutta, Citation2018; Krokida et al., Citation2020). Although the studies on carbon price analysis have made some achievements, the literature on carbon price forecasting seems limited. For example, Zhu and Wei (Citation2013) and J. Zhang et al. (Citation2018) put forward combined hybrid models to forecast carbon prices, respectively.
Behavior finance develops rapidly in recent years and shows the importance of individual investor in financial markets (Han et al., Citation2017; Audrino et al., Citation2020). In this paper, we argue that a new variable, i.e., investor attention, measured by Google search volume index to be an efficient variable in explaining and predicting carbon futures return. In fact, investor attention has already been proved to be an influential index in other markets. For example, Vozlyublennaia (Citation2014) found interactive effects between lagged return and attention for several security indexes, besides, the results suggested attention could enhance the predictability of index returns. Han et al. (Citation2017) proved the importance of investor attention on oil market. Kou et al. (Citation2018) investigated the effects of investor attention on Chinese commodity futures market. Research also indicated investor attention show impacts in the FX markets (Han et al., Citation2018; Han et al., Citation2018). Furthermore, there exists some research to illustrate the in-depth impacts of investor attention on financial markets. Such as, non-linear granger causality relationship (Li et al., Citation2019), memory situation (Y. Zhang et al., in press). Scholars also found investor attention on certain asset can spill to related financial markets (Wu et al., Citation2019).
Existing studies demonstrate the conspicuous effects of investor attention in many financial markets, this raises our great interests on the roles of investor attention in the emerging carbon markets as current research is less involved in this field. Thus, the novelty of this paper lies in filling of the potential research gap by introducing the investor attention to the carbon market. Specifically, we make comprehensive investigations in explaining and forecasting the carbon futures returns by investor attention.
3. Data
In this section, we first introduce the calculation of carbon futures return. Due to data availability, we collect weekly carbon futures prices from Ember (https://ember-climate.org/carbon-price-viewer/) during January 10, 2016 to August 23, 2020, at which period, the ‘Paris Agreement’ reached an agreement and opened for signature. All prices are transferred to log-returns for further investigations. We next introduce the construction method of investor attention. In line with previous studies, we select Google search volume index from Google Trends (http://www.Google.com/trends) and transfer the index to log-returns to represent investor attention (Vozlyublennaia, Citation2014; Han et al., Citation2018; Han et al., Citation2018). The index shows several advantages, first, Internet users commonly employ a search engine to collect information, and Google continues to be the most favorite one around the world; second, and more critically, search can help to avoid the errors resulted from indirect proxies, such as excess return (Aboody et al., Citation2010), turnover (Loh, Citation2010), news and headlines (Yuan, Citation2015); third, Google search intensity provides a reasonable measure of acquisition of publicly available information from a wide range of sources, providing the investor with a highly diversified information set.
We select several key words closely related to carbon market, i.e., carbon emission, carbon dioxide emission, etc. We do not search ‘EUA’ which is traded in the EU-ETS as ‘EUA’ may represents other meanings, for example, European University Association, Emergency Use Authorization, etc. Basic granger causality test shows that investor attention on the keyword of ‘carbon emission’ is a relative powerful variable inside the potential variables mentioned above, while others are not. Thus, we select the investor attention on carbon emission to conduct the consequent research.
Concerning the carbon futures return can be influenced by related financial assets (Luo & Wu, Citation2016; Ji et al., Citation2018; Chen et al., Citation2019), we thus include several indicators, i.e., Brent oil futures, Natural gas futures, Dow Jones Industrial Average Index, NASDQ Composite Index, DAX Index, etc. All the data are obtained from DataStream. The reasons to choose these assets are as follows, first, Brent oil is widely used in the research of oil market according to numerous studies (Ji et al., Citation2018; Li et al., Citation2019). Besides, the exchange of Brent oil is located in the EU (despite the UK is now separated from the EU, it is a member of the EU during our sample period), which may make the correlations with carbon market more closely; second, Natural gas futures is also an important energy market and it is widely used in research of energy economics (Niu & Wang, Citation2017; Chen et al., Citation2019); third, the US stock market is still the most important around the world, thus, two stock indexes, i.e., Dow Jones Industrial Average Index, NASDQ Composite Index, are selected to represent the development of the world stock market; forth, the Germany plays a leadership role in carbon reductions, and its stock market is very important in the EU. Thus, the indicator to reflect the Germany stock market is also selected.
Some basic descriptive statistics of carbon futures return, investor attention and the control variables are shown in . As shown in the table, the mean value of the carbon futures return is 0.0050, while the standard deviation is 0.0569. Obviously, the magnitude of the standard deviation is close to zero and the mean value is even smaller. Besides, the value of standard deviation to mean is equal to 11.38, which represents that the carbon futures return series is volatile. The maximized return of carbon futures is 0.1697, while the minimized return is −0.3045. The difference between maximized and minimized value reaches more than 0.45. Compared with the descriptive statistics of carbon futures return, it is obvious that the difference between maximized and minimized value of investor attention, as well as the standard deviation are much higher than that of carbon futures return. The specific value of standard deviation to mean is even higher than that of carbon futures return. Therefore, it is also high for volatilities of investor attention. The non-zero skewness and kurtosis (not equal to three) of the series indicate that the time series of carbon futures return, investor attention on ‘carbon emission’ and the control variables have the same characteristics as commonly financial assets (Luo & Wu, Citation2016; Y. Zhang et al., Citation2017).
Table 1. Descriptive statistics.
In the subsequent section, we adopt a VAR model to analyze the interrelation between carbon attention and carbon futures return. The VAR model requires the selected series to be stationary. We implement the Augmented Dickey-Fuller (ADF) stationary test and the results are reported in . According to the results, all the selected series are stationary, thus can conduct the VAR modelling analysis.
Table 2. ADF test results.
4. In-sample analyses
In this section, we aim to explore the relationships between carbon futures return and investor attention. We certify a sample period from January 10, 2016 to February 24, 2019 as the in-sample period. And thus, the remaining parts are considered for the out-of-sample forecasts.
4.1. Granger causality test
We conduct a basic Granger causality test to investigate the linear causality relationships between carbon futures return and investor attention. The results of Granger causality test are shown in .
Table 3. Granger causality test results.
The results indicate several important facts between carbon futures return and investor attention. First, the changes in investor attention indeed cause the changes of carbon futures return. Second, the reverse effect does not exist, namely the changes in carbon futures return cannot induce the changes of investor attention. Generally, the Granger causality test results mean that investor attention influence the changes of carbon futures return.
4.2. Var analysis
The VAR model is a linear predictive model, which allows the carbon futures return at present to be predicted by several predictors including investor attention. The VAR model is widely used in estimating and predicting asset returns (Guidolin & Hyde, Citation2012; Y. Zhang & Lin, Citation2019). For the perfect fitness, we adopt the VAR model to investigate the relationships between carbon futures return and investor attention. The model can be generalized by EquationEquation (1)(1)
(1) ,
(1)
(1)
where Xt contains carbon futures return and the corresponding investor attention, p represents the lag length in the model and βi (i = 1, …, p) is the coefficient for the lagged term. The VAR specification helps us to understand the reaction of carbon futures return to the shock from investor attention under the framework of impulse response function, vice versa. In this paper, we set the lag length to 4, namely, p equals to 4. The results of VAR analysis are reported in .
Table 4. VAR analysis results.
Several interesting discoveries can be found from . For the equation of carbon futures return in the VAR model, first, attention has significant and positive effects on carbon futures return. It means that increased attention leads to the increased carbon return. The phenomenon may be accounted by the reason that investors pay attention to a specific asset will bring certain purchase intention and then trigger price pressure (Dimpfl & Jank, Citation2016; Han et al., Citation2018); second, the changes in attention may not quickly and significantly show its impacts on carbon return as the coefficient of attention at the first lag is insignificant. Such influence may appear in three and four weeks later, as and
are both significant. This phenomenon is typically different from the quickly impacts of investor attention on traditional financial markets, such as stock markets (Vozlyublennaia, Citation2014), FX markets (Han et al., Citation2018), commodity markets (Kou et al., Citation2018), etc. We suspect that the delayed response of carbon return is ascribed by the smaller coverage available for the index of attention as compared to the ample coverage of the index of stock, currency and commodity, etc., in which case it takes longer for investors in carbon market to analyze the obtained information.
From Panel A and Panel B in , we can find that there does not exist severe multi-collinearity problems. Besides, the results of residual heteroscedasticity test indicate that heteroscedasticity does not exist in the above VAR model. All the aspects denote that the VAR model is feasible and can be used for further analysis. The impulse response results are shown in the following .
Figure 1. Response of carbon futures return to the shock from investor attention.
Source: the Authors.
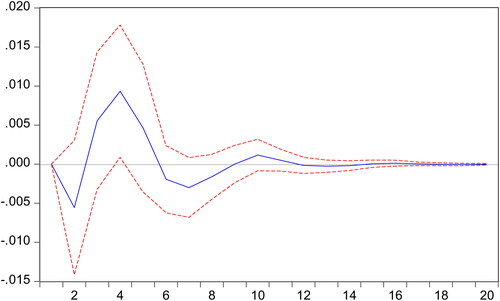
Figure 2. Response of investor attention to the shock from carbon futures return.
Note: In the above figures, the blue solid-line is the impulse response to Cholesky one standard deviation innovations, while the red dotted-line is ninety-five percent confidence interval for highest probability density. And the X-axis represents the duration of shock, while the Y-axis represents the magnitude of such shock.
Source: the Authors.
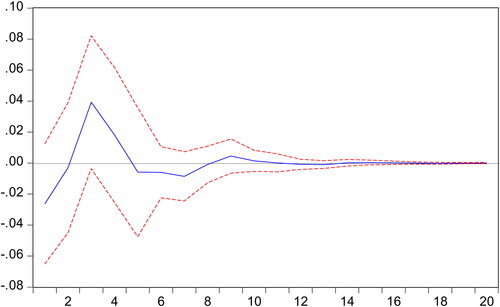
Table 5. Tests for VAR model.
As shown in the , the shock from attention surely influence the carbon futures return, vice versa. The impact of attention on carbon futures return presents dominantly positive in the response period of carbon return. Moreover, we can also conclude that the influence of attention on carbon futures return can last for about twelve weeks, while the reversed influence may last for about ten weeks. Thus, the effects of attention on carbon futures return are worth for further discussions.
4.3. High order moment
Inspired by other studies exploring the relationships between the squared term of investor attention and asset return (Han et al., Citation2018; Li et al., Citation2019), we further consider the issue between carbon futures return and investor attention. Incorporating squared terms of attention help to understand the high order moment of attention’s effects on carbon return. The model is shown by EquationEquation (2)(2)
(2) .
(2)
(2)
The coefficient γ on the squared term of investor attention measures the influence of high order moment of attention on carbon return. The results are shown in .
Table 6. The effects of high order moment.
As indicated by , investor attention still exists significantly positive effect on carbon return, which supports the results obtained from the VAR analysis. Moreover, we can also find the squared term of attention is significantly positive at the first lag and it is obviously larger than the attention term at the third and fourth lags. According to this phenomenon, we can more depend on the information of cumulative attention at the immediate past to determine the change of carbon return at present, instead of the attention at the distant past to some extent. Generally, there exists an effect of the high order moment of investor attention on carbon return and the sign of this effect emerges and vanishes quickly.
4.4. Controlling related returns
Existing studies have already proved that traditional financial markets. i.e., oil market (Ji et al., Citation2018), gas market (Chen et al., Citation2019), stock market (Luo & Wu, Citation2016) etc., are correlated with the emerging carbon market, which represents that return in these markets should be an important influencing factor for the change of carbon return. In other words, when investigating the effects of investor attention on carbon return, we should further consider the effects of returns in related markets by incorporating their return terms into the regression model. It can help us effectively identify the effects of attention by controlling the returns of the other related markets, which is also supported by previous studies (Vozlyublennaia, Citation2014; Han et al., Citation2018). The regression model are shown in EquationEquation (3)(3)
(3) ,
(3)
(3)
where represents the return in related market, i.e., Brent oil futures, Natural gas futures, Dow Jones Industrial Average Index, NASDQ Composite Index, DAX Index, etc. The coefficient δ estimates the quantitative effect of investor attention on carbon return conditional on per unit change of the return in other market. It means the coefficient δ is devoted to gauging the magnitude of the joint impact of attention and related return. The regression results are shown in .
Table 7. The joint impact results.
As portrayed by , on the one hand, the interactive terms between attention and energy returns generate significantly effects on carbon futures return. Specifically, the interactive term between attention and the return of Brent oil futures emerges significantly negative effect on carbon futures return at the first lag, while it is significantly positive for the interactive term between attention and the return of Natural gas futures at the second lag; on the other hand, the interactive terms between attention and stock returns do not appear significant effects. However, after controlling the related returns, investor attention still shows significant impacts on carbon futures return. Specifically, if the energy returns are controlled, a change in attention still positively affects carbon futures return in three and four weeks later, which supports the results we concluded above. If the stock returns are controlled, the results vary by the stock markets. For example, a change in attention will emerge positive effects the carbon futures return in four weeks later when we controlled the U.S. stock returns. While a change in attention would appear negative effects the carbon return immediately if we controlled the Germany stock returns. Thus, we should not only take into account the information of investor psychology and behavior, but also the information from related market returns when explain carbon futures return.
In summary, investor attention is a granger cause of carbon futures return. And it further generates linear and nonlinear effects on carbon futures return. All the above in-sample results certify an important reality that investor attention can effectively explain carbon futures return. However, this remarkably explanatory power does not mean that it can perform well in the out-of-sample forecasts. Thus, it is an interesting issue to explore whether investor attention can further predict carbon futures return in the out-of-sample forecasts. We show the results in the subsequent two sections.
5. Out-of-sample forecasts
As Welch and Goyal (Citation2008) argued that out-of-sample tests seem more precise for avoiding the over-fitting and evaluating return forecasts. Thus, we implement the out-of-sample forecasts to further illustrate the usefulness of investor attention on carbon return predictions. Here, the rolling window forecast method is used (Wang et al., Citation2018). We can then obtain the carbon futures return at week t + h (h is forecast horizon) based on this forecast method by employing EquationEquations (4)–(6).
(4)
(4)
(5)
(5)
(6)
(6)
The three predictive equations represent the models mentioned in the above Sections 4.2–4.4, respectively. All the parameters are estimated by sub-sample return series and are update in each prediction. The forecast horizon h represents the certain week investors would like to estimate. For example, the horizon is set to one if investors would like to estimate the return of next week, and the horizon is set to two if investors would like to estimate the return of the week after next week. According to Yin et al. (Citation2019), we analyze and assess the accuracy of different predictive models by calculating out-of-sample R squared (), mean squared forecast error (MSFE), MSFE-adjusted statistic.
5.1. One period ahead forecast
We report the out-of-sample forecasts with rolling window length set to 160 and forecast horizon equal to one. The detailed results are shown in .
Table 8. Out-of-sample prediction results with forecast horizon equal to one.
We can conclude from that after controlling two types of asset returns, i.e., Brent oil futures or Dow Jones Industrial Average, the two predictive models incorporating attention significantly outperform the historical average. Other models perform worse than the benchmark model as the is negative, which represents that the models’ forecasting errors are significantly greater than the historical average.
5.2. Longer horizon forecasts
We conduct further explorations on the out-of-sample forecasts for longer horizons to excavate more information about the forecast performance of investor attention on carbon return. Specifically, we set the forecast horizon as 2, 4, 8 and 12. The settings reflect the out-of-sample forecasts performance in half month, one month, two month and three month later, respectively. The corresponding results are shown in the panel A, B, C and D of .
Table 9. Out-of-sample prediction results with different forecast horizons.
From , we can conclude the predictive models incorporating attention indeed improve the forecast performance over the benchmark model even in longer horizon predictions. Specifically, if the returns of Brent oil futures or Dow Jones Industrial Average is controlled, the is positive and the MSFE-adj is significant in half month later, which means the two predictive models incorporating attention significantly outperform the unbeatable historical average. For other horizons, the predictive models incorporating attention and controlling the energy returns or the Germany stock returns is obviously superior to the benchmark model. Moreover, the predictive model controlling the returns of Brent oil futures emerges the most forecasting performance in all horizons. It means that we can employ the model to get better predictions on carbon return. However, the table also indicate an important fact that despite some predictive models shows an excellent explanatory power on carbon return, their prediction powers may weaker than the benchmark model in the out-of-sample forecasts.
Generally, the predictive models incorporating investor attention can be surely applied in the out-of-sample forecasts of carbon futures return, especially the model controlling the returns of Brent Oil futures. However, statistical usefulness does not mean that the forecast would generate economic values. Thus, following Neely et al. (Citation2014) and Wang et al. (Citation2018), several simple portfolios including carbon futures and risk-free assets are constructed to calculate the certainty equivalent return (CER).
6. Economic values
We suppose the investors who participate in asset allocation are the risk-averse investors with mean-variance preference. We collect and compute the return of LIBOR, which is usually regarded as the risk-free asset. Assume that the risk-averse investors with mean-variance performance optimally allocate across risk-free asset and carbon futures based on the forecasts with investor attention. We then consider the CER gain, which is used to measure the difference between the CER for the predictive regression forecasts incorporating investor attention expressed by the EquationEquations (4)–(6) and the CER for the historical average forecast. We also include the indicator of Sharpe ratio to enhance the evaluation accuracy of economic values. The economic values results based on carbon asset allocation exercise including the utility and sharp ratio, are shown in .
Table 10. Portfolio performance measures.
From , we can conclude the forecasts incorporated with attention outperform the historical average forecast in terms of economic values. First, from the perspective of the utility gained, it is clear that the portfolio utility decreases with the increasing of risk aversion degree for most cases of parameter settings, which means the risky preference of the investors will significantly influence the portfolio utility. And all the predictive models incorporating attention and controlling related returns have a greater utility compared with the historical average. However, for the predictive models represented by the EquationEquations (4)(4)
(4) and Equation(5)
(5)
(5) , the results vary. Second, from the perspective of Sharpe ratio. For all the parameter settings, the predictive models have a larger Sharpe ratio than the benchmark model. And the Sharpe ratios of the predictive models controlling the related returns have been significantly improved compared with other predictive models (EquationEquations (4)
(4)
(4) and Equation(5)
(5)
(5) ) and the historical average. Furthermore, the main results cannot be altered with the changes in transaction cost, which means that our results are robust.
To sum up, employing investor attention to forecast carbon futures return can bring significant economic values based on allocation exercises. Particularly, it is of great importance to control the returns in other related financial markets, as it can significantly improve utility and Sharpe ratio of the carbon futures portfolio compared with the historical average benchmark.
7. Robustness checks
In this paper, we argue that investor attention is an important factor in explaining and forecasting carbon futures return. However, all the results are conducted for certain sample period based on the key word of ‘carbon emission’ from Google Trends. It is also an interesting and important issue to explore whether the results vary depending on different key words and sample period. Thus, we implement the robustness checks to guarantee the preciseness.
First, we search other three key words, i.e., ‘Carbon price’, ‘Carbon trading’ and ‘EU ETS’ during the same period from January 10, 2016 to August 23, 2020. Then, we set different window length to implement the Granger causality test in order to certify whether investor attention is still an important factor in explaining the changes in carbon futures return. The results of Granger causality tests show that changes in keyword do not alter the explanatory power of attention on carbon return.
Next, we update our sample to the period from the start of phase III of EU ETS to the end of 2015 with investor attention on ‘Carbon emission’ adopted. The time scale is also the period for ‘pre-Paris Agreement’, such division may guarantee that our conclusion on investor attention will not be changed due to one important global carbon reduction event. We attempt a window length to 102 and lag length to 2, in which case, such setting ensures the results pass the basic Granger causality test. All the related empirical processes are conducted as they are in Section 4. As shown in the following table, we can still conclude investor attention is indeed an important factor in explaining carbon futures return. Here, we should notice that the window length and lag length vary from our empirical research in Section 4, this is not surprising, and which may be accounted by the sensitivities of investors on different samples and keywords. Moreover, the direction of the impact of investor attention on carbon return is obviously different from the above results summarized in Section 4. Although it emerges significantly negative effects, it does not influence the conclusion that investor attention is a non-negligible pricing factor in carbon market and deserves more focuses ().
Table 11. Granger causality and VAR analyses for robustness checks.
8. Conclusion
In this paper, we conduct a first attempt to explore the movement of carbon futures return from a novel perspective, i.e., investor attention. We implement the Granger causality test, the VAR analysis and several non-linear models to investigate the impacts of investor attention on carbon return. The results can be summarized as follows. First, a unidirectional granger cause from investor attention to carbon return exist; besides, investor attention shows both linear and non-linear effects on carbon return, which represents that attention is an important factor in explaining carbon return. Second, based on the excellent explanatory power, we make the out-of-sample forecasts, the results show the predictive models outperform the benchmark model in different horizons. Third, we construct simple portfolios to evaluate the economic values of the predictive models. The results show the predictive models have greater economic values. Finally, we implement robustness checks to ensure the accuracy of our results that investor attention is a non-negligible pricing factor in carbon market.
In closing, we believe that our efforts provide further evidence for the literature on investor attention where it is an important factor in explaining and forecasting returns in financial markets. For market participants, the results shed lights to forecast carbon market both in statistical and economic levels. However, several disadvantages exist. For example, attempts to apply alternative estimation methods except for the OLS may need to be comprehensively researched. Moreover, we mainly focus on the investor attention closely relate to the carbon market, while investor attention on other markets may also be an important influence factor on the returns of carbon market as these markets are closely related. The deficiencies should also be researched comprehensively in the future.
Author’s Contributions
Yinpeng Zhang implements the empirical process in this paper and writes the original manuscript. Ying Chen provides the methodologies used in this paper. You Wu provides the idea and polishes the paper. Panpan Zhu collects the data and revises the original manuscript.
Additional information
Funding
References
- Aboody, D., Lehavy, R., & Trueman, B. (2010). Limited attention and the earnings and announcement returns of past stock market winners. Review of Accounting Studies, 15(2), 317–344. https://doi.org/10.1007/s11142-009-9104-9
- Arouri, M. E. H., Jawadi, F., & Nguyen, D. K. (2012). Nonlinearities in carbon spot-futures price relationship during phase II of the EU ETS. Economic Modelling, 29(3), 884–892. https://doi.org/10.1016/j.econmod.2011.11.003
- Audrino, F., Sigrist, F., & Ballinari, D. (2020). The impact of sentiment and attention measures on stock market volatility. International Journal of Forecasting, 36(2), 334–357. https://doi.org/10.1016/j.ijforecast.2019.05.010
- Balietti, A. C. (2016). Trader types and volatility of emission allowance prices. Evidence from EU ETS phase I. Energy Policy, 98, 607–620. https://doi.org/10.1016/j.enpol.2016.09.006
- Batrancea, I., Batrancea, L., Nichita, A., Gaban, L., Masca, E., Morar, I., Fatacean, G., & Moscviciov, A. (2019). An econometric approach on production, costs and profit in Romanian coal mining enterprises. Economic Research-Ekonomska Istraživanja, 32(1), 1019–1036. https://doi.org/10.1080/1331677X.2019.1595080
- Batrancea, I., Rathnaswamy, M. K., Batrancea, L., Nichita, A., Gaban, L., Fatacean, G., Tulai, H., Bircea, I., & Rus, M. (2020). A panel data analysis on sustainable economic growth in India, Brazil, and Romania. Journal of Risk and Financial Management, 13(8), 170. https://doi.org/10.3390/jrfm13080170
- Batrancea, L., Rathnaswamy, M. M., Batrancea, I., Nichita, A., Rus, M., Tulai, H., Fatacean, G., Masca, E. S., & Morar, I. D. (2020). Adjusted net savings of CEE and Baltic nations in the context of sustainable economic growth: A panel data analysis. Journal of Risk and Financial Management, 13(10), 234. https://doi.org/10.3390/jrfm13100234
- Chen, Y., Qu, F., Li, W., & Chen, M. (2019). Volatility spillover and dynamic correlation between the carbon market and energy markets. Journal of Business Economics and Management, 20(5), 979–999. https://doi.org/10.3846/jbem.2019.10762
- Dimpfl, T., & Jank, S. (2016). Can internet search queries help to predict stock market volatility? European Financial Management, 22(2), 171–192. https://doi.org/10.1111/eufm.12058
- Dutta, A., (2018). Modeling and forecasting the volatility of carbon emission market: The role of outliers, time-varying jumps and oil price risk. Journal of Cleaner Production, 1721. 2773–2781. https://doi.org/10.1016/j.jclepro.2017.11.135
- Fu, Y., & Zheng, Z. (2020). Volatility modeling and the asymmetric effect for China’s carbon trading pilot market. Physica A: Statistical Mechanics and Its Applications, 542, 123401. https://doi.org/10.1016/j.physa.2019.123401
- Grzeszczyk, T. A., Izdebski, W., Izdebski, M., & Waściński, T. (2021). Socio-economic factors influencing the development of renewable energy production sector in Poland. E&M Economics and Management, 24(1), 38–54. https://doi.org/10.15240/tul/001/2021-1-003
- Guidolin, M., & Hyde, S. (2012). Can VAR models capture regime shifts in asset returns? A long-horizon strategic asset allocation perspective. Journal of Banking & Finance, 36(3), 695–716. https://doi.org/10.1016/j.jbankfin.2011.10.011
- Han, L., Li, Z., & Yin, L. (2017). The effects of investor attention on commodity futures markets. Journal of Futures Markets, 37(10), 1031–1049. https://doi.org/10.1002/fut.21853
- Han, L., Lv, Q., & Yin, L. (2017). Can investor attention predict oil prices? Energy Economics, 66, 547–558. https://doi.org/10.1016/j.eneco.2017.04.018
- Han, L., Wu, Y., & Yin, L. (2018). Investor attention and currency performance: International evidence. Applied Economics, 50(23), 2525–2551. https://doi.org/10.1080/00036846.2017.1403556
- Han, L., Xu, Y., & Yin, L. (2018). Does investor attention matter? The attention-return relationships in FX markets. Economic Modelling, 68, 644–660. https://doi.org/10.1016/j.econmod.2017.06.015
- Haseeb, M., Wattanapongphasuk, S., & Jermsittiparsert, K. (2019). Financial development, market freedom, political stability, economic growth and CO2 emissions: An unexplored nexus in ASEAN countries. Contemporary Economics, 13(3), 363–374. https://go.gale.com/ps/i.do?id=GALE%7CA611171040&sid=googleScholar&v=2.1&it=r&linkaccess=abs&issn=20840845&p=AONE&sw=w&userGroupName=anon%7E54195609
- Holmes, M. J., & Otero, J. (2019). Re-examining the movements of crude oil spot and futures prices over time. Energy Economics, 82, 224–236. https://doi.org/10.1016/j.eneco.2017.08.034
- Ji, Q., Zhang, D., & Geng, J. (2018). Information linkage, dynamic spillovers in prices and volatility between the carbon and energy markets. Journal of Cleaner Production, 198, 972–978. https://doi.org/10.1016/j.jclepro.2018.07.126
- Jia, J., Wu, H., Zhu, X., Li, J., & Fan, Y. (2020). Price break points and impact process evaluation in the EU ETS. Emerging Markets Finance and Trade, 56(8), 1691–1714. https://doi.org/10.1080/1540496X.2019.1694888
- Kou, Y., Ye, Q., Zhao, F., & Wang, X. (2018). Effects of investor attention on commodity futures markets. Finance Research Letters, 25, 190–195. https://doi.org/10.1016/j.frl.2017.10.014
- Krokida, S., Lambertides, N., Savva, C. S., & Tsouknidis, D. A. (2020). The effects of oil price shocks on the prices of EU emission trading system and European stock returns. The European Journal of Finance, 26(1), 1–13. https://doi.org/10.1080/1351847X.2019.1637358
- Li, S., Zhang, H., & Yuan, D. (2019). Investor attention and crude oil prices: Evidence from nonlinear Granger causality tests. Energy Economics, 84, 104494. https://doi.org/10.1016/j.eneco.2019.104494
- Loh, R. K. (2010). Investor attention and the underreaction to stock recommendation. Financial Management, 39(3), 1223–1252. https://doi.org/10.1111/j.1755-053X.2010.01110.x
- Luo, C., & Wu, D. (2016). Environment and economic risk: An analysis of carbon emission market and portfolio management. Environmental Research, 149, 297–301. https://doi.org/10.1016/j.envres.2016.02.007
- Neely, C. J., Rapach, D. E., Tu, J., & Zhou, G. (2014). Forecasting the equity risk premium: The role of technical indicators. Management Science, 60(7), 1772–1859. https://doi.org/10.1287/mnsc.2013.1838
- Niu, H., & Wang, J. (2017). Return volatility duration analysis of NYMEX energy futures and spot. Energy, 140, 837–849. https://doi.org/10.1016/j.energy.2017.09.046
- Segnon, M., Lux, T., & Gupta, R. (2017). Modeling and forecasting the volatility of carbon dioxide emission allowance prices: A review and comparison of modern volatility models. Renewable and Sustainable Energy Reviews, 69, 692–704. https://doi.org/10.1016/j.rser.2016.11.060
- Shao, Y., Yang, Y., Shao, H., & Stanley, H. E. (2019). Time-varying lead–lag structure between the crude oil spot and futures markets. Physica A: Statistical Mechanics and Its Applications, 523, 723–733. https://doi.org/10.1016/j.physa.2019.03.002
- Teixidó, J., Verde, S. F., & Nicolli, F. (2019). The impact of the EU emissions trading system on low-carbon technological change: The empirical evidence. Ecological Economics, 164, 164, Article 106347. https://doi.org/10.1016/j.ecolecon.2019.06.002
- Vozlyublennaia, N. (2014). Investor attention, index performance, and return predictability. Journal of Banking & Finance, 41, 17–35. https://doi.org/10.1016/j.jbankfin.2013.12.010
- Wang, Y., Wei, Y., Wu, C., & Yin, L. (2018). Oil and the short-term predictability of stock return volatility. Journal of Empirical Finance, 47, 90–104. https://doi.org/10.1016/j.jempfin.2018.03.002
- Welch, I., & Goyal, A. (2008). A comprehensive look at the empirical performance of equity premium prediction. The. Review of Financial Studies, 21(4), 1455–1508. https://doi.org/10.1093/rfs/hhm014
- Wen, F., Xu, L., Ouyang, G., & Kou, G. (2019). Retail investor attention and stock price crash risk: Evidence from China. International Review of Financial Analysis, 65, 101376. https://doi.org/10.1016/j.irfa.2019.101376
- Wu, Y., Han, L., & Yin, L. (2019). Our currency, your attention: Contagion spillovers of investor attention on currency returns. Economic Modelling, 80, 49–61. https://doi.org/10.1016/j.econmod.2018.05.012
- Yin, L., Feng, J., Liu, L., & Wang, Y. (2019). It’s not that important: The negligible effect of oil market uncertainty. International Review of Economics & Finance, 60, 62–84. https://doi.org/10.1016/j.iref.2018.12.019
- Yuan, Y. (2015). Market-wide attention, trading, and stock returns. Journal of Financial Economics, 116(3), 548–564. https://doi.org/10.1016/j.jfineco.2015.03.006
- Zhang, Y., Chu, G., & Shen, D. (in press). The role of investor attention in predicting stock prices: The long short-term memory networks perspective. Finance Research Letters, 38, 101484. https://doi.org/10.1016/j.frl.2020.101484
- Zhang, J., Li, D., Hao, Y., & Tan, Z. (2018). A hybrid model using signal processing technology, econometric models and neural network for carbon spot price forecasting. Journal of Cleaner Production, 204, 958–964. https://doi.org/10.1016/j.jclepro.2018.09.071
- Zhang, Y., & Lin, J. (2019). Can the VAR model outperform MRS model for asset allocation in commodity market under different risk preferences of investors? International Review of Financial Analysis, 66, 101395. https://doi.org/10.1016/j.irfa.2019.101395
- Zhang, Y., Liu, Z., & Xu, Y. (2018). Carbon price volatility: The case of China. PLoS One, 13(10), e0205317. https://doi.org/10.1371/journal.pone.0205317
- Zhang, Y., Liu, Z., & Yu, X. (2017). The diversification benefits of including carbon assets in financial portfolios. Sustainability, 9(3), 437. https://doi.org/10.3390/su9030437
- Zhao, X., Han, M., Ding, L., & Kang, W. (2018). Usefulness of economic and energy data at different frequencies for carbon price forecasting in the EU ETS. Applied Energy, 216, 132–141. https://doi.org/10.1016/j.apenergy.2018.02.003
- Zhu, B., & Wei, Y. (2013). Carbon price forecasting with a novel hybrid ARIMA and least squares support vector. Omega, 41(3), 517–524. https://doi.org/10.1016/j.omega.2012.06.005