
 ?Mathematical formulae have been encoded as MathML and are displayed in this HTML version using MathJax in order to improve their display. Uncheck the box to turn MathJax off. This feature requires Javascript. Click on a formula to zoom.
Abstract
Due to the Covid-19 pandemic, governments across the EU countries had to introduce measures to close the borders, restrict the movement of people, and suspend business activities in nonessential sectors. These restrictions threatened to result in the worst economic shock since the Great Depression of the 1930s. This situation forced the EU leaders to quickly implement urgent measures in the form of stimulating packages in order to avoid a catastrophic economic collapse. The measures, however, have been implemented without coordination and insufficiently considering the solidarity principle among the Member States, which is one of the EU basic principles. In that way, the already existing gap in development among the EU economies has become even more pronounced, which will certainly have an impact on the convergence process in the EU. In that sense, this paper is aimed at analyzing the convergence process among the EU economies during the period from 2004 to 2020 and comparing differences among the EU member states during the pandemic crisis (in 2020) and the global economic crisis (in 2008). To define the policy recommendations for overcoming the crisis and for obtaining a satisfactory level of real convergence and nominal convergence, Hierarchical Agglomerative Clustering (HAC) was performed on the data for 2020 and five clusters were derived.
1. Introduction
The pandemic is an unprecedented and unexpected event posing numerous challenges to economies and the financial system (Rizvi, Yarovaya, et al., 2020). The Coronavirus (COVID-19) pandemic, which has caused a global health crisis, has had a significant negative impact on the economy, business and finance worldwide, causing an economic disaster comparable with the Great Depression and the Global Financial Crisis (Yarovaya et al., Citation2020a). It has determined both demand and supply shocks that rapidly led to the economic crisis (Rizvi, Mirza, et al., Citation2020), so the governments have been facing a landslide of challenges demanding immediate action (Mirza et al., Citation2020a). Namely, policymakers are being faced with a very challenging task of providing support to the healthcare system and employment along with strong interventions in the economic and financial systems so as to prevent an economic collapse (Mirza et al., Citation2020). The effects of the pandemic will be felt in financial, stock and commodities markets for some years in a near future (Yarovaya et al., Citation2021). Such a situation will require good asset management in such turbulent conditions (Mirza et al., Citation2020b). As a result, the global GDP growth has been experiencing a significant contraction, whereas the recovery prospects are very uncertain (Yarovaya et al., Citation2020b).
The essential difference between this crisis and that of 2008 is that the current crisis is not structural. The crisis of 2008 was a structural shock on financial markets, and it took time to put everything under control. During the crisis of 2008, the financial disruptions that later caused a great trade collapse were the problem, which was followed by the sovereign debt crisis a few years after that. On the other hand, the pandemic crisis is an exogenous shock. It represents the sudden stopping of production in all economic activities and has the characteristics of both a supply-chain disruption crisis and the crisis caused by a demand shock. These mixed causes and the highly correlated effects difficult to estimate make the current crisis more difficult to handle in terms of the economic policy measures. Comparing this crisis with the other pandemics of a recent time, this pandemic mostly affected developed economies, especially those highly dependent on tourism (such as France, Greece, Italy, and Spain). The shock to services will not quickly be recovered, because the public will refrain from consuming nonexistence services as much as possible. Furthermore, the quarantine and bans on travelling reduced productivity and caused temporary drops in employment. The decline was also particularly sharp in the service sector. Diversity on the labor markets among the EU economies will continue to persist as unemployment rates are expected to continue to be considerably different across the EU countries.
Gräbner et al. (Citation2020a, Citation2020b) pointed out the fact that differences in the GDP and unemployment were a result of different growth models in the European Monetary Union (EMU). The southern EMU members followed debt-led growth models, which resulted in increasing the private sector indebtedness and the accumulation of current account deficits. On the other hand, the northern EMU members applied export-led growth models, which resulted in current account surpluses and a lower debt. So, it can be expected that the COVID-19 crisis will have especially negative effects on public finance and trade. The practice of many countries implying spending large sums of money during the pandemic so as to help their citizens and the economy may lead to the rapid growth of the state indebtedness and deepen the crisis itself. There are the economic analysts who even warn that a new debt crisis is yet to come (Briceño & Perote, Citation2020; Leandro, Citation2020; Odendalh & Springerford, Citation2020), but Bisciari et al. (Citation2020a, Citation2020b) have claimed in their study that the CEE region will face a strong and robust growth again after pandemic, supporting the convergence process in the EU area as a whole. In the area of trade flows, it is worth noting that the deglobalization process intensified. The post-pandemic world will be characterized by tighter restrictions on the movement of goods, services, capital, labor, technology, data, and information. In 2008, trade volumes collapsed in all countries and for almost all products at the same time and at an unprecedented pace. On the other hand, as COVID-19 has mainly been a demand shock so far, imports will fall mostly in the countries hit most severely by the crisis (i.e., developed countries). Distortions on the goods market and in the fiscal sphere have made obtaining a satisfactory level of price stability a very hard task for policymakers to accomplish, especially so in the countries that recorded deflation (Leandro & Jimeno, Citation2020).
Taking into account all the mentioned issues arising from the pandemic crisis, this paper aims to analyze real convergence and nominal convergence among the EU countries based on the six indicators (i.e., the GDP per capita PPP, the unemployment rate, the current-account balance, the inflation rate, the budget balance, and the gross debt) at the level of all the member states, the New Member States (NMS) and the Old Member States (OMS), during the period between 2004 and 2020 and compare the effects of the global economic crisis of 2008 and the current pandemic crisis. In order to provide some important policy implications for nominal convergence and real convergence for the EU as a whole, HAC was performed, which enabled deriving the clusters of the countries with similar characteristics. According to those characteristics, the policy recommendations were formulated for each such cluster, with the aim of narrowing the differences across the EU Member States in the future.
2. Literature review
Solow’s scientific contributions (Citation1956) were used intensively in discussing the issues concerning convergence. In time, the hypotheses of the neoclassical growth model were relaxed, and new models were developed, such as endogenous growth theory (Lucas, Citation1988; Rebelo, Citation1991; Romer, Citation1986), the neoclassical growth model based on the β and σ indicators (Acemoglu, Citation2009; Barro & Sala-i-Martin, Citation2004; Sala-I-Martin, Citation1996), the augmented dynamic neoclassical model (Mankiw et al., Citation1992; Bassanini and Scarpetta, 2001), the stochastic convergence model (Lee et al., Citation1997).
The findings of existing studies on EU convergence were significantly different depending on the applied methodology and models, the analysed period or the considered convergence indicators. The previous studies analysing period before and after global economic crisis have found that the nominal convergence prevailed before the crisis erupted, while in the real convergence area, there were large differences among Western and Eastern European countries (regarding GDP per capita or current account balance) (Berger & Nitsch, Citation2010; Cavenaile & Dubois, Citation2011). Some other studies have affirmed there was no permanent nominal and real convergence in the EU area (Diaz del Hoyo et al.; 2017; Franks et al., Citation2018), but there was a nominal and real convergence in the CEE area, although after the 2008–2009 crisis, the real convergence path slowed down in this region (Alcidi et al., Citation2018; Burian & Brčák, Citation2014; Deichmann et al., Citation2017; Forgó & Jevčák, Citation2015; Isarescu, Citation2015). Simionescu-Bratu (Citation2014), Albu (Citation2012), Durkalic et al. (Citation2019), and Kónya (Citation2020) have demonstrated a convergence of the GDP per capita and unemployment rate in the EU. Therefore, the results are mixed.
However, the findings presented above have stated that CEE area achieved real convergence and the entire EU area convergence relied on the significant economic growth of the CEE area. Ioan et al. (Citation2020) have demonstrated that CEE economies have achieved strong saving and capital formation convergence in order to achieve higher economic growth. High trade openness, solid financial and banking sectors, and large FDI inflows supported the steady economic growth of the CEE economies before the crisis, but also during and after global economic crisis. Popescu et al. (Citation2019) have demonstrated that CEE economies’ robust economic growth had an extensive character, based on a large consumption of inputs, during the entire period until the current pandemic. However, the current pandemic and the world uncertainty have negatively impacted on FDI net inflows on the emerging markets and that may affect the growth prospects in the CEE region, too (Ho & Gan, Citation2021). The countries with higher trade openness and relying on the tourism sector will experience the sharper and long-lasting drops of their GDP, during the pandemic. Under the pressure of crisis and fearing of the social disturbances, countries with subtle protection techniques do their best to protect their economies, especially the non-euro countries (Kitanovic & Krstic, Citation2010) and that can affect the prospects of EU convergence process in the near future, just like it happened during the last financial crisis of 2008–2009.
Taking into account that the papers related to the analysis of convergence processes in EU are numerous and differ significantly, summarize the studies focused on the nominal and real convergence of the EU countries, according to the analysed sample of countries, the considered period, the applied methodology and the achieved results.
Table 1. The presentation of previous convergence studies and their results.
The methods mostly used to study convergence within the EU area are regression, namely panel regression for analyzing σ-convergence and β-convergence among the EU countries. Some studies have used cluster analysis and the entropy method, but none of the previous studies combined these two methods. The fact that the largest number of the foregoing studies focused on the real convergence process in terms of the GDP per capita/the real GDP growth and unemployment rates, whereas only a small number of them analyzed nominal convergence, should also be made a mention of.
In that sense, the contribution of this paper reflects in the fact that it deals with both nominal convergence and real convergence, compares the effects of the emergence of the global economic crisis and the pandemic crisis, and is one of the rare papers dedicated to the analysis of convergence at the EU, the NMS and the OMS levels. The entropy method was selected because large number of convergence indicators was investigated. Usage of some type of regression would require larger data sets, which will arise problem of data availability, during pandemic, which is quite new. There would also be some problems to compare the results achieved on very short-data series specific to the current pandemic (this crisis being in full development for the moment), with the results achieved for the global financial crisis based on much longer data series.
Based on the previously presented literature and the aims of the study, the following hypotheses are derived:
H1. The pandemic crisis has led to higher nominal divergence in the EU than the global economic crisis did in terms of the budget balance.
H2. The pandemic crisis has led to higher nominal divergence in the EU than the global economic crisis did in terms of the inflation rate.
H3. The pandemic crisis has led to higher nominal divergence in the EU than the global economic crisis did in terms of the public debt.
H4. The pandemic crisis has led to higher real divergence in the EU than the global economic crisis did in term of the current-account balance.
H5. The pandemic crisis has led to higher real divergence in the EU than the global economic crisis did in terms of the unemployment rate.
H6. The pandemic crisis has led to higher real divergence in the EU than the global economic crisis did in terms of the GDP per capita.
The period from 2004 to 2020 was covered so as to take into account the conditions in the precrisis period (which significantly affected convergence during the crisis itself) and also to consider the assumption that in order for the Shannon entropy to be applied, data should be continuous.
3. Data and methodology
Bearing in mind the fact that the paper is aimed at investigating the differences among the EU countries, the data about some nominal and real convergence indicators were used and analyzed using the entropy method and cluster analysis.
3.1. Data
International institutions published the projections for some indicators for the year 2020 in order to give a rough picture of future trends in the pandemic crisis conditions. At the moment, these indicators are the most accurate and the most realistic (because they are calculated based on an appropriate set of data retrieved from national statistical offices). The International Monetary Fund is one of the international institutions that have published their projections for the year 2020 most recently. presents the IMF indicators of the nominal convergence and the real convergence considered in this paper.
Table 2. IMF nominal and real convergence indicators.
Although there are more indicators of real convergence in the existing literature, the considered indicators are those available now representing the most recent update of the macroeconomic projections for all the EU countries.
3.2. Methodology
In this paper, the entropy method is used to measure differences among the EU countries according to the indicators taken into consideration and the cluster analysis in order to identify an appropriate group of the EU countries with a similar macroeconomic situation.
3.2.1. The Shannon entropy index
The enormous success of the Shannon entropy theory – information theory (Shannon, Citation1948) gave the impetus for the development of the various applications of the entropy concept in other sciences. One of them is economics, where this concept was used so as to enable an investigation into numerous important topics in economics. The entropy method, however, was most commonly used in regional development analysis (Bouvet, Citation2010; Cutrini, Citation2009; Czyż & Hauke, Citation2015; Liang et al., Citation2017; Salois, Citation2013; Villas-Boas et al., Citation2019).
The methodology used by Czyż and Hauke (Citation2015), who analyzed the differences in the development of the regions in Poland during the period from 2005 to 2012 is the basis for measuring nominal convergence and real convergence among the EU economies in this paper. To calculate those differences, they applied the Shannon entropy index. Bearing in mind the fact that the EU represents the regional integration focused on achieving harmonized development and cohesion, the authors concluded that a similar approach could be applied at the EU level. The advantage of this measure reflects in the fact that its calculation takes into account the number of the EU Member States in each year without exerting an influence on the obtained results.
In order to apply the entropy method following the approach of Czyż and Hauke (Citation2015), certain nominal indicator data adjustments should be made. Taking into account the fact that some of the applied indicators have negative values (the current-account balance, the inflation rate, and the budget balance) and the fact that only a positive real number can be used as the base in the logarithm calculation used within the framework of the entropy method, all the negative values of the indicators should be ‘moved’ into the positive area without changing the differences among the EU countries. The zero values of the indicators should be avoided as well.
The adjustment was made by adding appropriate value to the data about the indicators for all the countries. The calculation of that corrective value was made using the following formula:
(1)
(1)
where
Δx is the corrective value, and
is the minimum value of the considered indicator for all the countries during the entire period of observation.
Of course, this formula was only used for those indicators where the negative values were recorded.
Once these adjustments are made, the Shannon entropy index is calculated in the following manner: firstly, the fact that the Shannon entropy measures the amount of uncertainty about the event with an appropriate probability distribution should be pointed out. In this paper, the mentioned ‘events’ are the convergence indicators, and they are marked by x. The information obtained from the appearance of a certain event is determined by monotonically decreasing the function with the probability p, which can be represented by log 1/p = - log p. For a series of events with the probabilities
the following can be defined:
(2)
(2)
where
represents a certain convergence indicator for the country i, where i = 1, 2 … n.
The entropy measure is the expected value of this series that can be represented as:
(3)
(3)
or
(4)
(4)
The fact that the use of the logarithm function with the base 2 implies the measurement of information in bits should be emphasized.
According to Czyż and Hauke (Citation2015), the presented formula for the calculation of the Shannon entropy has the following characteristics:
H(x) ≥ 0, i.e., it is a positive value,
H(x) assumes the value of 0 with
for the chosen i, indicating the absence of uncertainty among the indicators, and
H(x) assumes the highest value equal to
Based on the entropy indicator H(x), the Shannon entropy index I(x) is developed and used as the measure of divergence among the EU countries according to the considered convergence indicator x. The Shannon entropy index I(x) is calculated as follows:
(5)
(5)
where
shows the total equality, while
denotes the maximum inequality.
3.2.2. Cluster analysis
To perform a more comprehensive analysis of convergence among the EU Member States, Hierarchical Agglomerative Clustering (HAC) was used. Cluster analysis (CA) allows the classification of the countries with respect to the ‘similarity/dissimilarity’ of the selected macroeconomic indicators.
To classify N objects, agglomerative hierarchical clustering procedures start with the N clusters called ‘singleton clusters’, each of which contains a single object (one country in this case of ours). In the first stage, the two most similar singleton clusters, the two similar objects, are merged. Stage by stage, the algorithm searches the two most similar clusters and merges them until one big cluster agglomerates all the objects.
The Ward method (as the agglomerative algorithm frequently used in the case of interval-type variables) was applied to the clustering of the EU Member States with respect to their convergence with the EU average (Bacher, Citation2002). The Ward method, also called the Ward Minimum Variance (WMV), merges two clusters by simultaneously minimizing the total within-cluster variance, on the one hand, and maximizing the between-cluster variance, on the other. Practically, the Ward method requires the squared Euclidean distance (SED) as the measure of ‘dissimilarity’. Dissimilarity measures how different countries are from one another.
A dissimilarity matrix containing all SEDs computed for each pair of objects is the first output of the Ward method computed in the initial stage. For the two objects (the single-object clusters) noted i and j, and the p variables X1, X2,…, Xp., SED is computed by applying the following formula:
(6)
(6)
where
is the data observed for the object i, and
is the data observed for the object j.
As an agglomerative hierarchical procedure, a new cluster is formed in each next stage, which minimizes the total within-cluster variance. After a new cluster is obtained, dissimilarities are recomputed (Bacher, J. 2002) by using the following formula:
(7)
(7)
where
is the dissimilarity between the new cluster (p + q) and the cluster i,
is the dissimilarity between the cluster p and the cluster i, and
is the dissimilarity between the cluster q and the cluster i.
The computed distances between clusters are based on the analysis of variances (ANOVA), because of which fact the Ward method has broadly been used in HAC since its introduction (Randriamihamison et al., Citation2020).
Given the fact that certain input variables have a larger magnitude of variations while the others have negative values or outliers, and given the fact that the Euclidean distance is susceptible to such differences, all the input data were standardized by being rescaled between 0 and 1 using the z scores calculated according to the following formula, all in order to avoid the impact of these variations on the clustering results:
(8)
(8)
Given the fact that it is one of the best performing techniques for equalizing the size or the magnitude and the variability of the input variables, it is independent of the used clustering method as well (Milligan & Cooper, Citation1988).
A dendrogram, i.e., a tree-based graphic presentation of the agglomeration schedule where the horizontal axis represents the distance (or the dissimilarity) between the clusters and the vertical axis represents the objects and the clusters, is the main output of the hierarchical cluster analysis. It provides the initial insight into how the objects/clusters were merged and which algorithm stage they are in. Given the fact that the Ward method, like all agglomeration methods, generates several cluster solutions, a dendrogram enables the analyst to determine the number of clusters by taking into consideration a relatively low aggregation limit distance on the axis. Because the computation process is complex, the HAC procedure was performed by using the IBM SPSS v.20.
4. Results and discussion
The application of the presented methodology enabled the calculation of the Shannon entropy index for all the Member States, both the NMSs and the OLSs, during the period from 2004 to 2020. In order to gain a deeper insight into the convergence processes, the obtained value of the Shannon entropy index should be analyzed in parallel with the EU average, because differences among countries may decrease as a result of either the worsening or the improvement of the state in the majority of the countries.
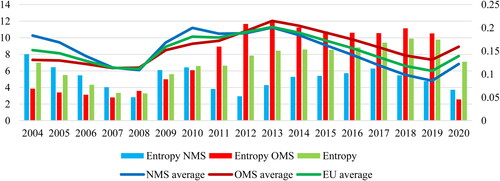
The results of the entropy method for the nominal convergence indicators are presented first. In , the Shannon entropy index and the average budget balance (as % of the GDP) are presented.
Figure 1. The Shannon entropy index and the average for the budget balance (as % of the GDP). Source: The authors’ calculations.
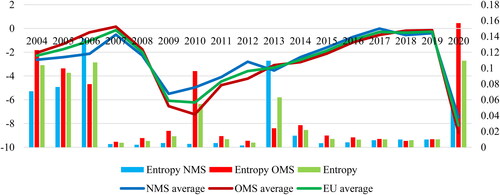
According to the results presented in , it can be concluded that the differences among the EU Member States were much bigger in 2020 than they had been in 2008. Such bigger differences were, to a great extent, a result of the divergence among the OMS. Taking into account the fact that such bigger differences are followed by an increased budget deficit in all the member states, it implies that the divergence process is a result of the extreme growth of the budget deficit in several Member States – namely Belgium, France, Italy, and Spain. The fact that the largest number of the OMSs had a budget deficit exceeding that of the EU average (namely Austria, Belgium, France, Greece, Spain, Italy, the Netherlands, and Portugal), whereas in the group of the NMS it is only Malta, Poland, the Slovak Republic and Slovenia that had a budget deficit higher than the EU average. On the contrary, the significantly lower differences seen in 2008 were a result of a low average budget deficit at the EU, the NMS and the OMS levels, which fact indicates that the largest number of the EU countries had a low budget deficit in 2008. This implies that the COVID-19 pandemic crisis has hampered nominal convergence in terms of the budget balance more than the economic and financial crisis of 2008 did, which proves the hypothesis H1. After 2008, however, there were only two episodes of pronounced divergence – the one in 2009 and the other in 2013, contrary to which Diaz del Hoyo et al. (Citation2017) and Ferreiro et al. (Citation2017) demonstrated in their studies that, after the period of convergence in the EA-12, divergence in the budget deficits was recorded in the post-crisis period. The obtained results are more in line with the results obtained by Forgó and Jevčák (Citation2015), who proved that the budget deficits had been divergent before the crisis of 2008, but only started to converge after the crisis due to the improvements in the CEE 10, which was not only true for the year 2013, when the big differences were a result of the big differences among the NMSs.
The inflation rate is the next nominal convergence indicator. The value of the Shannon entropy index and the average inflation rate are presented in .
Figure 2. The Shannon entropy index and the average for the inflation rate (in %). Source: The authors’ calculations.
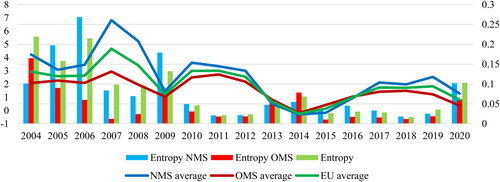
The value of the calculated entropy presented in is indicative of the fact that the differences in the year 2020 were almost slightly bigger than those in 2008. Hypothesis H2 was proven. In contrast to hot demand in 2008, the current crisis was followed by greater supply than demand, and the occurrence of deflation in some countries. In a similar fashion, Forgó and Jevčák (Citation2015) proved that the inflationary gap among the EU economies had decreased after the crisis of 2008, but they identified a significant difference in the price level between the CEE and the EA12. Franks et al. (Citation2018) also proved the existence of inflation divergence in the EU12 before 2008, whereas the convergence process at the EU level started after 2009, due to the inflation convergence of the new members of the Euro area. It can be noted that the differences among the EU economies were significantly smaller during the period from 2010 to 2019 than during the period from 2004 2009, which can also be explained by an increasing number of the Eurozone members. The decreasing trend of the differences among the EU countries in terms of inflation was stopped by the current pandemic. Namely, as suggested by Leandro and Jimeno (Citation2020), the lockdown and the sharp consumption decrease caused deflationary pressures worldwide. So was the case in the EU as well. It can be noted that the big differences at the EU level in 2020 were to a great extent a result of the bigger differences among the NMSs. Some NMS, such as the Czech Republic, Hungary, Poland, Romania, Lithuania, Latvia, and Slovenia, had significantly higher inflation than the EU average. In the group of the OMSs, there are also the countries like Austria, Finland, and the Netherlands that had the inflation higher than the EU average. Taking into account the fact that the slightly bigger differences in 2020 were accompanied by a significantly lower average inflation rate, it can be concluded that the majority of the EU economies recorded a low inflation rate, which to a great extent is a result of improved price stability in the NMSs, taking into consideration the fact that the average inflation rate in this group of the countries was much lower in 2020 in comparison with that in the year 2008.
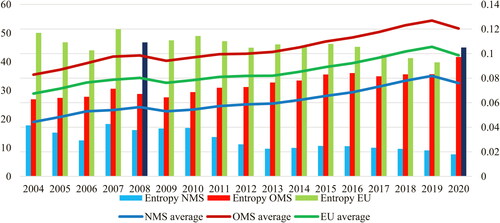
The gross debt is the last nominal convergence indicators considered in this research study, so the Shannon entropy index and the average for this indicator is presented in .
Figure 3. The Shannon entropy index and the average for the gross debt (as % of the GDP). Source: The authors’ calculations.
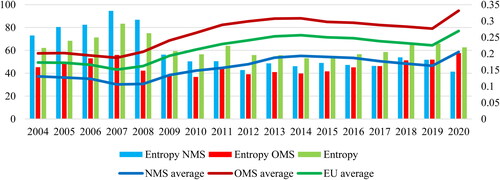
The situation in this area is different to a certain extent than it is the case in the previous two indicators, taking into consideration the fact that the differences in the gross debt in the year 2020 were smaller than they had been in 2008, thus indicating that Hypothesis H3 was not proven. The fact that bigger differences were followed by an increase in the average EU gross debt, which is also a result of the higher value of this indicator in the OMSs, especially in Belgium, France, Italy, Greece, Spain, and Portugal, should also be noted. The extremely high gross debt in the mentioned countries resulted in the bigger differences among the OMSs than in the NMSs, where only Cyprus had a significantly higher gross debt in comparison with the other economies in this group. Contrary to the year 2020, the big differences among the EU member states in 2008 were predominantly a result of the more pronounced differences among the NMSs. Even in 2008, however, the average gross debt was much higher in the OMSs than in the NMSs, thus indicating that the majority of the OMSs had had a high gross debt since (and even before) 2008. As a result of the sovereign debt crisis that followed the financial crisis of 2008, the differences among the EU countries further had decreased in terms of the public debt until the year 2016, when the debt began to grow. Odendalh and Springerford (Citation2020) proved significant divergence in the public debt, emphasizing the fact that the Southern Member States were especially hit by the crisis because their higher debt levels would hamper the recovery, so their governments had problems to finance the increased costs caused by the COVID-19 pandemic. These differences can also be explained by the results obtained by Gräbner et al. (Citation2020a, Citation2020b), who emphasized the fact that the Southern EMU members had followed the debt-led growth model, which resulted in the accumulation of the public debt in those countries.
In the real convergence field, the first considered indicator is the current-account balance, which is a very important indicator, especially so during the crisis. In that sense, the Shannon entropy index and the EU average for this indicator are presented in .
Figure 4. The Shannon entropy index and the average for the current-account balance (% of the GDP). Source: The authors’ calculations.
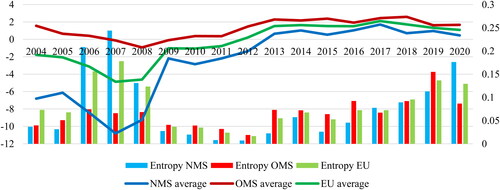
The results presented in are very interesting. The differences among the EU economies in 2020 were slightly bigger than in 2008, which highlights the fact that Hypothesis H4 has been proven. Worthy of noting is the fact that those bigger differences in 2020 were followed by a low average current-account surplus, which was a result of recording the surpluses in 17 out of the 27 EU countries in 2020, those surpluses being especially high in Denmark, Germany, Lithuania, Malta, and the Netherlands. Although Sivrikaya and Kurul (Citation2020) predicted that Austria, Denmark and Germany would not continue to record surpluses, those countries recorded surpluses in 2020. Due to the lockdown, the closing of the borders and the other anti-pandemic measures, most of those surpluses were recorded as a result of the trade balance surplus, while services did not contribute to the surpluses as they had in previous years (Eurostat, Citation2020). On the other hand, almost the same differences among the EU economies in 2008 were followed by a high EU average current-account deficit, mainly being a result of the high current-account deficits in the NMSs. Although Franks et al. (Citation2018) pointed out the fact that the divergence in terms of the current-account balance among the EMU members had been much pronounced before the crisis of 2008, the bigger differences at the EU level of the year 2006 were predominantly a result of the divergence amongst the NMSs. In 2008, the majority of the NMSs recorded high current-account deficits due to the global economic crisis (especially in the small open economies such as the Baltic States), which resulted in a high average deficit and an increase in the differences. The sudden stopping of external financing during the crisis of 2008 determined a rapid contraction of the external imbalances of the current account, mainly in the CEE region that had received a large share of capital inflows before 2008.
Achieving a satisfactory level of employment and narrowing the gap among the EU economies in this regard is a very important aspect of real convergence. Hence, the next indicator is the unemployment rate, which is the indispensable data used in the real convergence analysis. The Shannon entropy index and the EU average for the unemployment rate are presented in .
Figure 5. The Shannon entropy index and the average for the unemployment rate (in %). Source: The authors’ calculations.
points out the fact that the differences among the EU countries in 2020 will be significantly bigger than in 2008, indicating that Hypothesis H5 has been proven. The EU average in 2020 was higher in comparison with that in 2008, which is indicative of the fact that divergence in the unemployment rate was a result of the extremely high unemployment rates in several EU countries. Taking into account the fact that the OMSs’ average is significantly higher than the NMSs’ average and that the differences among the OMSs are much less pronounced, a conclusion can be drawn that the OMSs (Greece, Italy and Spain) contributed to divergence the most. Those countries have been facing a severe unemployment problem, especially so after the sovereign debt crisis of 2010, when sharp austerity measures led to a substantial drop in employment (particularly in the public sector). The global economic crisis of 2008 did not have such a high influence on the differences among the EU economies when employment is concerned. The differences among the Member States were significantly smaller and the EU average was lower. The fact that divergence among the NMSs in 2008 was slightly less pronounced than that in the OMSs, which is in line with the results obtained by Franks et al. (Citation2018) and Durkalic et al. (Citation2019), is worth being emphasized. They found that the unemployment had converged in the EA12 and the EU before the crisis of 2008. they, however, noticed a significant divergence trend after the crisis. The results are contrary to those obtained by Kónya (2020) that provided strong support to unemployment convergence in the EU during the crisis and in the postcrisis period. They also indicated that the NMS countries as a group had tended to catch up more with the OMSs than with each other, which is not case in this study, considering that the differences among the NMSs were significantly smaller than those across the OMSs in the postcrisis period.
Finally, the last considered indicator is the GDP per capita PPP, without which no serious study of real convergence can be imagined at all. The average value of this indicator and the calculated Shannon entropy index are presented in .
Figure 6. The Shannon entropy index and the average for the GDP per capita PPP. Source: The authors’ calculations.
The indicators presented in indicate that the differences among the EU economies in 2020 were slightly smaller in 2020 than in 2008, according to which fact a conclusion can be drawn that Hypothesis H6 has not been proven. The divergence trend is to a greater extent a result of the differences among the OMSs, taking into consideration the fact that the differences among those countries were significantly bigger than those for the NMSs. The obtained results are in line with the results obtained by Bisciari et al. (Citation2020a, Citation2020b). They suggested that the divergence process in the OMSs would be taking place during the years from 2019 to 2021, whereas the CEE economies would be by characterized by greater resilience to the Covid-19 crisis. The fact that the EU average was much higher in 2020 than in 2008 and that, as in 2008, it was a result of a higher GDP per capita in the OMSs, should be highlighted. It is, however, worthy of noting that the differences among the NMSs were much less pronounced in the postcrisis period, thus indicating the convergence process among those economies. In a similar fashion, Alcidi et al. (Citation2018) also found the GDP per capita convergence for the CEE countries during the postcrisis period, but a divergent path from the EU core southern countries against the EU northern countries during the crisis and the postcrisis period. Diaz del Hoyo et al. (Citation2017), Durkalic et al. (Citation2019) and Celi et al. (Citation2020) proved a stronger GDP convergence for the NMSs before the crisis as a result of the catching-up process, that convergence having slowed down during and after the financial crisis of 2008, which caused divergence in the EU in terms of the GDP per capita. The NMSs had regained their solid growth rates a few years before the pandemic and were unable to catch up with the OMSs, whereas the European southern countries among the OMSs diverged from the rest of the group. Odendalh and Springerford, (Citation2020) found greater divergence just before the pandemic among the EU Member States because the Southern European countries had been underperforming for a long time and because of a significant decrease in net investments after the crisis of 2008. Their results are just the opposite to ours that indicate a higher convergence before pandemic comparing to 2008.
Taking into account the fact that the results are mixed and that, both in the group of the NMSs and in the group of the OMSs, there are outliers in the considered convergence aspects, it is necessary to identify the groups of the countries with similar characteristics and define proper measures for each one of them so as to overcome the pandemic crisis, speed up recovery and come to a satisfactory convergence level at the EU level. For this purpose, a HAC-based cluster analysis was performed. Beside the EU countries, the EU (27) average is also included in the database as one of the considered cases in order to define the group of the countries that are the most similar to the EU average. presents the dendrogram generated by performing the HAC algorithm.
Figure 7. Dendrogram obtained by hierarchical clustering (using Ward's method). Source: The authors’ calculations.
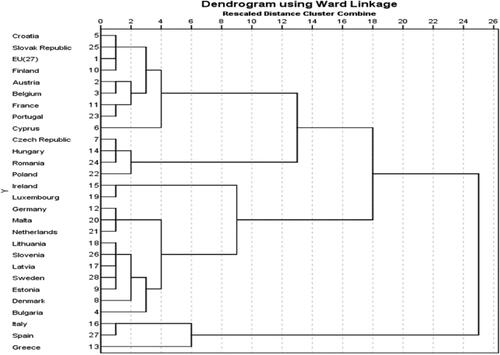
The dendrogram presented in suggests a total of five cluster solution for a relatively small aggregation limit distance until the point 9 on the axis. Starting from the top of the dendrogram, the most similar countries are Croatia and Slovakia, closest to the EU27 average and Finland. France and Portugal share some proximity to Austria and Belgium, enough to merge them with the first group until point 3 on the axis. Cyprus is fairly similar with these small groups to form cluster 1 together with them until point 4 on the axis. In some way, these countries significantly rely on the hospitality and tourism sectors (and even transportation) that were most affected by the current pandemic, so they have experienced a sharp decline of GDP, an increase of unemployment and high current account deficits, but also an increase of gross debt and budget balance because of the extensive adopted measures aimed to support companies and employees in these sectors. Cluster 3, including Czech Republic, Hungary, Poland, and Romania, merges with cluster 1 in one of the next stages of the algorithm, so these countries can be considered relatively close (similar) by the EU(27) average. Cluster 2, the largest one, contains 12 countries: Germany, Malta, Netherlands, fairly closely to Lithuania, Slovenia, Latvia, Sweden, Estonia, Denmark, and Bulgaria. This cluster merges with cluster 5 at the next stage of aggregation. Cluster 4 contains together Spain, Italy and Greece, the last two countries presenting outliers values for several considered variables. Greece is someway an outlier for the cluster because it merges with it arbitrarily, at the last, and at a high distance. The entire cluster 4 merges with the others in the last stage of aggregation being very dissimilar from the other clusters, so the three countries, all of them OMS are the most divergent with EU average. Cluster 5, contains Luxembourg and Ireland, the two countries with very high values of GDP per capita comparing with all other.
Based on the clusters presented in the dendrogram () the countries are grouped and the average values of all the indicators for each cluster are presented, which gives a rough picture of the characteristics of the clusters and the main differences among them.
Table 4. Average values of observed indicators for derived clusters.
In order to identify the most influential factors of such a cluster structure, one-way ANOVA with ƞ2 (eta squared) was applied and the results are given in . The F values specify which variables separate the clusters best, and eta squared specifies the size of their effect.
Table 3. ANOVA with eta squared report.
The results presented in show that, according to the F values, Inflation (INF) was the factor with the biggest influence on the cluster formation, only to be followed by the Gross Domestic Product Per Capita (GDP), the Gross Debt (GD), and the Unemployment Rate (UNEMP). Their respective contributions to the separation of the five clusters are statistically significant (p < 0.005). The Current-Account Balance (CB) are statistically significant, too, but exert a much smaller influence. The eta squared values (which should be >0.5) confirm the influential role of the mentioned indicators in the countries’ cluster membership, and amount to 0.792, 0.755, 0.736, 0.716, and 0.573 (the last being the medium size of the effect) for INF, GDP, GD, UNEMP, and CB, respectively. Only for the Budget Balance (BB), the differences between the means of the clusters are not statistically significant, the eta squared value indicating a small influence (0.450).
In order to identify the characteristics of derived clusters the average values of indicators for each cluster are presented in .
According to the results presented in , the main characteristics of the formed clusters are derived and accounted for in . The characteristics are derived according to the Maastricht criteria for nominal convergence indicators and the comparison of the cluster average with the EU average for the real convergence indicators. Taking into account the fact that the Harmonized Index of Consumer Prices (HICP) was not used as an inflation indicator (because of its unavailability) and that some values are negative, shows whether a country records inflation or deflation. A similar situation is with the Current-Account Balance, where a deficit or a surplus is marked as the characteristics of the cluster.
Table 5. The structure of clusters and their characteristics.
indicates the presence of significant differences among the derived clusters, thus indicating their different responses to the pandemic crisis, as well as their macroeconomic conditions in the previous period. The most affected are the countries from Cluster 4, which were faced with serious macroeconomic problems in the last decade, jeopardizing the convergence process. After the sovereign debt crisis that took place in 2010, those countries have not managed to stabilize their macroeconomic performances. The two of them (Italy and Spain) had been faced with the severe health crisis that made the situation even worse during 2020. On the other hand, the least affected were the countries from Cluster 5. Those small open economies with a much less pronounced health crisis managed to stay relatively stable during 2020.
5. Conclusion and policy implications
The results obtained in this study indicate that COVID-19 will significantly force further economic divergence within the EU in the future if appropriate measures both at the EU level and at the national level are not implemented. The entropy method employed in this study suggests that, in many aspects (namely inflation, the budget balance, the current-account balance and the unemployment rate), the differences among the EU economies were bigger in 2020 than in 2008, when the global economic crisis occurred. One of the interesting results is also the fact that the differences in the gross debt were smaller in 2020 than in 2008, which, however, is a result of the worsening situation in public finance in all the countries, especially in the OMSs. Apart from Italy, Spain, Greece, and Portugal, which have been faced with the indebtedness problem for one whole decade, Belgium, France, and Austria were the OMSs with the average gross debt greater than the EU average gross debt. As for the GDP per capita, the differences were also slightly smaller in comparison with the year 2008. The EU average, however, was much higher in 2020 than in 2008, indicating that the almost unchanged level of differences was a result of the catching-up process in some NMSs, such as Cyprus, the Czech Republic, Estonia, Lithuania, Slovenia, and Malta.
Bearing in mind the fact that as many as five clusters were derived using HAC, it can be concluded that the differences among the EU countries are still present and that the European Commission should adjust the measures to the conditions in a particular group of countries so as to ensure nominal convergence and real convergence in the future. The obtained results provide a good basis for defining certain policy implications for the derived clusters. Taking into account the fact that the Cluster 2 and Cluster 5 countries are in a more favorable position and the fact that they have remained relatively stable during the crisis, appropriate measures should be formulated for the countries from the remaining three clusters.
Greece, Italy, and Spain (Cluster 4) will be in the most unfavorable position, considerably contributing to a higher divergence level among the EU economies. To fight against the COVID-19 pandemic, the governments in the mentioned countries have increased public spending, which has further hampered their already weak public finance. Additional public expenditures (such as medical resources, saving jobs, subsidizing SMEs) and foregone revenues (such as the cancellation of some taxes and social security contributions) immediately led to the budget balance deterioration without any direct compensation later. When economic conditions allow it, the mentioned countries should pursue the fiscal policies aimed at achieving prudent fiscal positions and ensuring debt sustainability. Taking into consideration the fact that reliance on the monetary policy alone to respond to shocks might not be efficient enough, the fiscal policy needs to play a crucial role. After the financial crisis of 2008, the structural changes that were necessary so as to avoid future crises have not implemented, which has resulted in raising financial non-transparency and growing inequality during the current crisis. Progressive capital taxation is one possible solution to the said problems. Taxation is a much fairer and much more efficient solution than the other government expenditures financed by borrowing. The worst solution in terms of fairness and efficiency is an extended austerity course, which exactly is the policy having been applied in Europe as a cure for overcoming the crisis in 2008. Those countries are characterized by high unemployment and the major problem they are being faced with is the fact that they considerably rely on labor-intensive activities, such as tourism, which is among the most affected sectors. Although those countries have already introduced programs intended to reduce labor costs for the companies that have ceased their business operations or the companies that have been hit hard by the crisis, the measures such as the protection of employment contracts, the provision of income support to the affected workers, and the implementation of a comprehensive part-time job program wherever it is possible would be a more sustainable and flexible solution. Such a program would allow companies to apply modulated worktime reductions according to the level of the business activity, simultaneously preserving the normal working of the economy. It is especially important for Greece, taking into consideration the fact that this country has been facing the unemployment problem for over one whole decade now.
The fact that a sharp increase in the unemployment rate as a result of the crisis will burden the already limited capacities of social services and employment services in providing support to workers and employers in the mentioned countries should also be taken into account. The extension of the spectrum of available flexible working models and the revision of the incentive system for a better promotion of the sustainable forms of employment would contribute to the maintenance of the economic activity and jobs during the periods of the restricted movement of people and goods. To this end, the adoption of the digital technologies in enterprises that would offer alternative ways of working and provide digital services could be a good solution as well.
Increasing investment in order to stimulate growth in the priority sectors will be crucial for supporting sustainable growth and employment. It will be important to promote private investment, bearing in mind the fact that public investment funds are limited. With the interest rates at a very low level in the considered economies, the scope for further interest rate cuts is also limited. Central banks, however, may intensify using unconventional monetary policy tools such as large-scale asset purchases to obtain additional support to the private investment activity. As far as public investment projects are concerned, the government should prioritize the implementation of the already developed public investment projects and use private-public partnerships wherever possible.
The Cluster 4 countries are faced with yet another, additional problem of being at a risk of deflation. Namely, in addition to causing a deep recession, the crisis is also creating a massive slack in goods (the unused capacity of fixed assets) and labor markets (mass unemployment), driving a price collapse in the commodities such as oil and industrial metals at the same time. Deflation will increase the risk of insolvency. In the short run, the governments of the mentioned countries will need to run monetized fiscal deficits so as to avoid depression and deflation. Otherwise, they will be faced with stagflation in the long run.
It should be noted that the Cluster 3 countries will face a low level of the economic activity in comparison with the EU average, relatively high inflation and a current-account deficit. These countries, however, have relatively favorable macroeconomic conditions according to the remaining convergence indicators, so they have a broader spectrum of measures to boost the economic activity. Their gross debt level gives them the possibility to use more flexible fiscal measures, such as rules-based fiscal stimulus measures. They are particularly effective when interest rates are at their lower bound (so that they cannot be cut further) and the lags of the discretionary fiscal policy measures are too long. Even more so, after the occurrence of demand shocks, a fiscal stimulus should especially be effective in the case when the economy’s resources are unemployed, and the monetary policy is flexible. Such fiscal rules will prepare those economies for future shocks, given the fact that they are highly effective and more timely than discretionary fiscal measures and monetary policy measures in the case of extremely low interest rates. Although designing and adopting these measures require time and political agreement, they can markedly decrease the likelihood of the occurrence of a demand-driven recession in the future.
Although the Cluster 1 countries are characterized by low inflation and have the GDP per capita, employment and the budget balance close to the EU average GDP per capita, employment and budget balance, they are faced with high gross debts and high current-account deficits. So, they should also implement the mentioned measures aimed at decreasing indebtedness. Those countries rely on tourism to a great extent, so it is not surprising at all that these countries are faced with a current-account deficit. So, the current account will be balanced when travel bans and lockdowns are abolished. In the short run, they should promote and support merchandise export through intensified trade liberalization, the adjustments of exchange rates (in non-EMU countries), the introduction of the exemption of reinvested earnings from the tax base in order to increase productivity in industry, the implementation of structural reforms (before the whole privatization and deregulation) so as to increase the efficiency and competitiveness of the economy through lower costs and so on, with the intention to neutralize the effect of lower tourism exports.
All of the foregoing measures should lead to improvements in the countries badly hit by the pandemic crisis and their catching up with the Cluster 2 and Cluster 5 countries. The European Commission and the other EU bodies, however, should promote solidarity among the EU Member States through the allocation of the cohesion fund 2021–27 and the other cohesion measures that will enable a balanced development of the EU Member States.
A major limitation of this study is that the paper has analyzed the convergence in terms of 3 nominal convergence ratios and 3 real convergence ratios, it hasn’t considered all the nominal and convergence ratios. Further research could aim to analyze the convergence in terms of long-term bond interest rates, labor productivity or trade openness. Another limitation is represented by the short period of time analyzed during the current pandemic which is a crisis in process, with unexpected shifts and consequences. A direction for a further research could be the analysis of a longer period of time for the pandemic crisis and this could allow different methodological approach, such as a panel analysis for the effects of the pandemic on the real and nominal convergence in the EU area.
Data sharing/availability
Datasets are available accessing the links indicated in .
Disclosure statement
Authors declare no conflict of interests.
Funding
This research received no funding.
References
- Acemoglu, D. (2009). Introduction to modern economic growth. Princeton University Press.
- Albu, L. L. (2012). Structural convergence in European Union. Annals of the “Constantin Brâncuşi” University of Târgu Jiu, Economy Series, 4, 2–15.
- Alcidi, C., Ferrer Nunez, J., di Salvo, M., Musmeci, R., & Pilati, M. (2018, January). Income convergence in the EU: A tale of two speeds. CEPS Policy Brief. Retrieved May 4, 2020, from https://www.ceps.eu/download/publication/?id=10394&pdf=ConvergencePDF.pdf
- Bacher, J. (2002). Cluster analysis. Script. Nuremberg. https://www.clusteranalyse.net/sonstiges/zaspringseminar2002/lecturenotes.pdf
- Barro, R. J., & Sala-i-Martin, X. (2004). Economic growth (2nd ed.). Massachusetts.
- Bassanini, A., & Scarpetta, S. (2003). The driving forces of economic growth: Panel data evidence for the OECD countries. OECD Economic Studies, 2001(2), 9–56. https://doi.org/10.1787/eco_studies-v2001-art10-en
- Berger, H., & Nitsch, V. (2010). The euro’s effect on trade imbalances. IMF Working Papers, 10(226), 1–30. https://doi.org/10.5089/9781455208913.001
- Bisciari, P., Essers, D., & Vincent, E. (2020a). Does the EU convergence machine still work? National Bank of Belgium Economic Review. Retrieved January 31, 2021, from https://www.nbb.be/doc/ts/publications/economicreview/2020/ecorevi2020_h2.pdf
- Bisciari, P., Essers, D., & Vincent, E. (2020b, May). Does the EU convergence machine still work and how will the Covid-19 crisis will impact it? SUERF Policy Note no. 172. Retrieved February 1, 2021, from https://www.suerf.org/docx/f_a7d4c5e52848263151f75565644e7367_14129_suerf.pdf
- Bouvet, F. (2010). EMU and the dynamics of regional per capita income inequality in Europe. The Journal of Economic Inequality, 8(3), 323–344. https://doi.org/10.1007/s10888-010-9129-0
- Briceño, H. R., & Perote, J. (2020). Determinants of the public debt in the eurozone and its sustainability amid the Covid-19 pandemic. Sustainability, 12(16), 6456. https://doi.org/10.3390/su12166456
- Burian, S., & Brčák, J. (2014). Convergence process in the European region – Cluster analysis. International Advances in Economic Research, 20(4), 459–460. doi https://doi.org/10.1007/s11294-014-9488-6
- Cavenaile, L., & Dubois, D. (2011). An empirical analysis of income convergence in the European Union. Applied Economics Letters, 18(17), 1705–1708. https://doi.org/10.1080/13504851.2011.560104
- Celi, G., Guarascio, D., & Simonazzi, A. (2020). A fragile and divided European Union meets Covid-19: Further disintegration or ‘Hamiltonian moment’? Journal of Industrial and Business Economics, 47(3), 411–424. https://doi.org/10.1007/s40812-020-00165-8
- Cutrini, E. (2009). Using entropy measures to disentangle regional from national localization patterns. Regional Science and Urban Economics, 39(2), 243–250. https://doi.org/10.1016/j.regsciurbeco.2008.08.005
- Czyż, T., & Hauke, J. (2015). Entropy in regional analysis. Quaestiones Geographicae, 34(4), 69–78. https://doi.org/10.1515/quageo-2015-0037
- Deichmann, J. I., Eshghi, A., Haughton, D., & Li, M. (2017). Socioeconomic convergence in Europe one decade after the EU enlargement of 2004: Application of self-organizing maps. Eastern European Economics, 55(3), 236–260. https://doi.org/10.1080/00128775.2017.1287547
- Diaz del Hoyo, D., Dorrucci, E., Heinz, F., & Muzikarova, S. (2017, December). Real convergence in the euro area: A long-term perspective. ECB Occasional Paper Series no. 203. Retrieved May 1, 2020, from https://www.ecb.europa.eu/pub/pdf/scpops/ecb.op203.en.pdf?8ff80dd3a3b58f231105f3e4835b2928
- Durkalic, D., Fedajev, A., Furtula, S., & Stanišić, N. (2019). The measurement of real convergence in the EU-28 by using the entropy method. Ekonomický c˘Asopis, 67(7), 698–724.
- Eurostat. (2020). EU current account surplus €59.9 bn. Retrieved May 10, 2021, from https://ec.europa.eu/eurostat/documents/portlet_file_entry/2995521/2-06072020-AP-EN.pdf/89b30efd-93b1-20be-a618-d7c19a15fa09
- Ferreiro, J., Gálvez, C., Gómez, C., & González, A. (2017). Economic crisis and convergence in the Eurozone countries. Panoeconomicus, 64(2), 223–244. https://doi.org/10.2298/PAN1702223F
- Forgó, B., & Jevčák, A. (2015, July). Economic convergence of Central and Eastern European EU member states over the last decade (2004-2014). European Commission, Directorate General for Economic and Financial Affairs, Discussion Paper 1. Retrieved May 1, 2020, from http://ec.europa.eu/economy_finance/publications/
- Franks, J., Barkbu, B., Blavy, R., Oman, W., & Schoelermann, H. (2018). Economic convergence in the Euro area: Coming together or drifting apart? IMF Working Papers, 18(10), 1. https://www.imf.org/en/Publications/WP/Issues/2018/01/23/Economic-Convergence-in-the-Euro-Area-Coming-Together-or-Drifting-Apart-45575 [accessed on May 1st 2020]. https://doi.org/10.5089/9781484338490.001
- Gräbner, C., Heimberger, P., & Kapeller, J. (2020a). Pandemic pushes polarisation: The Corona crisis and macroeconomic divergence in the Eurozone. Journal of Industrial and Business Economics, 47(3), 425–438. https://doi.org/10.1007/s40812-020-00163-w
- Gräbner, C., Heimberger, P., Kapeller, J., & Schütz, B. (2020b). Is the Eurozone disintegrating? Macroeconomic divergence, structural polarisation, trade and fragility. Cambridge Journal of Economics, 44(3), 647–669. https://doi.org/10.1093/cje/bez059
- Ho, L. T., & Gan, C. (2021). Foreign direct investment and world pandemic uncertainty index: Do health pandemics matter? Journal of Risk and Financial Management, 14(3), 107. https://doi.org/10.3390/jrfm14030107
- IMF. (2020, October). World economic outlook – A longer and difficult ascent. Retrieved February 2, 2021, from https://www.imf.org/en/Publications/WEO/Issues/2020/09/30/world-economic-outlook-october-2020
- Ioan, B., Mozi, R. M., Lucian, G., Gheorghe, F., Horia, T., Ioan, B., & Mircea-Iosif, R. (2020). An empirical investigation on determinants of sustainable economic growth. Lessons from Central and Eastern European countries. Journal of Risk and Financial Management, 13(7), 146. https://doi.org/10.3390/jrfm13070146
- Isarescu, M. (2015). Nominal convergence vs real convergence. “Romania’s path towards euro” Conference presentation. Retrieved May 1, 2020, from https://www.bnr.ro/PublicationDocuments.aspx?icid=6896
- Kitanovic, D., & Krstic, M. (2010). The impact of foreign exchange rate on the economic growth of Serbia. Economic Themes, XLVIII(1), 13–28.
- Kolev, A. (2012). The impact of the recession in 2008-2009 on EU regional convergence. EIB, Econ Department, Econ Note 522/2012. Retrieved May 3, 2020, from https://www.eib.org/attachments/efs/econ_note_2012_regional_convergence_en.pdf
- Kónya, L. (2020). Did the unemployment rates converge in the EU? Empirical Economics, 59(2), 627–657. https://doi.org/10.1007/s00181-019-01678-5
- Leandro, A. (2020, December). Post-COVID-19 Europe: A story of convergence or divergence? Caixa Bank Research, MR 12. Retrieved April 23, 2021, from https://www.caixabankresearch.com/en/economics-markets/recent-developments/post-covid-19-europe-story-convergence-or-divergence
- Leandro, A., & Jimeno, E. L. (2020, June). The impact of the Covid-19 outbreak on European inflation. Caixa Bank Research, MR 06. Retrieved February 1, 2021, from www.caixabankresearch.com/sites/default/files/content/file/2020/06/90844-im06_20_web_06_ei-ue_focus_1_en.pdf
- Lee, K., Pesaran, H., & Smith, R. (1997). Growth and convergence in a multi-country empirical stochastic Solow model. Journal of Applied Econometrics, 12(4), 357–392. https://doi.org/10.1002/(SICI)1099-1255(199707)12:4<357::AID-JAE441>3.0.CO;2-T
- Liang, X., Si, D., & Zhang, X. (2017). Regional sustainable development analysis based on information entropy – Sichuan Province as an example. International Journal of Environmental Research and Public Health, 14(10), 1219–1218. https://doi.org/10.3390/ijerph14101219
- Lucas, R. E. (1988). On the mechanics of economic development. Journal of Monetary Economics, 22 (1), 3–24.
- Mankiw, G., Romer, D., David, N., & Weil, A. (1992). Contribution to the empirics of economic growth. The Quarterly Journal of Economics, 107(2), 407–437. https://doi.org/10.2307/2118477
- Milligan, G. W., & Cooper, M. C. (1988). A study of standardization of variables in cluster analysis. Journal of Classification, 5(2), 181–204. https://doi.org/10.1007/BF01897163
- Mirza, N., Hasnaoui, J. A., Naqvi, B., & Rizvi, S. K. A. (2020). The impact of human capital efficiency on Latin American mutual funds during Covid-19 outbreak. Swiss Journal of Economics and Statistics, 156(1). https://doi.org/10.1186/s41937-020-00066-6
- Mirza, N., Naqvi, B., Rahat, B., & Rizvi, S. K. A. (2020a). Price reaction, volatility timing and funds’ performance during Covid-19. Finance Research Letters, 36, 101657. https://doi.org/10.1016/j.frl.2020.101657
- Mirza, N., Naqvi, B., Rahat, B., & Rizvi, S. K. A. (2020b). Impact of Covid-19 on corporate solvency and possible policy responses in the EU. The Quarterly Review of Economics and Finance. https://doi.org/10.1016/j.qref.2020.09.002
- Młynarzewska-Borowiec, I. (2017). Neoclassical and technological catching-up as the channels of the real convergence process in the European Union. International Journal of Business and Economic Sciences Applied Research, 10(2), 7–18.
- Odendalh, C., & Springerford, J. (2020, May). Three ways COVID-19 will cause economic divergence in Europe. Center for European Reform. Retrieved April 23, 2021, from https://www.cer.eu/sites/default/files/pb_econdiv_20.5.20.pdf
- Popescu, G. H., Andrei, J. V., Nica, E., Mieilă, M., & Panait, M. (2019). Analysis on the impact of investments, energy use and domestic material consumption in changing the Romanian economic paradigm. Technological and Economic Development of Economy, 25(1), 59–81. https://doi.org/10.3846/tede.2019.7454
- Pouliakas, K., & Branka, J. (2020). EU jobs at highest risk of COVID-19 social distancing: Will the pandemic exacerbate labour market divide? IZA Discussion Paper No. 13281. SSRN: https://ssrn.com/abstract=3608530
- Randriamihamison, N., Vialaneix, N., & Neuvial, P. (2020). Applicability and Interpretability of Hierarchical Agglomerative Clustering with or without Contiguity Constraints. Computer Science and Mathematics, Journal of Classification, https://doi.org/10.1007/s00357-020-09377-y
- Rant, V., Marinč, M., & Porenta, J. (2021). Debt and convergence: Evidence from the EU member states. Finance Research Letters, 39, 101617. https://doi.org/10.1016/j.frl.2020.101617
- Rebelo, S. T. (1991). Long-run policy analysis and long-run growth. Journal of Political Economy, 99(3), 500–521. https://doi.org/10.1086/261764
- Rizvi, S. K. A., Yarovaya, L., Mirza, N., & Naqvi, B. (2020a, October 5). The impact of COVID-19 on valuations of non-financial European firms. https://ssrn.com/abstract=3705462
- Rizvi, S. K. A., Mirza, N., Naqvi, B., & Rahat, B. (2020b). Covid-19 and asset management in EU: A preliminary assessment of performance and investment styles. Journal of Asset Management, 21(4), 281–291. https://doi.org/10.1057/s41260-020-00172-3
- Romer, P. M. (1986). Increasing returns and long-run growth. Journal of Political Economy, 94 (5), 1002–1037. https://doi.org/10.1086/261420
- Sala-I-Martin, X. (1996). Regional cohesion: Evidence and theories of regional growth and convergence. European Economic Review, 40(6), 1325–1352. https://doi.org/10.1016/0014-2921(95)00029-1
- Salois, M. J. (2013). Regional changes in the distribution of foreign aid: An entropy approach. Physica A: Statistical Mechanics and Its Applications, 392(13), 2893–2902. https://doi.org/10.1016/j.physa.2013.02.007
- Shannon, C. E. (1948). A mathematical theory of communication. Bell System Technical Journal, 27(3), 379–423. https://doi.org/10.1002/j.1538-7305.1948.tb01338.x
- Simionescu-Bratu, M. (2014). The economic convergence in European Union based on concentration and entropy approach. EuroEconomica, 1(33), 31–42.
- Sivrikaya, A., & Kurul, Z. (2020). Sustainability of current account surpluses: Evidence from European countries. Prague Economic Papers, 4, 481–501.
- Solow, R. (1956). A contribution to the theory of economic growth. The Quarterly Journal of Economics, 70(1), 65–94. https://doi.org/10.2307/1884513
- Villas-Boas, S. B., Fu, Q., & Judge, G. (2019). Entropy based European income distributions and inequality measures. Physica A: Statistical Mechanics and Its Applications, 514(1), 686–698. https://doi.org/10.1016/j.physa.2018.09.121
- Wunsch, P. (2013). Is the European integration machine broken? Intereconomics Review of European Economic Policy, 48(2), 72–92.
- Yarovaya, L., Mirza, N., Abaidi, J., & Hasnaoui, A. (2021). Human capital efficiency and equity funds’ performance during the COVID-19 pandemic. International Review of Economics & Finance, 71, 584–591. https://doi.org/10.1016/j.iref.2020.09.017
- Yarovaya, L., Mirza, N., Rizvi, S. K. A., Saba, I., & Naqvi, B. (2020a). The resilience of Islamic equity funds during COVID-19: Evidence from risk adjusted performance. Investment Styles and Volatility Timing. https://ssrn.com/abstract=3737689
- Yarovaya, L., Mirza, N., Rizvi, S. K. A., & Naqvi, B. (2020b, October 5). COVID-19 pandemic and stress testing the Eurozone credit portfolios. https://ssrn.com/abstract=3705474