
 ?Mathematical formulae have been encoded as MathML and are displayed in this HTML version using MathJax in order to improve their display. Uncheck the box to turn MathJax off. This feature requires Javascript. Click on a formula to zoom.
Abstract
This study examines time-frequency connectedness between COVID-19 pandemic and economic indicators through a continuous wavelet transformation approach in the US and China. The study also assesses the dynamic conditional correlations (DCCs) between macroeconomic indicators and domestic sectoral returns during the pandemic. The findings display higher coherencies between COVID-19 and long-term predictive economic indicators in China compared to the US. Moreover, the results indicate that the stock market spillovers are more pronounced on domestic sectoral returns than other economic indicators during the COVID-19 outburst. Besides, the findings exhibit that exchange market instability has significant negative repercussions on the domestic sectors in China, however, weaker correlations are discerned between exchange market and domestic sectors in the US. The findings offer several policy implications and endorsements for portfolio managers, policymakers, practitioners, and other market participants.
1. Introduction
Pandemics have ravaged the markets and economies throughout their existence which often have both short and long-term devastating effects on the global markets. The recent COVID-19 outbreak continues to affect the economic and financial hubs across the world. It has exceptionally triggered the risk quantum causing dismal performance of economic markets and mounting pressure of losses on investors in a short time period (Zhang et al., Citation2020b). This prevailing global crisis has gained renewed attention on fundamental issues of handling global crises by governance. Various steps are being taken to lessen the spread and impact of the contagious virus on society and the economy. Nonetheless, the global health problem has led to the transitory termination of businesses, which affected the business performance of economies and financial market mechanisms simultaneously.Footnote1 In these circumstances, the damaging economic impact of a pandemic is imminent.
Earlier studies document the reaction of the stock market in response to a pandemic outbreak, for instance, severe Acute Respiratory Syndrome (SARS) disease (Chen et al., Citation2009) and Ebola Virus Disease (EVD) outburst (Ichev & Marinč, Citation2018). However, limited studies exist on examining the pandemic outbreak intervention with financial markets and the economy. Research in this area is still at the embryonic stage since much of the work is documented through primary data collection and various experiences (Iqbal et al., Citation2020).
It is evident that real economic indicators such as the financial markets serve as barometers of the economic strengths and efficiency of the country (Pan & Mishra, Citation2018). The interaction between the financial markets and economy is evidenced in the many conduits over which financial markets spur economic growth. On the other hand, the macroeconomic variables and information influence the entire economy particularly, households, financial sectors, and markets (Chatziantoniou et al., Citation2013; Fama, Citation1990).
Some of the recent studies have paved attention to reveal the effect of COVID-19 on financial markets locally (Iqbal et al., Citation2020; Sharif et al., Citation2020) and globally (Ali et al., Citation2020; Okorie & Lin, Citation2020). However, the present literature is inadequate to highlight the effect of a global health problem on the economy. Moreover, ample literature investigates the effect of major global and local events on stock markets and the economy,Footnote2 however, scant attention has been paid to investigating the impact of the COVID-19 pandemic on macroeconomic indicators. Sharif et al. (Citation2020) and Ali et al. (Citation2020) are the only papers that have so far simultaneously examined the impact of the COVID-19 pandemic on the stock market, oil prices, Bitcoin, and Gold markets. This study further extends the scope by ascertaining the impact of a COVID-19 pandemic on macroeconomic indicators (such as stock market, exchange rate, Treasury bill, and credit default swaps) of the two largest global economies, the US and China.
It is evident that the financial markets, such as the stock and forex market, respond to major events. Moreover, the abrupt movements in the macroeconomic indicators due to pandemic-driven news can affect the countries globally. Okorie and Lin (Citation2020) confirmed a regional contagion impact of the crisis on the financial markets. Moreover, it is observed that some sectors relatively perform better and get less affected than other sectors during crisis turmoil (Al-Awadhi et al., Citation2020). Although, the overall quantum effect of the COVID-19 pandemic is negative on major economic markets, this study investigates which economic indicator gets mostly affected by the COVID-19 pandemic (Al-Awadhi et al., Citation2020). Goodell (Citation2020) also stated that COVID 19 pandemic is a systemic risk which has financial and economic repercussions that need to be further investigated. Besides, the researchers also hinted at possible spillover effects in different sectors, industries, and economies due to globalization and economic integration. Moreover, the mixed reaction of various industries has been observed during the pandemic duration. Some industries have exponentially gained extraordinary profits, whereas others miserably faced huge losses (Al-Awadhi et al., Citation2020; Goodell, Citation2020).
This study analyzes the nature and magnitude of the contagions between COVID-19 pandemic, macroeconomic variables, and domestic sectoral returns by employing continuous wavelet transformation and the DCC-GARCH model respectively. The study attempts to fill this gap by determining the effect of recent pandemic outbursts, i.e., COVID-19 on macroeconomic indicators in the United States (US) and China. The study supplements the extant literature in several ways. First, this study evaluates the connectedness between the recent outbreak of the COVID-19 and predictive economic variables such as stock markets, exchange rate, credit default swap (CDS) and T-bills in the US and China. There are various linkages that connect these predictive economic indicators. Besides, the predictive variables are used to presage future economic state of a country (Qureshi et al., Citation2019). Further, the global events affect both the economy and financial markets; for instance, if an economy is under the attack of a pandemic, then the security and money markets may react differently, causing the domestic currency to undervalue. Due to uncertainty, the country's economy destabilizes, which affects the discount rate negatively. Moreover, the discount rate is indirectly proportional to the appreciation of the exchange rate (Smirlock & Yawitz, Citation1985). The positive and negative effects in one market may be contagious and transferred to another market(s) which may have greater policy and economic implications on international investment decisions.
Second, the study examines the impact of macroeconomic fluctuations and spillovers on domestic sectoral returns during the pandemic of both countries by employing the dynamic conditional correlation (DCC) GARCH model. The study performs this additional test following Pan and Mishra (Citation2018) and Al-Awadhi et al. (Citation2020). The purpose is to explore the impact of the changes in macroeconomic variables on different sectors of a country to determine which sector remained sensitive due to macroeconomic fluctuations during the pandemic turmoil. It is believed that the economic indicators are highly integrated and have a spillover effect on domestic sectors of the economy (Qureshi et al., Citation2020b). Therefore examining these sectors concurrently during the crisis will better gauge the contagions effect of the economic indicators on various domestic sectors.
Third, the study provides empirical evidence on the reaction of financial markets and economic indicators of the two largest global economies, the US and China. The purpose is to check whether the impact of the COVID-19 pandemic on macroeconomic indicators differs in the two economies. The study focuses on the US and China economies for several reasons. First, earlier evidence unravels that the contagion effects between emerging and developed markets significantly increased during the global crisis (Al Nasser & Hajilee, Citation2016; Sugimoto et al., Citation2014). The effects of the COVID-19 pandemic are widely researched and compared with the Global Financial Crisis (GFC) in the context of interdependence, contagion and spillover effect. Second, many studies confirm the spillover effects between the US and other stock markets, given the dominant role of the US market among world equity markets (Boubaker et al., Citation2016; Rapach et al., Citation2013). Third, the COVID-19 outbreak in the US results from the crisis in China, Iran and Italy (Sharif et al., Citation2020). On 31 December 2019, numerous flu cases with pneumonia-like symptoms were reported in Wuhan city (Sohrabi et al., Citation2020). While China controlled the COVID-19 rising cases in March, the COVID-19 pandemic emerged in Europe and the US (Zhang et al., Citation2020a). A few cases were reported in mid of January in the United States, but the reported number of COVID-19 cases surged exponentially in March. The situation in the US got worse after Italy or South Korea (Sharif et al., Citation2020). It is reported that over 170 countries are caught in this global health issues, with the US having the most confirmed COVID-19 cases in March (WHO, Citation2020).Footnote3 Fourth, a large thread of literature connects the US and China on many fronts.Footnote4
Lastly, the study employs continuous wavelet methodology and the DCC GARCH model as an additional test and finds interesting results. The findings suggest that COVID–19 pandemic outbreak has shaken international stock markets, foreign exchange and credit markets. Besides, it is learnt that the short term treasury markets remain resilient and least affected by the pandemic outbreak whereas, the COVID-19 pandemic has a strong impact on those macroeconomic indicators which have long-term predicting ability related to the economy. The study results show that DCCs between the stock market, exchange rate and sectoral returns are significant during the COVID–19 pandemic duration. However, the magnitude of DCCs is higher between stock markets and sectoral returns, implying that stock markets play an essential role in financial contagion relative to other macroeconomic indicators. The findings offer guidelines to investors in optimal designing of portfolios and provide guidance to practitioners and policymakers. The heterogeneous impact of the COVID-19 pandemic on economic indicators aids portfolio managers in formulating more prudent international investments and hedging strategies. The rest of the paper is organized as follows. Section 2 describes the data and variables. Section 3 presents estimation techniques. Section 4 proceeds with the empirical analysis and discussion of results. The conclusion is drawn in Sec. 5.
2. Data and variables
provides the summary of variables, definition and sources. As mentioned earlier, the contagious infection’s eruption began on 31 December 2019 in China. Therefore, the study makes use of daily data for the period 1st January 2020 to 30th June 2020. COVID-19 is proxied using daily growth in reported cases following Al-Awadhi et al. (Citation2020). and show daily active confirmed cases of COVID-19 in China and the US. The study makes use of stock market returns, exchange rate, treasury-bill ratio (TB) and CDS spread as a predictive macroeconomic variables in analysis. The predictive variables are those indicators that are closely linked with economic variables (Qureshi et al., Citation2019). The study makes use of the proxies of macroeconomic indicators to capture the economic effect. The current study follows the approach by Qureshi et al. (Citation2019, Citation2020a) who used these proxies to forecast the future economic state. The choice of the variables is dependent on daily frequency and data availability.
Figure 1. Daily cases reported in the China. The data source is Worldometer.
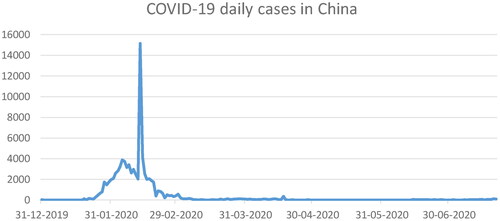
Figure 2. Daily cases reported in US. The data source is Worldometer.
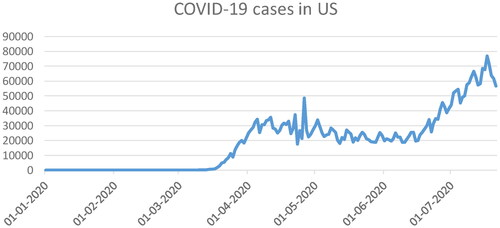
Table 1. Variables, definition and data sources.
Stock market movements are often considered a barometer of economic growth and stability (Pan & Mishra, Citation2018). Moreover, the economic indicators such as Exchange rate, CDS, and T-bills delineate the country's economic health (Qureshi et al., Citation2019). Changes in the Exchange rate ( Ex) provide a deeper understanding of the changes in the macroeconomic conditions (Haddad et al., Citation2013). The study follows Qureshi et al. (Citation2019, Citation2020a) and Caballero et al. (Citation2019) and makes use of T-bill ratio and CDS spread as predictive macroeconomic variables in the analysis. Qureshi et al. (Citation2019, Citation2020a) stated that T-bills influence the trading decision of institutional investors. CDS is a financial contract that permits offsetting the credit risk. Caballero et al. (Citation2019) find that the CDS spreads as a proxy of credit risk are strongly correlated with business fluctuations in emerging markets. The first difference in variables is taken into account while identifying the relationship. The study also evaluates the impact of economic changes, arising due to pandemic outburst, on domestic sectoral returns. The selected distinct sectoral indices include natural resources, auto and parts, industrial, energy, food and beverage, transportation, health care and nursing, and information technology. The selection of the sectors is based on data accessibility.Footnote5 The series returns are computed by taking the logarithm of the first difference based on continuous compounding.
3. Methodology
3.1. Continuous wavelet transformation
To determine the linkage between COVID-19 and macroeconomic indicators, the study employs continuous wavelet transformation following Grinsted et al. (Citation2004) and Aguiar-Conraria and Soares (Citation2011). The continuous wavelet transform of series is a function of two phenomena presented by the convolution as follows
(1)
(1)
The bar in the equation indicates the combined conjugate, and the conversion parameter handling its time or location position is denoted by With respect to the mother wavelet, the persistent selection is the Morlet wavelet shown by
(2)
(2)
The Morlet wavelet is a complex sine wave in a Gaussian framework, whereas ω0 is the wave number. Usually, the results are attained with a careful choice where ω0 equal to 6 ever since it depicts the balance between time and frequency localization (Grinsted et al., Citation2004). Morlet wavelet is generally applied because of the standardized methods used to transform wavelet scales to frequencies (Aguiar-Conraria & Soares, Citation2011). Moreover, the combined frequency and time application is optimum. In addition, there is an equivalence between frequency radius and time radius. Lastly, the Morlet wavelet is systematic and orderly.
Similar to Fourier analysis, several compelling characteristics persist in the wavelet sphere. The wavelet power spectrum is represented as
(3)
(3)
It calculates the particular impact for each frequency and time scale to the variance of the series. The cross-wavelet spectrum can be relatively described as
(4)
(4)
Wx(τ,s) and Wy(τ,s) establish wavelet transforms of x(t) and y(t) time series. The cross-wavelet spectrum is segregated into real and imaginary parts as the mother wavelet is usually intricate. The cross wavelet power is defined as |Wxy(τ, s)|, which displays local covariance among the time series at each time and frequency. Besides, the wavelet coherency is specifically helpful due to the power spectrum normalizes both time series. Similar to Fourier analysis, the time series wavelet coherency of x(t) and y(t) is signified as:
(5)
(5)
where the smoothing operator in frequency and time band is represented as S. Further, to identify the interconnection between time series across frequency and time, the wavelet squared coherency is applied. The
ranges from 0 and 1, just like the squared correlation coefficient. It signals weak or strong interconnections between time series. Hence, by observing the contour plot of the procedure, the areas in frequency and time-space can be determined. It ascertains the fluctuating and co-fluctuating time and frequency characteristics. The study depends on Monte Carlo simulations for evaluation.
The main edge of consuming composite value-based wavelet is the phase approximation of the wavelet conversion in each time series. The phase-difference gives information on the possible impediments of fluctuations of the time series as a function of frequency and time. The phase difference is defined as
(6)
(6)
The informational content over the value of ϕxy ϵ [−π, π] is validated by each element’s signs. A zero phase-difference exhibits the interlinkages between the time-series at a specific frequency. In case if ϕxy ϵ [0, π/2], then X is leading over Y in the time series and the series is in-phase. Whereas if ϕxy ϵ [−π/2, 0] then Y leads X; π is the phase-difference and π is the anti-phase relationship. For a time series, y leads if ϕxy ϵ [π/2, π], and x leads in case of ϕxy ϵ [−π, −π/2].
3.2. Dynamic conditional correlations (DCC)-GARCH model
The study applies the DCC-GARCH model following Engle (Citation2002) as an additional test to examine the time-varying spillovers between macroeconomic variables and sectoral returns. Employing this model helps assess whether the dynamic correlation between macro-variables and sectoral indices returns rise, decline, or remain stable over time particularly during pandemic. The DCC model provides additional advantages compared to simple correlation analysis. First, the DCC model is parsimonious relative to numerous multivariate GARCH models. Second, it is adaptable because it permits the estimation of time-varying fluctuations, covariances and correlations of various variables over time which permits to determine the dynamic investor behaviour in response to news and innovations. Third, it computes correlation coefficients of the standardized residuals and hence accounts for heteroscedasticity in the data (Chiang et al., Citation2007).
Moreover, the DCC-GARCH approach does volatility-based adjustments to the volatility that vary through time continuously, thus provides a superior correlation indicator (Cho & Parhizgari, Citation2009). The computational of Engle's DCC-GARCH model consists of two steps: the first is the computation of the univariate GARCH model, and the second is the approximation of the time-varying conditional correlations.Footnote6
The multivariate DCC-GARCH model is represented as:
(7)
(7)
(8)
(8)
(9)
(9)
(10)
(10)
where
is a vector of previous observations,
is the multivariate conditional variance,
is the vector of conditional returns,
is the vector of standardized residuals,
is an n × n symmetric dynamic correlations matrix and
is a diagonal matrix of conditional standard deviations for return series, attained from approximating a univariate GARCH model with
on the ith diagonal,
4. Results and discussion
4.1. Descriptive statistics
Descriptive statistics of the examined variables are presented in . The average daily means across all variables are close to zero. For the entire period examined, the highest standard deviation and the highest volatility are visible in the COVID-19 reported cases at 0.40 and 0.83 in the US and China, respectively. The largest standard deviation is observed in T-bill returns and CDS during the global crisis. The currency exhibits the lowest standard deviation in each analyzed period of both countries. Moreover, all the variables, including sectoral returns, are negatively skewed except exchange rate and CDS returns. The coefficients of kurtosis of majority variables confirm the occurrence of leptokurtic distributions. Further, the skewness and kurtosis values of all variables indicate that data series are not normally distributed. The P-value of the Jarque-Bera (JB) test also shows that the null hypothesis cannot be accepted at the 1% level significance.
Table 2. Descriptive statistics.
4.2. Continuous wavelet analysis
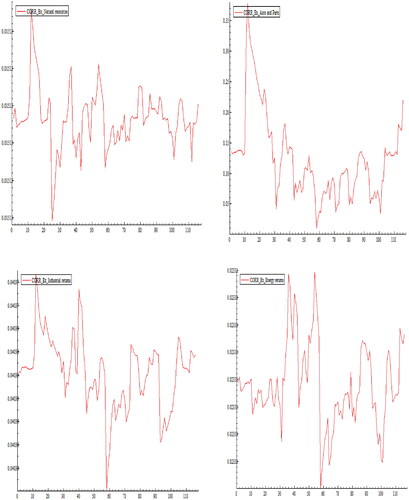
The study analyses COVID-19 and macroeconomic variables in the time and frequency domain using continuous wavelet transform. displays the continuous wavelet power spectrum for each variables of the US. The wavelet power spectrum is described as the squared value of the wavelet transform. The spectrum computes the variance of time series at each period and scale. The statistical signification of wavelet power is determined against the stationary series’ hypothesis by the power spectrum’s setting. The cone of influence (COI) shows picture distortion by approaching effects as depicted in light shade. The outer zones of COI are negligible since there exists no statistical significance. The power arrays are from low (blue) to high (red) power regions. The spectrum plots for all variables exhibit the evolutionary variances at 32 days scale and above. It is revealed in that there are few momentary extreme high power regions. The COVID-19's wavelet spectrum shows significant high fluctuations from February till March at eight days scale and 32 days scale. It implies that the intense fluctuations persevere due to disturbances caused by the pandemic in the US for that particular periods.
Figure 3. The US: continuous wavelet transformation of variables.
Source: Author's own estimations.
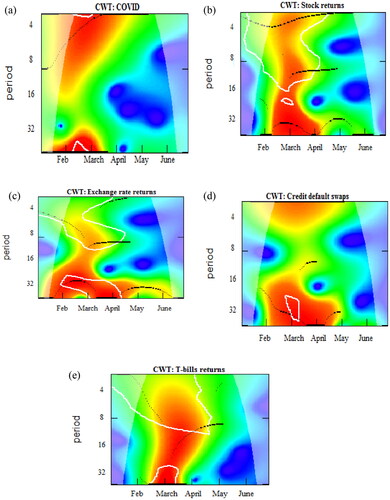
Moreover, significant volatility is observed in higher frequency regions, i.e., 4 to 8 days at the beginning of February and March, which are the reported period of elevated COVID-19 cases in the country. Some of the effect traces can be evidenced in lower frequency too. The short term fluctuations last till the start of April and vanishes. Furthermore, the wavelet spectrum of stock returns in exhibits noteworthy elevated variations at the 32-days scale and above during the period of mid-February to mid-April. The red swirls are also evident in both high to low frequency until the mid-April, which depicts the distress in the stock market due to the pandemic outburst. The significant impact at both upper and lower frequency scales suggest that variations are persistent in the financial market. However, the returns become stable in the later periods.
In , the uninterrupted, substantial high power locale exists for the exchange rate from mid-January until May at lower frequencies. This suggests that the exchange rate is highly affected during the pandemic. Moreover, the maximum exposure is only evident at a lower frequency scale and persistent for a longer period. The exchange rate instability envisages a decline in foreign trade flows and investment. The prolonged exposure is also perceived in CDS having high power region throughout February to May at 2–4 days and 16–64 days’ scales. Finally, in , the high spikes for T-bill are observed only in mid-February to March over an 8–64 days scale. It implies that lower fluctuations are found in T-bill during the overall pandemic, and the short-term market resumed to be normal after a month jolt arising due to the global health crisis. In almost all variables, higher fluctuations are perceived in March, indicating that the surge in the reported number of COVID-19 cases has affected all macroeconomic indicators in the month of March.
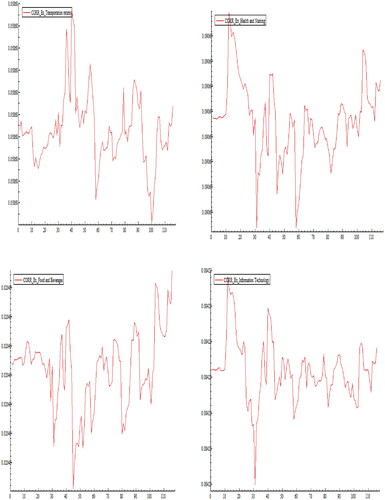
exhibits the continuous wavelet power spectrum of each variable of China. The extremely high power regions are witnessed in . The wavelet spectrum of COVID-19 displays significant-high fluctuations for the period of January to June at a 32-64 days scale with an interim break in February. It indicates that the extreme fluctuations persist at a lower frequency due to turbulences caused by pandemic. Moreover, the wavelet spectrum of stock returns in shows fluctuations in February and March at higher and lower frequencies. The turmoil in the stock market can only be witnessed in February and March and become stable thereafter. In , similar patterns can be observed in mid, higher and lower frequency having maximum exposure at 16 days scale in January and February. This advocates that the exchange rate is highly affected at the start of the global health crisis.
Figure 4. China: continuous wavelet transformation of variables.
Source: Author's own estimations.
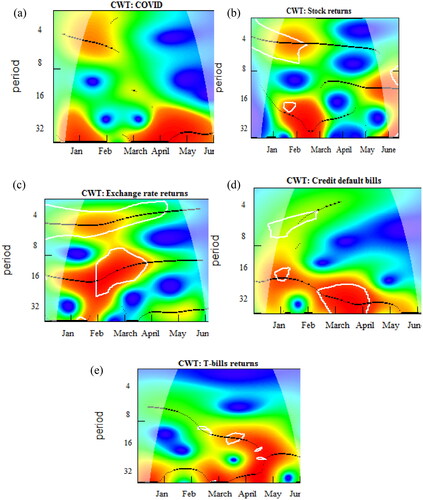
The continuous high power spikes are perceived in CDS showing high power region from January to June in 16-64 days scale which suggest the highest volatility in CDS (see ). Finally, the high spikes for T-bill are also visible from January to May, with an intermittent gap in mid of January (see ). It shows that higher instability is found both in CDS and T-bill markets, which suggest that the credit and money market remained highly fluctuating during the pandemic turmoil witnessed throughout the country.
4.3. Wavelet coherence analysis
Continuous wavelet coherence provides detailed insight and understanding of the interdependence of variables over various scales. The contour plot exhibits wavelet coherence. The frequency and time elements are represented by the vertical and horizontal axis, respectively. The magnitude of interdependences is measured by the range of colours (red and blue) depicting high and low coherency. The high coherency between variables displays a strong significant correlation. In addition, the wavelet coherence ascertains the structural linkages by diagnosing lead and lag association between variables. The wavelet phase alteration computed at a specific frequency is shown in the way of direction of arrows. The figure is analyzed as: in-phase is indicated by rightward pointing, and anti-phase is depicted by leftward pointing. The leading variable is indicated by rightward down or leftward up while the first variable as lagging is depicted rightward up or leftward down arrows.
depicts a significant negative relationship between COVID-19 related cases and stock returns at a lower frequency level suggesting a prolonged effect of the COVID-19 pandemic on the stock market. Moreover, leftward up arrows indicate the cases of COVID-19 leading the stock market returns. This implies that investors in the stock market show negative sentiments for COVID-19 news representing a significant adverse correlation. The result confirms Al-Awadhi et al. (Citation2020) findings that pandemic hurts stock market trading.
Figure 5. The US: wavelet coherence between variables.
Source: Author's own estimations.
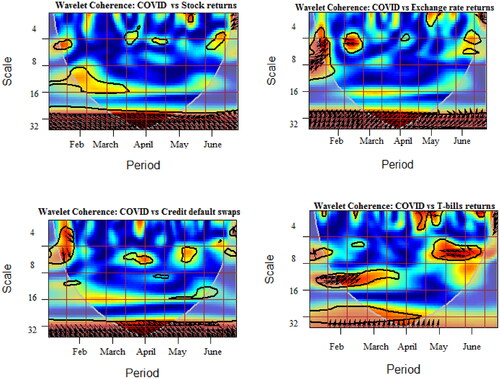
represents the coherence between pandemic and exchange rate returns. It is evident that COVID-19 has visible coherence with exchange rate returns in March and April at 32 scale and above. The long term coherency is visible and significant throughout the period. Moreover, the COVID-19 has a positive impact on exchange rate returns. A relatively similar relationship is observed for COVID-19 and CDS in . However, arrows show a positive leading relationship between COVID-19 and CDS. Finally, the wavelet coherence in presents that COVID-19 and T-bill returns pair co-move temporarily during the February, March and June month however, no significant relationship is visible at a lower frequency scale.
The wavelet coherence in displays that the COVID-19 and stock market return has a negative relationship in the case of China. In addition, momentous long-term coherency is also visible from February until April, suggesting that COVID-19 leads and significantly impacts stock market returns during the specified period. Additionally, it is observed that the in-phase association is envisaged between COVID-19 and Exchange rate. The significant association is evident at medium to lower frequency, particularly from February to May, suggesting that COVID-19 has a prolonged impact on the foreign exchange market. The elevated rate in the exchange market suggests depreciation of the foreign currency, which presages tumult in the foreign exchange market and an expected decline in exports and foreign inflows in the country. Similar coherency can be witnessed with the pair of COVID 19—CDS in . Finally, the coherency plot of COVID 19 and T-bill returns shows an insignificant association (see ).
Figure 6. China: wavelet coherence between variables.
Source: Author's own estimations.
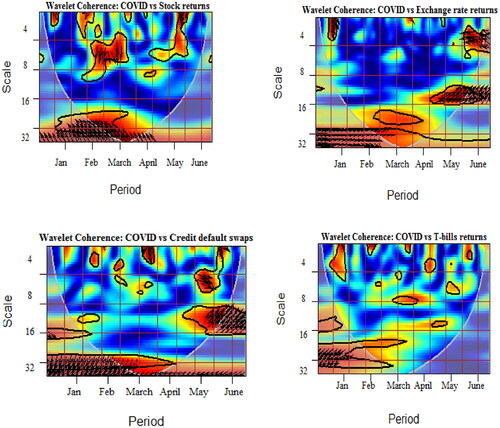
Overall, the interdependence of variables, i.e., macroeconomic variables-COVID 19 pairs, is robust across the entire period. The pairs of COVID 19-stock market returns, COVID-Exchange rate return, and COVID-CDS show areas of significant interdependence from February to May. These pairs relatively tend to exhibit an extended high coherency phase. However, there exists weak interdependence specifically for the COVID 19-Treasury bill pair in the overall sample. Besides, the contagious effect of the COVID-19 on the Exchange rate is influential compared to other pairs. The propensity of pandemic contagion implies transitory high volatility in macroeconomic variables. Therefore, it is concluded that interdependence pertains to fundamental long-term linkages between variables. It is evident that pandemic has a negative impact on long term macroeconomic indicators and an insignificant or negligible effect on short term market variables such as T-bills.Footnote7 Moreover, it is concluded that higher coherencies between variables are witnessed in China compared to the US at a lower frequency, suggesting strong long term connectedness between COVID-19 and economic indicators in China.
4.4. DCC-GARCH plots
The study applies a DCC-GARCH model described in Sec. 3 to determine the co-movements between macroeconomic indicators and domestic sectoral returns during the pandemic. The purpose is to identify the correlations between fluctuations in macroeconomic variables and various domestic sectors of the economy caused by COVID-19 crisis.
plots the DCCs of exchange rate and sectoral indices returns of the US. Overall the trends and patterns of illustrations suggest positive but reduced correlations for all exchange rate pairs with sectoral returns ranging from 1.5% to 25% approximately. The co-movement between exchange rate returns and natural resource sector tends to persist at the lowest range, whereas linkages between exchange rate returns and auto-parts sector witnessed at 25% averagely. A significant correlation can be noticed within the first 30 days after the pandemic outbreak in the majority of the exchange rate-sectoral returns pairs (such as natural, IT, Health and Nursing, Industrial and Auto sector). At the same time, correlations between exchange rate and transportation, energy and food and beverages are witnessed to have upper bands after 30 days and persist for 60 days. A gradual downward trend is depicted after 60 to 70 days with different magnitudes in the exchange rate-sectoral return dynamics.
Figure 7. The US: conditional correlation of exchange rate and sectoral returns.
Source: Author's own estimations.
depicts conditional correlations between the stock market index and sectoral indices of the US. It is observed that after the outbreak of the pandemic virus, the correlation of stock market returns and natural resources is significantly highest at 83%, which declines in 30 days and drops at 20% after a month. Afterwards, the relationship shows upward swings and remain volatile thereafter. Moreover, the co-movements of stock returns-IT sector and stock returns-Industrial sector pairs remain constant throughout the period at 70% and 66%, respectively. For most of the sample period, the correlations are high at the start of the time span and remained highly volatile with some notable drops. The highest correlation is observed for the pair of stock returns-energy sectoral returns at approximately 93%, followed by a pair of stock returns-transportation returns and stock returns-auto and parts sector at 85% and 80% approximately. Overall positive correlations are witnessed for almost all the pairs suggesting the positive spillover effect of stock market fluctuations on the returns of sectoral indices.
Figure 8. The US: conditional correlation of stock market and sectoral returns.
Source: Author's own estimations.
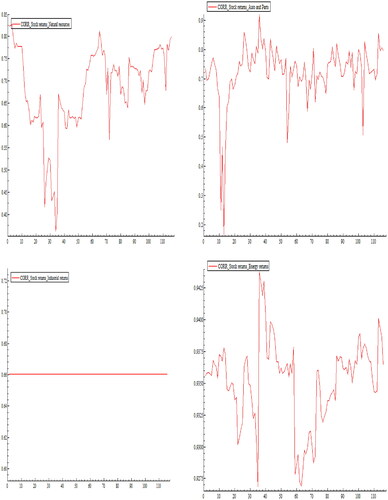
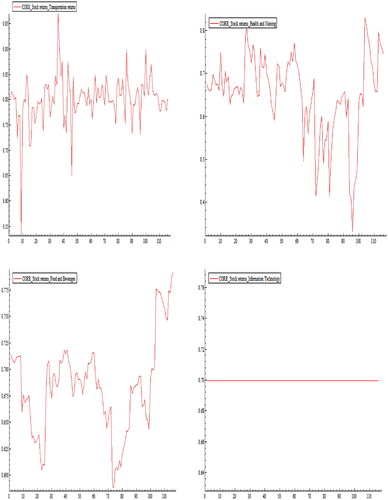
It is concluded from the above graphical illustrations that stock market fluctuations have a major meaningful positive spillover effect on sectoral indices returns compared to exchange rate volatility.
depicts a negative spillover effect of the exchange rate on the natural resource sector during the global health crisis. Moreover, a sharp upswing follows during the 25 to 45 days period, which declines and turns negative for the rest of the period. Volatile trends and patterns are visible in the subsequent period. The co-movements of the exchange rate with auto and parts, industrial products, energy, transportation and IT sector exhibit common and similar behaviours. The majority of pairs are reported to have negative and above 70% correlations on average, implying that fluctuations in the foreign exchange markets have a strong negative spillover effect on the domestic sectors of China.
Figure 9. China: conditional correlations of exchange rate and sectoral returns.
Source: Author's own estimations.
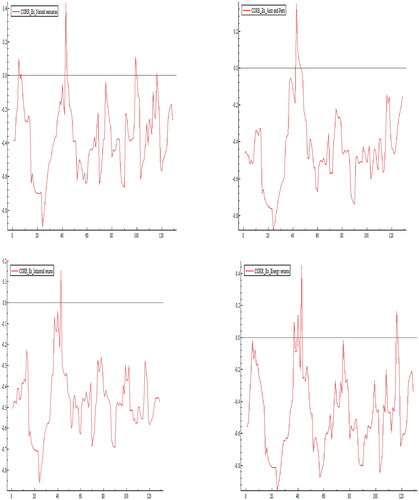
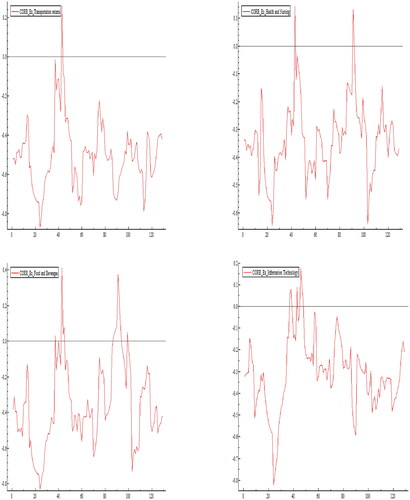
shows the positive conditional correlations between stock returns and the natural resources sector in China with severe swings from day 1 till 112 days. However, a slight plunge is seen, followed by a reversed double V-shape on the next day. Similar patterns can be evidenced in the co-movements between the stock market and auto parts, energy sector, transportations, IT and industrial sectors. A sharp negative decline is observed after 100 days suggesting that market hype has a short term inverse effect on the sectors, which lasts for a day or week.
Figure 10. China: conditional correlations of stock market and sectoral returns.
Source: Author's own estimations.
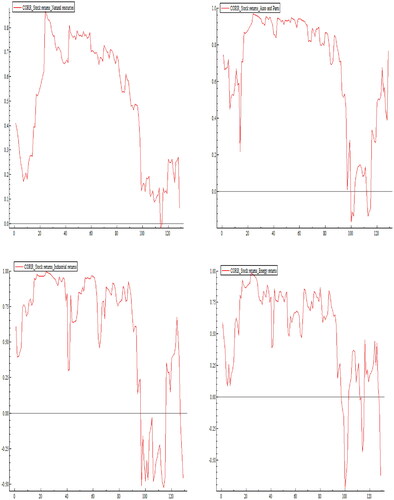
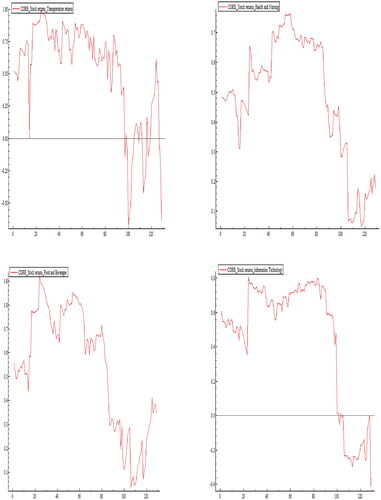
The correlations between stock market index, health and nursing and food and beverages exhibit a quite positive and mostly stable trend, while a downward trend after 90 days of pandemic news is observed. Finally, a gradual descending trend characterizes the last part of the sample period in overall pairs. The graphical illustrations averagely mirror the positive and higher correlations of the stock market index with sectoral returns.Footnote8
4.5. DCC-GARCH estimations
and unveil the movements of stock market returns, exchange rate and eight different sectoral returns of US and China using Dynamic Conditional Correlations (DCC)-GARCH. , Panel A presents the results of the time-varying exchange rate and sectoral returns co-movements in the US. The estimated parameters of the DCC model (α and β) of the majority of pairs are statistically significant at the 1% level. This indicates that the model is well specified and confirms that the second moments of variables are time-varying (α). In addition, high values found for parameter β suggest the existence of a strong correlation structure.
Table 3. The US: DCC-GARCH model results.
Table 4. China: DCC-GARCH model results.
However, the results depict that exchange rate fluctuations do not significantly impact sectoral returns as the P-values of almost all rho () are insignificant. This implies no spillover relationship between exchange rate and sectoral returns during the global health crisis. The result is in line with the graphical illustrations (see ), suggesting weak correlations between exchange rate and sectoral indices. This finding contrasts with Qureshi et al. (Citation2020b), who documented the significant exchange rate spillover on domestic sectoral returns in the emerging economy. However, the significant beta value of all conditional correlations indicates momentous volatility persistence throughout the pandemic period.
, Panel B displays the results of the DCC-GARCH model between stock index returns and domestic sectors. The visible significant conditional correlations are witnessed in all pairs of stock returns with sectoral returns suggesting high correlations and spillover effect of the stock market on sectoral returns during the global health crisis. Moreover, it is evident that correlations of almost all pairs are above 65% implying higher linkages between the stock market index and sectoral returns. The overall results imply noticeable correlations between the stock market and sectoral indices. In contrast, the spillover effect is not evidenced in the case of exchange rate returns and sectoral indices, suggesting weak correlations between exchange rate and sectoral returns during the COVID-19 tumult timespan. The study also finds an insignificant spillover effect of T-bill rate and CDS with almost all pairs of sectoral indices.Footnote9
, Panel A shows the results of the time-varying co-movement of exchange rate-sectoral returns based on the DCC model of China. The results depict that the exchange rate has a noticeable negative spillover effect on all sectoral returns during the pandemic. A similar result can be witnessed from , suggesting strong inverse co-movements between exchange rate and sectoral indices. The negative correlations among the pairs range from 32% to 56%. The findings imply that instability and fluctuations in the foreign exchange market have negative repercussions on the domestic sectors of China. This particular result of Exchange rate-sectoral returns co-movement is different from the US in which insignificant correlations between variables are observed.
, Panel B displays the results of DCCs between stock index and sectoral returns. It is manifested that positive correlations are discerned in almost all pairs of stock index returns with sectoral returns except the information technology sector suggesting strong correlations and spillover effect of the stock market on sectoral returns during the pandemic. The study does not observe the spillover effect of stock returns on the information technology sector, which signifies that the information technology sector is least affected by the instability and uncertainty in the stock markets during the pandemic. Overall, it is concluded that the quantum of correlations between the stock market and sectoral returns is higher relative to exchange rate and sectoral returns during the COVID-19 crisis. Besides, correlations between exchange rate and sectoral returns in the US demonstrate weaker conditional correlations compared to China.
5. Conclusion and policy implications
This study is a pioneer research work in assessing the impact of the COVID-19 pandemic on economic indicators. The findings suggest that COVID–19 pandemic outbreak has shaken international stock, foreign exchange and credit markets. Besides, the short term Treasury markets remain resilient and least affected by the pandemic outbreak. COVID-19 pandemic has a strong impact on long-term predictive economic variables which can presage the future economic state. The results show that the magnitude of DCCs is higher between stock markets and sectoral returns, implying that stock markets play an essential role in financial contagion relative to other economic indicators.
The findings offer novel and imperative policy and practical implications for the speculators, asset managers and portfolio managers. The higher level of volatilities and uncertainties in the US and China during the turbulence period may lower portfolio diversification opportunities for the investors. The empirical results of volatility divergence of variables across different scales render guidance to managers and investors on relevant trading approaches apposite to assorted investment objectives. The global pandemic problem has a crucial role in transmitting information content across markets due to increased globalization and financial markets integration. More importantly, since crisis events enhance the contagion among financial markets and economy in emerging markets like China needs a more effective mechanism to hedge against the risk posed by developed markets like the US. The findings emphasize that investors and policymakers should carefully monitor these global events to forecast net receivers of spillovers more accurately. More importantly, they should utilize the information contained in the global health problem to formulate more effective domestic policies to reduce the impact of contagion in developed and developing nations.
Further, from an investor viewpoint, the study shows that the COVID-19 pandemic’s effect on macroeconomic determinants is mostly analogous in both countries showing a similar investor's reaction during extreme market conditions. Additionally, the diverse patterns of the financial and money markets during global turmoil provide diversification opportunities. The momentous fluctuations over the short to medium run may assist investors with short horizon objectives to make prudent decision making. Furthermore, findings from DCC-GARCH help portfolio managers in the formation of an efficient portfolio consisting of various sectors. They may design risk management strategies and opt for new financial technologies and instruments to mitigate risks caused by volatility innovations. The rational conclusion is to opt for systematic macro-prudential strategies in specific markets. It is obvious that the COVID-19 pandemic is leading to unprecedented response of financial markets and macroeconomic indicators. The COVID-19 pandemic is still ongoing, which entails that portfolio managers and individual investors should learn to mitigate financial and macroeconomic uncertainty associated with the COVID-19 spread. Technological and financial innovation in the risk management framework could help lessen the recently enhanced risks caused by the ongoing COVID-19 pandemic.
Moreover, the investors may opt for diversification and risk hedging techniques to view the different responses of long-term and short-term financial markets and macroeconomic indicators in the crisis. It is recommended that the policymakers should inject liquidity and utilize financial technology to international financial markets and economies to foster growth, as demonstrated by the latest global swap measures taken by the Federal Reserve in the US. Investigation on the effect of the COVID–19 pandemic is still in the embryonic stage. The study findings could also provide useful insight to investors and portfolio managers of other comparable economies of developed and emerging markets, dealing with the disastrous COVID-19 pandemic and uncertain economic and financial markets scenario. Further, future research can be exploring the impact of a pandemic for a longer period in developed and developing economies.
Acknowledgements
I am highly grateful to Dr Saba Qureshi, Institute of Business Administration, University of Sindh, Jamshoro and Dr. Muhammad Abubakr Naeem, School of Economics and Finance, Massey University, New Zealand for their insightful comments and encouragement.
Correction Statement
This article has been republished with minor changes. These changes do not impact the academic content of the article.
Notes
1 For recent research work on the impact of COVID-19 on corporate world, firms, financial assets, commodities, crypto currency, asset management, investment, bankruptcy and credit portfolios see, Mirza et al. (Citation2020a, Citation2020b, Citation2020c), Rizvi et al. (Citation2020a, Citation2020b), Yarovaya et al. (Citation2020a, Citation2020b), Arif et al. (Citation2021), Farid et al. (Citation2021), Naeem et al. (Citation2021a, Citation2021b), Shahzad, Naeem et al. (Citation2021), Yarovaya et al. (Citation2021).
2 For instance, global crises (Das et al., Citation2019), political events (Shanaev & Ghimire, Citation2019), terrorism (Chaudhry et al., Citation2018) and environmental (Iqbal et al., Citation2020) to name a few.
3 World Health Organization (2020). Coronavirus disease (COVID-19) outbreak situation, retrieved from: https://www.who.int/emergencies/diseases/novelcoronavirus-2019.
4 such as with respect to monetary policy (Zhang et al., Citation2020b), international stock markets and trade (Gong et al., Citation2020), economic uncertainty and spillovers (Zhang et al., Citation2019), Consumption-based CO2 emissions (Li et al., Citation2018) to name a few.
5 For a smoother comparative analysis, it was decided to choose those sectoral indices which are available in both countries.
6 The estimation of the first step, univariate GARCH model are not reported for brevity purpose and will be provided on request.
7 The study makes use of an alternative COVID-19 measure, i.e., the total daily number of deaths following Al-Awadhi et al. (Citation2020) and determines the relationship with economic indicators. The findings remain intact using alternative COVID-19 measure. The results are not reported for brevity purpose and will be provided on request.
8 The DCC plots of CDS and T-bills with sectoral returns are not reported due to the insignificant DCC’s estimation. See related discussion in section 4.5. The results will be provided on request.
9 The results are not reported for brevity purpose and will be provided on request.
References
- Aguiar-Conraria, L., & Soares, M. J. (2011). Oil and the macroeconomy: Using wavelets to analyze old issues. Empirical Economics, 40(3), 645–655. https://doi.org/10.1007/s00181-010-0371-x
- Al Nasser, O. M., & Hajilee, M. (2016). Integration of emerging stock markets with global stock markets. Research in International Business and Finance, 36, 1–12. https://doi.org/10.1016/j.ribaf.2015.09.025
- Al-Awadhi, A. M., Alsaifi, K., Al-Awadhi, A., & Alhammadi, S. (2020). Death and contagious infectious diseases: Impact of the covid-19 virus on stock market returns. Journal of Behavioral and Experimental Finance, 27, 100326. https://doi.org/10.1016/j.jbef.2020.100326
- Ali, M., Alam, N., & Rizvi, S. A. R. (2020). Coronavirus (covid-19)—an epidemic or pandemic for financial markets. Journal of Behavioral and Experimental Finance, 27, 100341. https://doi.org/10.1016/j.jbef.2020.100341
- Arif, M., Naeem, M. A., Hasan, M., M Alawi, S., & Taghizadeh-Hesary, F. (2021). Pandemic crisis versus global financial crisis: Are Islamic stocks a safe-haven for G7 markets?. Economic Research-Ekonomska Istraživanja, 1–21. https://doi.org/10.1080/1331677X.2021.1910532
- Boubaker, S., Jouini, J., & Lahiani, A. (2016). Financial contagion between the US and selected developed and emerging countries: The case of the subprime crisis. The Quarterly Review of Economics and Finance, 61, 14–28. https://doi.org/10.1016/j.qref.2015.11.001
- Caballero, J., Fernández, A., & Park, J. (2019). On corporate borrowing, credit spreads and economic activity in emerging economies: An empirical investigation. Journal of International Economics, 118, 160–178. https://doi.org/10.1016/j.jinteco.2018.11.010
- Chatziantoniou, I., Duffy, D., & Filis, G. (2013). Stock market response to monetary and fiscal policy shocks: Multi-country evidence. Economic Modelling, 30, 754–769. https://doi.org/10.1016/j.econmod.2012.10.005
- Chaudhry, N., Roubaud, D., Akhter, W., & Shahbaz, M. (2018). Impact of terrorism on stock markets: Empirical evidence from the SAARC region. Finance Research Letters, 26, 230–234. https://doi.org/10.1016/j.frl.2018.02.024
- Chen, C.-D., Chen, C.-C., Tang, W.-W., & Huang, B.-Y. (2009). The positive and negative impacts of the SARS outbreak: A case of the Taiwan industries. The Journal of Developing Areas, 43(1), 281–293.
- Chiang, T. C., Jeon, B. N., & Li, H. (2007). Dynamic correlation analysis of financial contagion: Evidence from Asian markets. Journal of International Money and Finance, 26(7), 1206–1228. https://doi.org/10.1016/j.jimonfin.2007.06.005
- Cho, J. H., & Parhizgari, A. M. (2009). East Asian financial contagion under DCC-GARCH. International Journal of Banking and Finance, 6(1), 17–30.
- Das, S., Demirer, R., Gupta, R., & Mangisa, S. (2019). The effect of global crises on stock market correlations: Evidence from scalar regressions via functional data analysis. Structural Change and Economic Dynamics, 50, 132–147. https://doi.org/10.1016/j.strueco.2019.05.007
- Engle, R. (2002). Dynamic conditional correlation: A simple class of multivariate generalized autoregressive conditional heteroskedasticity models. Journal of Business & Economic Statistics, 20(3), 339–350. https://doi.org/10.1198/073500102288618487
- Fama, E. F. (1990). Stock returns, expected returns, and real activity. The Journal of Finance, 45(4), 1089–1108. https://doi.org/10.1111/j.1540-6261.1990.tb02428.x
- Farid, S., Kayani, G. M., Naeem, M. A., & Shahzad, S. J. H. (2021). Intraday volatility transmission among precious metals, energy and stocks during the COVID-19 pandemic. Resources Policy, 72(102101), 102101. https://doi.org/10.1016/j.resourpol.2021.102101
- Gong, Y., Li, K. X., Chen, S.-L., & Shi, W. (2020). Contagion risk between the shipping freight and stock markets: Evidence from the recent US-China trade war. Transportation Research Part E: Logistics and Transportation Review, 136, 101900. https://doi.org/10.1016/j.tre.2020.101900
- Goodell, J. W. (2020). Covid-19 and finance: Agendas for future research. Finance Research Letters, 35, 101512. https://doi.org/10.1016/j.frl.2020.101512
- Grinsted, A., Moore, J. C., & Jevrejeva, S. (2004). Application of the cross wavelet transform and wavelet coherence to geophysical time series. Nonlinear Processes in Geophysics, 11(5/6), 561–566. https://doi.org/10.5194/npg-11-561-2004
- Haddad, M., Lim, J. J., Pancaro, C., & Saborowski, C. (2013). Trade openness reduces growth volatility when countries are well diversified. Canadian Journal of Economics/Revue Canadienne D'économique, 46(2), 765–790. https://doi.org/10.1111/caje.12031
- Ichev, R., & Marinč, M. (2018). Stock prices and geographic proximity of information: Evidence from the Ebola outbreak. International Review of Financial Analysis, 56, 153–166. https://doi.org/10.1016/j.irfa.2017.12.004
- Iqbal, N., Fareed, Z., Shahzad, F., He, X., Shahzad, U., & Lina, M. (2020). Nexus between covid-19, temperature and exchange rate in Wuhan city: New findings from partial and multiple wavelet coherence. The Science of the Total Environment, 729, 138916. https://doi.org/10.1016/j.scitotenv.2020.138916
- Li, Y., Zhang, Y., Zhao, X., & Tian, X. (2018). The influence of US and China’s CO2 transfer embodied in final consumption on global emission. Energy Procedia., 152, 835–840. https://doi.org/10.1016/j.egypro.2018.09.187
- Mirza, N., Hasnaoui, J. A., Naqvi, B., & Rizvi, S. K. A. (2020a). The impact of human capital efficiency on Latin American mutual funds during Covid-19 outbreak. Swiss Journal of Economics and Statistics, 156(1), 1–7. https://doi.org/10.1186/s41937-020-00066-6
- Mirza, N., Naqvi, B., Rahat, B., & Rizvi, S. K. A. (2020b). Price reaction, volatility timing and funds’ performance during Covid-19. Finance Research Letters, 36(101657), 101657. https://doi.org/10.1016/j.frl.2020.101657
- Mirza, N., Rahat, B., Naqvi, B., & Rizvi, S. K. A. (2020c). Impact of Covid-19 on corporate solvency and possible policy responses in the EU. The Quarterly Review of Economics and Finance. https://doi.org/10.1016/j.qref.2020.09.002
- Naeem, M. A., Bouri, E., Peng, Z., Shahzad, S. J. H., & Vo, X. V. (2021a). Asymmetric efficiency of cryptocurrencies during COVID19. Physica A: Statistical Mechanics and Its Applications, 565, 125562. https://doi.org/10.1016/j.physa.2020.125562
- Naeem, M. A., Farid, S., Ferrer, R., & Shahzad, S. J. H. (2021b). Comparative efficiency of green and conventional bonds pre-and during COVID-19: An asymmetric multifractal detrended fluctuation analysis. Energy Policy, 153, 112285. https://doi.org/10.1016/j.enpol.2021.112285
- Okorie, D. I., & Lin, B. (2020). Stock markets and the COVID-19 fractal contagion effects. Finance Research Letters, 38, 101640. https://doi.org/10.1016/j.frl.2020.101640.
- Pan, L., & Mishra, V. (2018). Stock market development and economic growth: Empirical evidence from China. Economic Modelling, 68, 661–673. https://doi.org/10.1016/j.econmod.2017.07.005
- Qureshi, F., Khan, H. H., Rehman, I. U., Ghafoor, A., & Qureshi, S. (2019). Mutual fund flows and investors' expectations in BRICS economies: Implications for international diversification. Economic Systems, 43(1), 130–150. https://doi.org/10.1016/j.ecosys.2018.09.003
- Qureshi, F., Qureshi, S., Shah, S. S., Rehman, I. U., & Shahzad, F. (2020a). Further evidence on co-movement between equity funds and business cycle variables in BRICS: A wavelet analysis. Borsa Istanbul Review, 20, S93–S102. https://doi.org/10.1016/j.bir.2020.10.011
- Qureshi, S., Qureshi, F., Soomro, A. B., Chandio, F. H., Shah, S. S., & Rehman, I. U. (2020b). Exchange rate risk and sectoral returns: A wavelet-based MRA-EDCC GARCH analysis. Communications in Statistics-Theory and Methods, 1–29. https://doi.org/10.1080/03610926.2020.1772304
- Rapach, D. E., Strauss, J. K., & Zhou, G. (2013). International stock return predictability: What is the role of the United States? The Journal of Finance, 68(4), 1633–1662. https://doi.org/10.1111/jofi.12041
- Rizvi, S. K. A. (2020). The impact of COVID-19 on valuations of non-financial European firms. SSRN 3705462.
- Rizvi, S. K. A., Mirza, N., Naqvi, B., & Rahat, B. (2020a). Covid-19 and asset management in EU: A preliminary assessment of performance and investment styles. Journal of Asset Management, 21(4), 281–291. https://doi.org/10.1057/s41260-020-00172-3
- Rizvi, S. K. A., Yarovaya, L., Mirza, N., & Naqvi, B. (2020b). The impact of COVID-19 on valuations of non-financial European firms. Retrieved from https://papers.ssrn.com/sol3/papers.cfm?abstract_id=3705462
- Shahzad, S. J. H., Naeem, M. A., Peng, Z., & Bouri, E. (2021). Asymmetric volatility spillover among Chinese sectors during COVID-19. International Review of Financial Analysis, 75, 101754. https://doi.org/10.1016/j.irfa.2021.101754
- Shanaev, S., & Ghimire, B. (2019). Is all politics local? Regional political risk in Russia and the panel of stock returns. Journal of Behavioral and Experimental Finance, 21, 70–82. https://doi.org/10.1016/j.jbef.2018.11.002
- Sharif, A., Aloui, C., & Yarovaya, L. (2020). Covid-19 pandemic, oil prices, stock market, geopolitical risk and policy uncertainty nexus in the US economy: Fresh evidence from the wavelet-based approach. International Review of Financial Analysis, 70, 101496. https://doi.org/10.1016/j.irfa.2020.101496
- Smirlock, M., & Yawitz, J. (1985). Asset returns, discount rate changes, and market efficiency. The Journal of Finance, 40 (4), 1141–1158. https://doi.org/10.1111/j.1540-6261.1985.tb02368.x
- Soares, M. J. (2011). Business cycle synchronization and the euro: A wavelet analysis. Journal of Macroeconomics, 33(3), 477–489.
- Sohrabi, C., Alsafi, Z., O’Neill, N., Khan, M., Kerwan, A., Al-Jabir, A., Iosifidis, C., & Agha, R. (2020). World health organization declares global emergency: A review of the 2019 novel coronavirus (covid-19). International Journal of Surgery (London, England), 76, 71–76. https://doi.org/10.1016/j.ijsu.2020.02.034
- Sugimoto, K., Matsuki, T., & Yoshida, Y. (2014). The global financial crisis: An analysis of the spillover effects on African stock markets. Emerging Markets Review, 21, 201–233. https://doi.org/10.1016/j.ememar.2014.09.004
- World Health Organization. (2020). Coronavirus disease (COVID-19) outbreak situation. Retrieved from https://www.who.int/emergencies/diseases/novelcoronavirus-2019
- Yarovaya, L. (2020a). COVID-19 Pandemic and Stress Testing the Eurozone Credit Portfolios. SSRN 3705474.
- Yarovaya, L. (2020b). The resilience of Islamic Equity Funds during COVID-19: Evidence from risk adjusted performance, investment styles and volatility timing. Investment Styles and Volatility Timing, November 25.
- Yarovaya, L., Mirza, N., Abaidi, J., & Hasnaoui, A. (2021). Human capital efficiency and equity funds’ performance during the COVID-19 pandemic. International Review of Economics & Finance, 71, 584–591. https://doi.org/10.1016/j.iref.2020.09.017
- Yarovaya, L., Mirza, N., Rizvi, S. K. A., & Naqvi, B. (2020a). COVID-19 Pandemic and Stress Testing the Eurozone Credit Portfolios. Retrieved from https://papers.ssrn.com/sol3/papers.cfm?abstract_id=3705474.
- Yarovaya, L., Mirza, N., Rizvi, S. K. A., Saba, I., & Naqvi, B. (2020b). The Resilience of Islamic Equity Funds during COVID-19: Evidence from Risk Adjusted Performance, Investment Styles and Volatility Timing. Investment Styles and Volatility Timing. Retrieved 25 November, 2020, from https://papers.ssrn.com/sol3/papers.cfm?abstract_id=3737689.
- Zhang, D., Guo, Y., Wang, Z., & Chen, Y. (2020a). The impact of US monetary policy on Chinese enterprises' R&D investment. Finance Research Letters, 35, 101301. https://doi.org/10.1016/j.frl.2019.09.016
- Zhang, D., Hu, M., & Ji, Q. (2020b). Financial markets under the global pandemic of covid-19. Finance Research Letters, 36, 101528. https://doi.org/10.1016/j.frl.2020.101528
- Zhang, D., Lei, L., Ji, Q., & Kutan, A. M. (2019). Economic policy uncertainty in the US and China and their impact on the global markets. Economic Modelling, 79, 47–56. https://doi.org/10.1016/j.econmod.2018.09.028