
 ?Mathematical formulae have been encoded as MathML and are displayed in this HTML version using MathJax in order to improve their display. Uncheck the box to turn MathJax off. This feature requires Javascript. Click on a formula to zoom.
Abstract
This study examines the volatility of China and the most advanced countries of the world stock markets due to the pandemic of COVID-19 using the TGARCH model. This research study presents empirical support for the TGARCH specification for explaining the daily time dependence in the rate of information arrival to the market for stocks traded on China stock market. Using the sample containing closing stock market returns from 05 January 2015 to 04 April 2020 of sample countries, we found that through the COVID-19, there is no significant impact of returns volatility coming from advanced countries towards the China stock market. Further, results state that China has a significant impact on explaining the volatility of the most advanced countries of the world (Switzerland, Sweden, Netherlands, and the UK) except the U.S.A. during COVID-19. We found no significant impact of China stock market returns on the U.S.A.'s volatility, but there is a presence of leverage effect during COVID −19.
1. Introduction
The economic impact of the COVID-19 announcement as a pandemic may be short-term. However, this shock wave could badly affect the stock market over the long term. We are facing one of the biggest pandemics in history that transferred across the world. Due to the pandemic's impact, investors and markets face a high degree of uncertainty regarding both the physical and financial. The latest COVID-19 outbreak results in extraordinary volatility around all the leading financial markets. This situation guided the World Health Organisation (WHO) to announce the COVID-19 pandemic. Starting from February 2020, several shock waves were noticed in stock markets due to the current outbreak. This causes a continued increase in financial volatility in the perspective of COVID-19 uncertainty. Albulescu (Citation2021) documented that the real economy is severely affected by this pre-pandemic period of COVID-19, which causes the fall of trade, tourism, and the transport industry and even generated local food shortages. In addition, the presence of stock market price bubbles, the impact of Covid-19 on the financial system could not be ignored.
Economic conditions, institutional issues, and market uncertainty can cause financial volatility (Hartwell, Citation2018). Announcements relating to macroeconomic issues also cause financial volatility. Onan et al. (Citation2014) provide evidence that good and bad both types of announcements asymmetrically cause financial volatility. Karnizova and Li (Citation2014) predict the U.S. recession using the interaction between EPU and stock market volatility, whereas Zhu et al. (Citation2019) explore the influence of the fear index on the U.S. stock market volatility. Many Economies around the world have been affected by deadly viruses and causes a huge human loss. These include Zika in 2016, Ebola and Measles in 2014, MERS in 2013, Cholera in 2010, Swine Flu in 2009, Dengue Fever and Avian Flu in 2006, SARS in 2003, and 2019 is the emergence of a new coronavirus (COVID −19). This deadliest virus belongs to the Coronaviruses' family, which is common in animals, which became a major danger to human life and the world's financial markets. Almost all 199 countries of the works are the victim of this deadly virus, and two international conveyances, i.e., Diamond Princes Cruise ship harboured in Japan and Holland America's MS Zaandam Cruise ship, are also most affected.
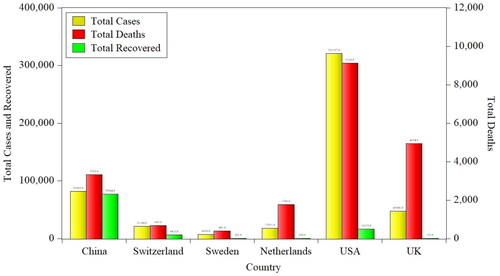
The present research aims to capture the dynamic response of shocks from one to another stock market. The analysis seeks to capture the effect of COVID-19 Shocks on China and then compare it with the most advanced Countries of the World, i.e., Switzerland, Sweden, Netherland, UK, and the U.S. Global Innovation Index 2019 (WIPO, Citation2019). presents the country-wise cases, deaths, and recovered patients of COVID-19 from 5 January 2020 to 4 April 2020. We can see that the total number of cases and deaths is falling most in the U.S.A., which affected more. After the U.S.A., the second most country affected by COVID-19 is the UK, in which the death rate exceeds the cases registered as COVID-19. Similarly, Sweden, Netherlands, and Switzerland fall in less-affected countries. The situation in China is positive, as it has a greater number of patients recovered from COVID-19.
Figure 1. Country-wise COVID-19 cases, deaths, and recovered patients.
Source: Author Estimation.
The main purpose of the research is to examine the co-integration relation and the transmission of shocks from China to the most advanced countries from Jan. 2020–Apr. 2020 in the period of the current pandemic. The indices used in the study are China Stock Market Index is (SSE Composite Index), Switzerland stock Market Index used is (Swiss Market Index), Sweden, Stock Market Index used is (OMX Stockholm 30), U.S.A., Stock Market Index used is (S&P500), Netherland, Stock Market Index used is (AEX index), UK, Stock Market Index used is (FTSE 100).
2. Literature review
We can find that many epidemic diseases caused a big human and financial loss around the world in history. The financial analyst has always been concerned about the economic and financial impact of these pandemics. The two important streams of finance literature that are important for this research study are discussed as under,
2.1. Pandemic and economic cost
Before the COVID-19 outbreak, Severe Acute Respiratory (SAR), Ebola, and Middle East Respiratory Syndrome were also worldwide pandemics. The 2014 outbreak of the Ebola virus in West Africa was more damaging than all preceding pandemics. However, the social cost of the virus outbreak was not captured by its economic burden estimates. Huber et al. (Citation2018) conduct a study to find the 2014 Ebola virus outbreak's economic and social burden in West Africa. Siu and Wong (Citation2004) estimated the first deadly disease of the 21st century, SARS' economic impacts on Hong Kong's economy. Rizvi et al. (Citation2020) findings show a significant loss in valuations across all sectors due to a possible decline in sales and increase in the cost of equity. In extreme cases, average firms in some sectors may lose up to 60% of their intrinsic value in one year. Mirza et al. (Citation2020) examine the possible policy interventions to sustain solvency at a pre-Covid-19 level. Their findings suggest that for a moderate deterioration in economic conditions, a tax deferral is sufficient. However, in exacerbating business shocks, there should be hybrid support through debt and equity to avoid a meltdown. Yarovaya et al. (Citation2020) findings Based on the macro and micro-level model specifications and using six distressed economic scenarios, indicate a significant deterioration in asset quality across exposure types, institutional size, and countries' profile. They document a substantial increase in the probability of default and a considerable reduction in capital adequacy across our sample.
A human capital loss is another major concern of an epidemic. In the long run, human destruction becomes a major hurdle for the economic progress of any economy. Barro and Sala-i-Martin (Citation1995) recognise that human capital is very important for the long-term growth of any economy. Bloom, et al. (Citation2001) state that the decrease in human capital affects economic growth negatively. Pandemics additionally aggressively influence labour efficiency by restricting the activities of the labourers and imposing restrictions on their movements due to lock down situation.
2.2. Pandemic and financial markets
Pandemic such as Severe Acute Repository Syndrome (SARS) outbreaks and Ebola virus outbreak has affected the stock markets around the world (Chen et al., Citation2007; Chen et al., Citation2018; Del Giudice & Paltrinieri, Citation2017; Goodell, Citation2020; Ichev & Marinč, 2018; Wang et al., Citation2013). Even So, the research on the scope to which pandemics affect stock returns is still scant.
We can start with the researchers’ centred on the impact of the current spread on the financial market. Evidence from literature shows that the COVID-19 effect on financial markets is devastating compared to other crises that spread in the past (Baker et al., Citation2020; Umar, Rizvi, et al., Citation2021; Zhang et al., Citation2020). This research studies that look at the impact of a pandemic on the stock market include (Pavlyshenko, Citation2020; Topcu & Gulal, Citation2020; Umar, Mirza, et al., Citation2021), studies that examine volatility (Albulescu, Citation2021; Cheng & Yao, Citation2021; Su, Huang, et al., Citation2021; Su, Sun, et al., Citation2021), researchers analysing liquidity includes (Haroon & Rizvi, Citation2020; Su, Qin, Tao, Shao, et al., Citation2020; Su, Qin, Tao, & Umar, Citation2020; Zaremba et al., Citation2020) studies exploring herding include (Kizys et al., Citation2021), papers looking at the fund flows Pástor and Vorsatz (Citation2020) or financial projections are examined by Bretscher et al. (Citation2020), Gormsen and Koijen (Citation2020) and Umar, Su, et al. (Citation2021).
For the operation of financial markets, volatility acts as a barometer of financial risk and financial uncertainty. Volatility is crucial to assess uncertainty surrounding investments in financial assets and, therefore, it is of huge interest to financial industry regulators, mutual fund manager and individual investors, and policymakers. Researchers had attempted to establish an association between the pandemic COVID-19 and the volatility of the financial market. Baker et al. (Citation2020) attempted to identify the impact of a current pandemic on stock market volatility. According to the study, the government limitations on commercial activity and restrictions on consumers are the major reasons for increased volatility. Zaremba et al. (Citation2020) conclude that if government response to COVID-19, it mitigates the international stock market volatility. They provide evidence of the countries where governments take severe measures to curtail the dispersion of COVID-19, which causes an increase in stock market volatility. Measures may include the information campaigns and the termination of large-scale public functions. In addition, Onali (Citation2020) reports that the U.S. stock market's volatility increases in response to the increase in positive cases and deaths.
Another associated category of research that assesses government action's influence on the stock market includes (Ashraf, Citation2020; Baig et al., Citation2021; Gao et al., Citation2021; Heyden & Heyden, Citation2020; Narayan et al., Citation2021). Ashraf (Citation2020) describes that the government announcements of social distancing have a negative effect on stock market returns due to their adverse effect on economic activity, while an indirect positive effect through the reduction in COVID-19 confirmed cases using data across 77 countries. Heyden and Heyden (Citation2020) study the short-term market reactions of U.S. and European stocks at the beginning of the COVID-19 pandemic. Authors conclude that stock returns respond negatively to the declarations of the country-specific fiscal policy measures, whereas market calm in response to the monetary policy measures. Phan and Narayan (Citation2020) look at the effect of government responses of G7 countries to the coronavirus pandemic on stock market returns. The study shows that lockdowns travel bans, and economic stimulus packages all had a positive effect on the stock markets. However, lockdowns were most effective in cushioning the effects of COVID-19.
Ramelli and Wagner's (Citation2020) early results recommend that the stock market quickly responds to concerns about the possible economic consequences of the novel coronavirus. In particular, the cross-section of stocks shows that the amplification of the COVID-19 shock through financial channels started to disturb the investors. The relationship between U.S. stock performance and real-time changes in COVID-19 infection projections is negative (Alfaro et al., Citation2020). Schoenfeld (Citation2020) research findings support that the pandemic prompted unprecedented changes in U.S. employment levels and the values of currencies, commodities, and bonds. Based on such findings, we can conclude that pandemics are systemically hurting financial markets.
Another stream of research focusing on the impact of the Pandemic worldwide is how the impact spread from one country to another. Ruiz Estrada (Citation2020) pinpointed the waves in which the pandemic can instantaneously affect major markets such as Taiwan, Hong Kong, South Korea, and Japan and show the declining growth of GDP of all these economies. Using data from the 12 most-affected countries Zhang et al. (Citation2020) map how the correlation between countries` stock markets before and after the Covid-19 crisis. The study results show that global financial market risks have increased substantially in response to the pandemic. The great uncertainty of the pandemic and its associated economic losses has caused markets to become highly volatile and unpredictable.
2.3. Theoretical framework
2.3.1. Black Swan theory
The Black Swan theory can be linked to sudden and unexpected events that can affect the stock market and commercial activities (A. A. Talib, Citation2001; B. A. Talib et al., Citation2007), discovering the then-novel black swan. Black Swan theory can be related to the emergence of Coronavirus that swamped the whole globe because of its unique nature. It has caused huge health and mortality rate as well spiralled into the world's stock markets. Black Swan Theory is used as a reference to relate those events that are highly unpredictable, and their effects on stock markets, money markets, and on the general economy are serious. As the Black Swan events are highly unpredictable, economic experts promote diversification of portfolios to mitigate the adverse effect of such incidents. The sudden outbreak of current COVID-19 bewildered and overwhelmed the world health experts, and even after many months of its emergence, no medicine has been found for a new virus that increased the rate of infection and deaths that caused the WHO to declare it a global pandemic. According to financial times, 2020, the associated effect of the pandemic has spiralled into different swings in the world's stock and money markets, causing depression among investors. Another reason for the stock market unpredictable volatility spikes is the closure and restrictions of the national border in the labour movement that has affected global supply chains.
2.3.2. Prospect theory
Kahneman and Tversky (Citation1979) established the Prospect theory, which emphasises that investors set and decide the portfolio under risk. Researchers advocate that investors avoid risk if they prefer investments with certain risk prospects in certain expected value. Prospect theory is centred around risk-averse investor's behaviour and anomalies, which explains the negative correlation between risk and return. Barberis et al. (Citation2016) and Beale et al. (Citation2019) also confirmed this phenomenon. Accordingly, prospect theory can be the explanation for the phenomenon for stock returns and pandemic negative relationship.
Based on the above-mentioned literature and theoretical background, the motivation for our study is to evaluate the behaviour of the financial market during the pandemic and compare the evidence with that of before the pandemic. The objective is to scrutinise the volatility of China stock market and the most advanced countries during the period of Covid − 19 in relevance with the period before the Pandemic. Investors and policymakers are eager to know how the stock market behaves in this different type of situation. For instance, policymakers are threatened with the choice between containing the virus and sustaining the economy. The study results can be source of information about the extent of the behaviour during the pandemic that will help determine how much sacrifice the relevant markets will have to endure to contain the virus. The findings are important for the smooth functioning of the stock market as it is believed that findings will unfold events during the pandemic and offer an area for future research.
3. Data and analysis
This study uses China and the most advanced countries of the world's stock market indices closing price data. These data were collected from Yahoo Finance website. The top 5 most advanced countries were selected according to the ranking of Global Innovation Index (GII), 2019 by the World Intellectual Property Organisation. The stock indices used are China Stock Market Index, SSE Composite Index, Swiss Market Index for Switzerland stock Market, MX Stockholm 30 for Sweden Stock Market Index, U.S.A., Stock Market Index used is S&P500, Netherland, Stock Market Index used is AEX index, UK, Stock Market Index used is FTSE 100.
The time frame of this study is 5 January 2012 − 3 April 2020, to capture the COVID-19 impact pandemic on stock returns of the full sample (05 January 2015 to 04 April 2020), before COVID-19 (05 January 2015 to 29 November 2019), and during COVID-19 (02 December 2019 to 03 April 2020).
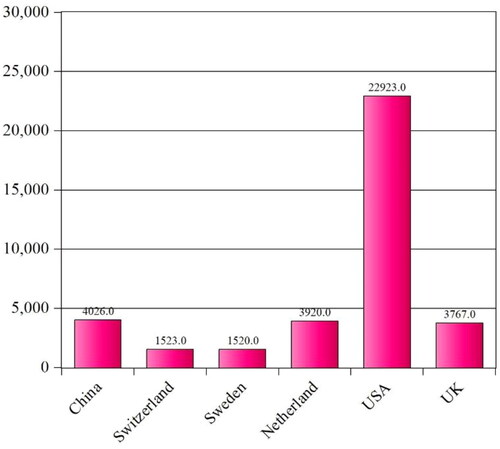
presents the market capitalisation of China and the most advanced countries' stock indices. We can see that the U.S.A. stock market has the largest market share of 22923 US$Billion, among other sample countries. After the U.S.A., China's market share is 4026 US$Billion. Similarly, Switzerland, Sweden, Netherlands, and UK stock market capitalisation are 1523 US$Billion, 1520 US$Billion, 3920 US$Billion, and 3767 US$Billion, respectively.Using the following formula, we first calculate the stock returns,
……………………………….……(1)
……………………………….……(1)
Figure 2. Market capitalization of China and the most advanced countries stock markets US$Billion.
Source: Author Estimation.
Were,
Return t = Daily stock returns of all the selected countries indices
ln = Natural log of daily stock prices
Rt = index Closing value at the day end
Rt-1 = index Closing value on the previous day
and explain the pattern of daily stock returns of all sample countries chosen for this study. At the end of 2019, the China and advanced countries stock markets were affected by a novel COVID-19 pandemic shock.
Figure 3. Stock returns of China and the most advanced countries stock markets indices (2015–2020).
Source: Author Estimation.
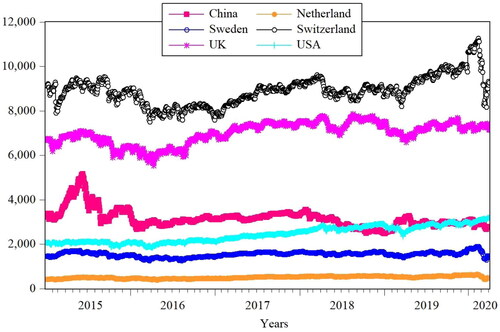
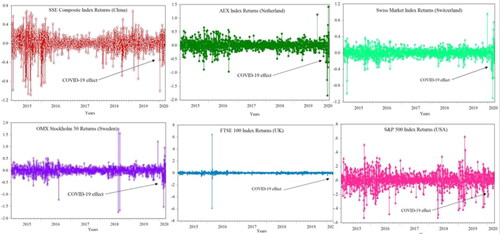
Figure 4. Stock returns of China and the sample countries stock markets indices COVID-19 effect.
Source: Author Estimation.
Similarly, demonstrated the volatility of the China and advanced countries' stock markets indices throughout 2015 to 2020. We can see that China, the U.S.A., Netherlands, and Switzerland have larger volatility in their stock indices since 2015, whereas Sweden and the UK have low volatility in their stock market indices.
3.1. Data analysis techniques
This study incorporates different types of data analysis techniques such as descriptive statistics, correlation matrix, Autoregressive Conditional Heteroscedasticity (ARCH) test, and Generalised Autoregressive Conditional Heteroscedasticity (GARCH), Threshold ARCH (TARCH) models. Descriptive statistics analysis helps us to overlook the data initially. The correlation matrix shows the correlation among different stock indices over the period. Finally, to achieve the purpose of the study, we perform the ARCH test, which is the first assumption to run the ARCH family models. If this assumption satisfies, then we can apply ARCH family models for our dataset.
The focus of the study is to look at the financial application of this novel COIVD-19 pandemic shock on the stock market's volatility of China and advanced countries of the world. The econometric test determines how the data is utilised to figure the mean and fluctuation of the return, restrictive on the past data. While numerous determinations have been considered for the mean return and have been utilised in the activities to gauge the future returns, essentially no techniques are accessible before presenting ARCH models. The essential clear instrument is the rolling standard deviation. The standard deviation was determined utilising a fixed number of the latest perceptions. For instance, each day, this could be determined utilising the latest month (22 days) of information. It is helpful to consider this the principal ARCH model; it accepts that the fluctuation of the upcoming return is a similarly weighted normal of the squared residuals from the most recent 22 days. The supposition of equivalent loads appears to be ugly as one would feel that the later occasions would be more pertinent and, in this way, ought to have higher loads. Besides, the presumption of zero loads for perceptions over one-month-old is likewise unpleasant. The ARCH model proposed by Engle (Citation1982) lets these loads be boundaries to be assessed. In this way, the model permitted the information to decide the best loads to estimate the change (Engle, Citation1982). They are presented by (Bollerslev's, Citation1986) GARCH model that simplifies this model. The GARCH model is an extension of the ARCH model. A GARCH model may have lesser boundaries contrasted with an ARCH model. The GARCH group of models have been consistently appeared to give more exact results, and, along these lines, the utilisation of the GARCH model has become the standard technique for displaying instability in monetary time arrangement information.
In the past, many pieces of research focused on investigating the co-integration among the stock indices of developed economies. Therefore, in this study, we applied ARCH family models to the daily stock returns of China and the most advanced country's stock markets to catch the volatility due to the COVID-19 pandemic shock. In this regard, we utilise GARCH models for observing the news elements in the sample time series data. The GARCH models also understand the different types of dynamic behaviours of stock markets due to the good or bad news (Khan et al., Citation2014).
To apply the GRACH family models (GARCH, EGARCH, TARCH), we first analyse our data and check the assumptions of applying GRACH family models. GARCH model measures the effect of any shock on the change that keeps on sending itself during the contiguous time span, as a bigger one trails a huge shock, and a more modest one trails a little shock. However, the process of the transmission of shocks is examined by the nonlinear specification (Clements Citation2005; Islam Citation1984). EGARCH model helps investigate the shock, which may emphatically impact the difference because a negative shock in the system causes more prominent misfortune in returns than the additions from a positive shock. At last, the TARCH model estimates the importance and relative commitment of negative shock in the system that destabilises fluctuation (Khan et al., Citation2014).
We run six estimation models under three parameters, i.e., full sample, sample before COVID-19, and sample during COVID-19, in the following manner:
Model 1 = China C and variance regressors most advanced countries (Switzerland, Sweden, UK, U.S.A., and the Netherlands)
Model 2 = Switzerland C and china
Model 3 = Sweden C and China
Model 4 = Netherland C and China
Model 5 = U.S.A. C and China
Model 6 = UK C and China
The various reasons for instability in the stock returns have been clarified from the overall system of the internal theories of the business cycle, and out of which, the multiplier acceleration theory proposed by Samuelson (Citation1939) has acquired prominence. It has been seen that the expected value of stochastic term µt is the time-varying in the volatile stock market. Subsequently, demonstrating return arrangement in such a market requires a logical structure that can adapt to deviations in stock returns. For this reason, in the wake of fulfilling the presumption for choosing the suitable model, we adopt TARCH model estimations proposed by Glosten et al. (Citation1993) and Zakoian (Citation1994).
The TARCH model is more powerful than the ARCH and GARCH models. Both specifications are symmetric as both positive and negative shocks of a similar size are blessed to receive have a similar impact by the square of the residuals. The TGARCH model, then again, is equipped for checking for any genuinely critical distinction between when the stock is positive and when it is negative. TARCH model works by including dummy variables in the variance equation of the model (Asteriou & Hall, Citation2015). We estimate the TGARCH (1) model in the following form:
………………………….……(2)
………………………….……(2)
………….……(3)
………….……(3)
where EquationEquations (1)
……………………………….……(1)
……………………………….……(1) and Equation(2)
………………………….……(2)
………………………….……(2) above show the original form of the TARCH. There are two equations of the TARCH model (Mean and Variance equations).
EquationEquation (1)……………………………….……(1)
……………………………….……(1) , shows the mean equation of the TARCH model in which the ordinary least square (OLS) model is incorporated in the autoregressive form for stock returns. EquationEquation (2)
………………………….……(2)
………………………….……(2) demonstrates the variance equation of the TARCH model that incorporates the time-varying behaviour of µt. In this equation, γ, α, β, and δ are the parameters of the model that has to be estimated. The parameter r, β, must be significant and positive for testing the irregularities in the news. Either the case may be, the bad news has a larger effect on the volatility of the series than good news. The dummy variable used in this variance equation is ζt, which shows 1 for ut ˂ 0, 0 when ut >0 so that ‘good news’ and ‘bad news’ have a changing impact.
4. Results and discussion
The sample period of this study is further divided into three sub-periods: full sample (05 January 2015 to 04 April 2020), before COVID-19 (05 January 2015 to 29 November 2019), and during COVID-19 (02 December 2019 to 03 April 2020). Overall, the full sample period (05 January 2015 to 04 April 2020) was chosen to capture the impact and dynamic relationship among China's stock market and the world's most advanced countries, and the COVID-19 pandemic. The rationale behind choosing the large sample is to obtain reliable results in estimating our TARCH model. If we incorporate more time periods before the event in the model, and the greater the difference, the more significant possible influence on the spill over effects.
4.1. Results of descriptive statistics and correlation matrix
describe the summary statistics of the sample data. The whole dataset contains 1269 observations, and the average value of China stock returns for five years period is 3157.799, and similarly, the Netherlands has 501.7646, Sweden has 1543.907, Switzerland has 8904.371, the UK has 7000.836, and finally, the U.S.A. stock market index has 2440.508 mean index value. The results also show that the standard deviation is larger in Switzerland, the UK, the U.S.A., and China compared to Sweden and Netherlands in the full sample.
Table 1. Descriptive statistics of the full sample (05 January 2015 to 04 April 2020).
Table 2. Descriptive statistics of the sample before COVID-19 (05 January 2015 to 29 November 2019).
Table 3. Descriptive statistics of the sample during COVID-19 (02 December 2019 to 03 April 2020).
displays a summary of statistics of China and the most advanced countries of the world before the COVID-19 pandemic. It contains a sample of 1187 observations, and the average values of stock returns of China, Netherlands, Sweden, Switzerland, the UK, and the U.S.A. are 3172.928, 497.281, 1535.090, 8821.743, 6982.499, 2399.614, respectively. Before COVID-19, the standard deviation of stock markets is the same as in the full sample, i.e., larger in Switzerland, UK, U.S.A., and China and smaller in Netherlands and Switzerland. presents the descriptive statists of sample data during COVID-19, and it includes 82 observations. The results show that variations and stock markets during COVID-19 are greater in Switzerland with 841.7335, China 118.7112, Sweden 172.3936 and less in UK 95.1435 and U.S.A. with a standard deviation of 88.8467.
The results of the correlation matrix of the sample countries' stock marks are given in . The results show that the stock market of the Netherland has a slight correlation with Sweden, Switzerland UK, and the U.S.A. in the whole sample and sample before COVID-19, whereas, during the COVID-19 pandemic, China's stock return is correlated with Netherlands, Switzerland, and Sweden. Similarly, Netherlands' stock market is correlated with Sweden and Switzerland, and finally, the Sweden stock market shows a positive correlation with the Switzerland stock market during COVID-19.
Table 4. Correlation matrix of the full sample (05 January 2015 to 04 April 2020).
Table 5. Correlation matrix of the sample before COVID-19 (05 January 2015 to 29 November 2019).
Table 6. Correlation matrix of the sample during COVID-19 (02 December 2019 to 03 April 2020).
4.2. Results of model selection (ARCH, GARCH, EGARCH, and TARCH)
To apply the ARCH family models, first, we test the assumptions of the dataset. There are two ways to test the assumptions of applying ARCH family models. The first one is testing the clustered volatility of stock returns by using the plotting of the residuals. Second, to check the existence of the ARCH effect (Gouriéroux Citation2012). The ARCH impact can be tried in pre-assessment and just as post-assessment examination. Post-assessment checks the remaining ARCH impact, for example, regardless of whether restrictive heteroscedasticity has been taken out. For that purpose, it is applied to standardised residuals of the fitted model called the LM-test for the ARCH impact in the residuals (Engle Citation1982). The normality tests are used to check the behaviour of the ARCH effect if normality can be described by conditional error distribution.
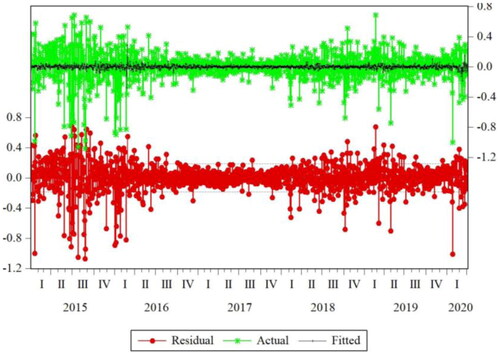
demonstrates the graph of residuals of the ARCH model to test the clustered volatility in the dataset. It shows the residuals and the fluctuation of the residuals over the period. We can see that the period of low volatility trends in stock markets to be trailed by the time of lower unpredictability for a delayed period and, the time of high instability followed by the times of high unpredictability for a drawn-out period, both situations happen at the same time, so we can say that assumption of running GARCH models is satisfied Miles, (2011).
Figure 5. Residuals plot for testing the volatility clustering.
Source: Author Estimation.
For robustness, we use the ARCH effect test. The null hypothesis of the ARCH effect test is ‘There is no ARCH effect’. shows the outcome of the ARCH effect test, and we can see that the Prob. value of observed R squared is < 0.05, which rejects the null hypotheses and accepts the alternate hypotheses, and that is ‘There is ARCH effect’ Bera and Higgins (Citation1993).
Table 7. ARCH test for the testing ARCH effect.
4.2.1. Estimations of GARCH model
To estimate the suitable GARCH model, we follow the technique for the model selection. The data rules depend on the assessment of the Kullback--Leibler data measure (Sin & White, Citation1996) and are common speculations of the standard rules, yet considering the heteroscedastic idea of the information that more boundaries are assessed for AR-GARCH models than for AR models. The most mainstream measures for choosing the proper GARCH model are the Akaike data rule (AIC) and Schwarz Information Criterion (SIC), and HQIC (Hannan-Quinn data basis). The point is to track down the model with the least worthy of the chose data standard (Lin & Dayton, Citation1997).
describe different GARCH models with different parameters (GARCH, EGARCH, and TARCH) to find the best appropriate model for data analysis. The results show that the model estimated in (TARCH) has the lowest AIC value, i.e., −0.97002, so the TARCH model is more appropriate for achieving the instability of stock markets due to the novel COVID-19 pandemic. The TARCH model measures the significance and proportional contribution of a negative shock that destabilises the variance Khan et al. (Citation2014). Our study finds the negative shock from China towards the most advanced countries globally, so the TARCH model is most suitable for our analysis.
Table 8. Results of the GARCH model.
Table 9. Results of the EGARCH model.
Table 10. Results of the TARCH model.
4.3. Results of TARCH models
The SEARCH model is estimated in six parameters to determine the volatility of the most advanced countries' stock markets indices due to the COVID-19 pandemic shock transmitted from China stock market. We estimate model 1 by putting dependent variables China stock market and variance regressors as advanced countries. In model 2, Switzerland is the dependent variable, and the variance regressor is China stock market. In model 3, Sweden's stock market returns are the dependent variable, and the variance regressor is China's stock market. Similarly, in models 4, 5, 6, the dependent variable is Netherland, U.S.A., UK, and the China stock market variance regressor. Each model has three parameters (full sample, before COVID-19 and sample during COVID-19). The estimations of six estimated TARCH presented from .
Table 11. TARCH results of model 1 full sample (05 January 2015 to 04 April 2020).
Table 12. TARCH results of model 1 before COVID-19 (05 January 2015 to 29 November 2019).
Table 13. TARCH results of model 1 during COVID-19 (02 December 2019 to 03 April 2020).
Table 14. TARCH results of model 2 full sample (05 January 2015 to 04 April 2020).
Table 15. TARCH results of model 2 before COVID-19 (05 January 2015 to 29 November 2019).
Table 16. TARCH results of model 2 during COVID-19 (02 December 2019 to 03 April 2020).
Table 17. TARCH results of model 3 full sample (05 January 2015 to 04 April 2020).
Table 18. TARCH results of model 3 before COVID-19 (05 January 2015 to 29 November 2019).
Table 19. TARCH results of model 3 during COVID-19 (02 December 2019 to 03 April 2020).
Table 20. TARCH results of model 4 full sample (05 January 2015 to 04 April 2020).
Table 21. TARCH results of model 4 before COVID-19 (05 January 2015 to 29 November 2019).
Table 22. TARCH results of model 4 during COVID-19 (02 December 2019 to 03 April 2020).
Table 23. TARCH results of model 5 full sample (05 January 2015 to 04 April 2020).
Table 24. TARCH results of model 5 before COVID-19 (05 January 2015 to 29 November 2019).
Table 25. TARCH results of model 5 during COVID-19 (02 December 2019 to 03 April 2020).
Table 27. TARCH results of model 6 full sample (05 January 2015 to 04 April 2020).
Table 28. TARCH results of model 6 before COVID-19 (05 January 2015 to 29 November 2019).
Table 29. TARCH results of model 6 during COVID-19 (02 December 2019 to 03 April 2020).
4.3.1. Results of TARCH model 1
shows the result of model 1 that is estimated for capturing the volatility of China stock market due to the shock in the financial system during the COVID-19 pandemic. the analysis is conducted for full sample and model estimations show that ARCH and GARCH term in the model is significant to explain the volatility of stock markets. The variance equation results show that only the UK and U.S.A. significantly explain China's volatility in the full sample. shows the results before COVID-19, which shows that ARCH and GARCH terms are significant, and only the U.S.A. stock market is significant in explaining the volatility of the China stock market before the COVID-19 shock. shows the model 1 results during the COVID-19 pandemic and states that ARCH and GARCH terms are not significant, and during COVID-19, only U.S.A. stock market is significant in explaining the volatility in China stock market.
4.3.2. Results of TARCH model 2
reported the results of model 2 in which the dependent variable is the Switzerland stock market and the variance regressor is the China stock market. Results show that the ARCH and GARCH terms are significant in the full sample, while China stock returns are insignificant. Before COVID-19 sample same ARCH and GARCH terms are significant, while China stock returns are insignificant. While during the COVID-19 sample, the ARCH term is insignificant and GARCH terms significant, and China stock market returns significantly impact the volatility of Switzerland stock market returns.
4.3.3. Results of TARCH model 3
Model 3 results are reported in below, in which the dependent variable is Sweden stock returns, and the variance regressor is the China stock returns. The results show that ARCH and GARCH terms are significant in the full sample, and China's stock return has significantly impacted the volatility of Sweden's stock returns. Before COVID-19 and during samples, the results show that the ARCH term is insignificant and the GARCH term is significant in both scenarios, and China has a significant impact on the volatility of the Sweden stock returns.
4.3.4. Results of TARCH model 4
Model 4 results are reported in , in which the dependent variable is Netherland stock returns, and variance regressor is China stock returns. The results show that in the full sample and before the COVID-19 sample, the ARCH and GARCH terms are significant, and China stock returns are also significant, while during the COVID-19 sample, the ARCH term is insignificant and the GARCH term is insignificant and the same in this case China stock returns significantly impact the volatility of Sweden stock returns.
4.3.5. Results of TARCH model 5
Model 5 results are reported in , in which the dependent variable U.S.A. stock returns and variance regressor is China stock returns. The results show that ARCH and GARCH terms are significant in the full sample, and China stock returns are significant. Before the COVID-19 sample, the ARCH term is insignificant, while the GARCH term and China stock returns are significant. During the COVID-19 sample, The ARCH and GARCH both terms are significant, while China stock returns cause no volatility of U.S.A. stock returns.
4.3.6. Results of TARCH model 6
Finally, model 6 results can be seen from , in which the dependent variable is UK stock returns and the variance regressor is the China stock returns. The results show that in all three scenarios, the ARCH term is insignificant. However, the GARCH term is significant, and China's market returns significantly impact the volatility of UK stock market returns in full, before and during the COVID-19 sample.
5. Conclusion and policy implications
This study examines the volatility of China and the most advanced countries of the world stock markets due to the pandemic of COVID-19 for the period of 2015 to 2020. The period for a sample is further divided into three parts, full, before, and during the COVID-19 sample. The study provides empirical support for the TGARCH specification for explaining the daily time dependence in the rate of information arrival to the market for stocks traded on China stock market. This study concludes that in model 1, in which we estimate the impact of the stock returns volatility of advanced countries on China stock market, findings of the full sample and COVID-19 sample, only U.S.A. significantly explain the volatility in China stock market returns. While during the COVID-19 period, there is no significant impact of stock returns volatility communing from advanced countries towards China stock market return. In model 2, we find that in full and before the COVID-19 sample, no significant impact of China stock returns on Switzerland stock returns is seen, but there is a persistence of positive leverage effect in both cases. The leverage effect means that a positive shock has less effect on the conditional variance (Switzerland stock returns) as compared to a negative shock or news. It means that the good news or shock or error generates less variance or volatility than the bad news (COVID-19 pandemic news). During the COVID-19 sample, the China stock returns significantly impact, explaining the volatility of Switzerland stock market returns. The existence of free trade between China and Switzerland well explains the reason for shock transfer. Model 3 results capture the Sweden and China impact of stock returns volatility, in which we find that China stock returns significantly explain the Sweden stock returns volatility in all three scenarios, but the leverage effect exists in the only full sample and before the COVID-19 sample. In the Netherlands model (model 4), we find the same results as in the case of Sweden, in which China stock returns have a significant impact on explaining the volatility of Netherlands stock market returns. In the U.S.A. (model 5), we find that China has a significant impact on explaining the stock market volatility of the U.S.A. stock market in full and before the COVID-19 sample with a positive leverage effect. While during the COVID-19 sample, we find that China stock returns do not significantly impact U.S.A. stock returns, but leverage effect can be seen in this case. Finally, in the UK model (model 6), we find no leverage effect in all three scenarios but the full sample, before COVID-19 and during COVID-19 sample, China stock returns have a significant impact on explaining the stock markets returns volatility of the UK stock market. The study results expose that the volatility in selected countries indices has increased due to the pandemic situation. Findings of Tripathy (Citation2017), Mishra (Citation2017), Ahmad et al. (Citation2018), and Chaudhary et al. (Citation2020) support the findings of this study.
5.1. Policy implication
This study supports prospect theory, a well-known theory of markets. According to the theory, people are more scared of failure than the benefit inspires them. We can state that if people are given two alternate choices, they will select a minimum chance of loss despite the alternate that has more chance of gains. Likewise, in pandemics, the investors will participate in stocks that show less volatility caused by the current pandemic. This study provides important implications for the policymakers of advanced and other countries where the current pandemic gives shock to the entire financial markets. First, due to a disturbing situation in almost all the countries because of the outbreak of COVID-19, this study illustrates the functions of transmission of shocks among the major stock indices. Second, this study describes the usefulness of the TARCH model, which is one of the GRACH family models an advanced level of time series analysis. That model looks at how markets are interconnected and communicates shocks from one economy to another economy. Finally, this study is primarily for policymakers of the world's most advanced countries, for formulating their countries' economic and innovation policies. This can be done by analysing the co-movements of the correlated stock indices and market variations. This research recommends that health policies be executed during the pandemic to restrict the spread of deadly disease, and macroeconomic policies can also be the target to minimise the financial and economic losses. Portfolio managers can also take advantage of the research findings for creating a superior portfolio to receive better accomplishment.
Disclosure statement
No potential conflict of interest was reported by the author(s).
Correction Statement
This article has been republished with minor changes. These changes do not impact the academic content of the article.
References
- Ahmad, M., Khan, Z., Ur Rahman, Z., & Khan, S. (2018). Does financial development asymmetrically affect CO2 emissions in China? An application of the nonlinear autoregressive distributed lag (NARDL) model. Carbon Management, 9(6), 631–644. https://doi.org/10.1080/17583004.2018.1529998
- Albulescu, C. T. (2021). COVID-19 and the United States financial markets’ volatility. Finance Research Letters, 38, 101699. https://doi.org/10.1016/j.frl.2020.101699
- Alfaro, L., Chari, A., Greenland, A. N., & Schott, P. K. (2020). Aggregate and firm-level stock returns during pandemics, in real-time (0898-2937). NBER Working Papers, 26950.
- Ashraf, B. N. (2020). Economic impact of government interventions during the COVID-19 pandemic: International evidence from financial markets. Journal of Behavioral and Experimental Finance, 27, 100371. https://doi.org/10.1016/j.jbef.2020.100371
- Asteriou, D., & Hall, S. G. (2015). Applied econometrics. Macmillan International Higher Education.
- Baig, A. S., Butt, H. A., Haroon, O., & Rizvi, S. A. R. (2021). Deaths, panic, lockdowns and US equity markets: The case of COVID-19 pandemic. Finance Research Letters, 38, 101701. https://doi.org/10.1016/j.frl.2020.101701
- Baker, S. R., Bloom, N., Davis, S. J., Kost, K. J., Sammon, M. C., & Viratyosin, T. (2020). The unprecedented stock market impact of COVID-19. National Bureau of Economic Research.
- Barberis, N., Mukherjee, A., & Wang, B. (2016). Prospect theory and stock returns: An empirical test. Review of Financial Studies, 29(11), 3068–3107. https://doi.org/10.1093/rfs/hhw049
- Barro, R., Mankiw, N., & Sala-I-Martin, X. (1995). Capital mobility in neoclassical models of growth. The American Economic Review, 85(1), 103–115. Retrieved June 14, 2021, from http://www.jstor.org/stable/2117998
- Beale, N. C., Gunton, R. M., Bashe, K. L., Battey, H. S., & MacKay, R. S. (2019). Dynamics of value-tracking in financial markets. ArXiv Preprint ArXiv:1903.09898.
- Bera, A. K., & Higgins, M. L. (1993). ARCH models: properties, estimation, and testing. Journal of Economic Surveys, 7(4), 305–366.
- Bloom, D., Canning, D., & Sevilla, J. P. (2001). The effect of health on economic growth: theory and evidence (0898-2937). No 8587, NBER Working Papers, National Bureau of Economic Research, Inc.
- Bollerslev, T. (1986). Generalized autoregressive conditional heteroskedasticity. Journal of Econmetrics, 31(3), 307–327.
- Bretscher, L., Hsu, A., Simasek, P., & Tamoni, A. (2020). COVID-19 and the cross-section of equity returns: Impact and transmission. The Review of Asset Pricing Studies, 10(4), 705–741. https://doi.org/10.1093/rapstu/raaa017
- Chaudhary, R., Bakhshi, P., & Gupta, H. (2020). Volatility in international stock markets: An empirical study during COVID-19. Journal of Risk and Financial Management, 13(9), 208. https://doi.org/10.3390/jrfm13090208
- Chen, M. H., Jang, S. S., & Kim, W. G. (2007). The impact of the SARS outbreak on Taiwanese hotel stock performance: An event-study approach. International Journal of Hospitality Management, 26(1), 200-212.
- Chen, M. P., Lee, C. C., Lin, Y. H., & Chen, W.Y. (2018). Did the SARS epidemic weaken the integration of Asian stock markets? Evidence from smooth time-varying cointegration analysis. Economic Research-Ekonomska Istraživanja, 31(1), 908–926.
- Cheng, Y., & Yao, X. (2021). Carbon intensity reduction assessment of renewable energy technology innovation in China: A panel data model with cross-section dependence and slope heterogeneity. Renewable and Sustainable Energy Reviews, 135, 110157. https://doi.org/10.1016/j.rser.2020.110157
- Clements, M. P. (2005). Evaluating econometric forecasts of economic and financial variables. Springer.
- Del Giudice, A., & Paltrinieri, A. (2017). The impact of the Arab Spring and the Ebola outbreak on African equity mutual fund investor decisions. Research in International Business and Finance, 41, 600–612.
- Engle, R. F. (1982). Autoregressive conditional heteroscedasticity with estimates of the variance of United Kingdom inflation. Econometrica, 50(4), 987–1007. https://doi.org/10.2307/1912773
- Gao, X., Ren, Y., & Umar, M. (2021). To what extent does COVID-19 drive stock market volatility? A comparison between the U.S. and China. Economic Research-Ekonomska Istraživanja, 0(0), 1–21. https://doi.org/10.1080/1331677X.2021.1906730
- Goodell, J. W. (2020). COVID-19 and finance: Agendas for future research. Finance Research Letters, 35, 101512.
- Glosten, L. R., Jagannathan, R., & Runkle, D. E. (1993). On the relation between the expected value and the volatility of the nominal excess return on stocks. The Journal of Finance, 48(5), 1779–1801. https://doi.org/10.1111/j.1540-6261.1993.tb05128.x
- Gormsen, N. J., & Koijen, R. S. (2020). Coronavirus: Impact on stock prices and growth expectations. The Review of Asset Pricing Studies, 10(4), 574–597. https://doi.org/10.1093/rapstu/raaa013
- Gouriéroux, C. (2012). ARCH models and financial applications: Springer Science & Business Media.
- Haroon, O., & Rizvi, S. A. R. (2020). COVID-19: Media coverage and financial markets behavior—A sectoral inquiry. Journal of Behavioral and Experimental Finance, 27, 100343. https://doi.org/10.1016/j.jbef.2020.100343
- Hartwell, C. (2018). The impact of institutional volatility on financial volatility in transition economies. Journal of Comparative Economics, 46(2), 598–615.
- Heyden, K. J., & Heyden, T. (2020). Market reactions to the arrival and containment of COVID-19: An event study. Finance Research Letters, 38, 101745. https://doi.org/10.1016/j.frl.2020.101745
- Huber, C., Finelli, L., & Stevens, W. (2018). The economic and social burden of the 2014 Ebola outbreak in West Africa. The Journal of Infectious Diseases, 218(5), 698–704. https://doi.org/10.1093/infdis/jiy213
- Islam, S. (1984). Devaluation, stabilization policies and the developing countries: A macroeconomic analysis. Journal of Development Economics, 14(1), 37–60. https://doi.org/10.1016/0304-3878(84)90042-7
- Kahneman, D., & Tversky, A. (1979). Prospect theory: An analysis of decisions under uncertainty. Econometrica, 47(2), 263–291. https://doi.org/10.2307/1914185
- Karnizova, L., & Li, J. (2014). Economic policy uncertainty, financial markets and probability of US recessions. Economics Letters, 125(2), 261–265.
- Khan, A. J., Azim, P., & Syed, S. H. (2014). The impact of exchange rate volatility on trade: A panel study on Pakistan’s trading partners. The Lahore Journal of Economics, 19(1), 31–66. https://doi.org/10.35536/lje.2014.v19.i1.a2
- Khan, A. N., En, X., Raza, M. Y., Khan, N. A., & Ali, A. (2020). Sectorial study of technological progress and CO2 emission: Insights from a developing economy. Technological Forecasting and Social Change, 151, 119862. https://doi.org/10.1016/j.techfore.2019.119862
- Khan, H., Khan, I., & Binh, T. T. (2020). The heterogeneity of renewable energy consumption, carbon emission and financial development in the globe: A panel quantile regression approach. Energy Reports, 6, 859–867. https://doi.org/10.1016/j.egyr.2020.04.002
- Kizys, R., Tzouvanas, P., & Donadelli, M. (2021). From COVID-19 herd immunity to investor herding in international stock markets: The role of government and regulatory restrictions. International Review of Financial Analysis, 74, 101663. https://doi.org/10.1016/j.irfa.2021.101663
- Lin, T. H., & Dayton, C. M. (1997). Model selection information criteria for non-nested latent class models. Journal of Educational and Behavioral Statistics, 22(3), 249–264. https://doi.org/10.3102/10769986022003249
- Mirza, N., Rahat, B., Naqvi, B., & Rizvi, S. K. A. (2020). Impact of Covid-19 on corporate solvency and possible policy responses in the EU. The Quarterly Review of Economics and Finance. https://www.sciencedirect.com/science/article/abs/pii/S1062976920301125?via%3Dihub
- Mishra, S. (2017). Volatility and calendar anomaly through GARCH model: Evidence from the selected G20 stock exchanges. International Journal of Business and Globalisation, 19(1), 126–144. https://doi.org/10.1504/IJBG.2017.085105
- Narayan, P. K., Phan, D. H. B., & Liu, G. (2021). COVID-19 lockdowns, stimulus packages, travel bans, and stock returns. Finance Research Letters, 38, 101732. https://doi.org/10.1016/j.frl.2020.101732
- Onali, E. (2020). COVID-19 and stock market volatility. https://papers.ssrn.com/sol3/papers.cfm?abstract_id=3571453
- Onan, M., Salih, A., & Yasar, B. (2014). Impact of macroeconomic announcements on implied volatility slope of SPX options and VIX. Finance Research Letters, 11(4), 454–462.
- Pástor, Ľ., & Vorsatz, M. B. (2020). Mutual fund performance and flows during the COVID-19 crisis. The Review of Asset Pricing Studies, 10(4), 791–833. https://doi.org/10.1093/rapstu/raaa015
- Pavlyshenko, B. M. (2020). Regression approach for modeling COVID-19 spread and its impact on stock market. ArXiv Preprint ArXiv:2004.01489.
- Phan, D. H. B., & Narayan, P. K. (2020). Country responses and the reaction of the stock market to COVID-19—A preliminary exposition. Emerging Markets Finance and Trade, 56(10), 2138–2150. https://doi.org/10.1080/1540496X.2020.1784719
- Ramelli, S., & Wagner, A. (2020). What the stock market tells us about the consequences of COVID-19. Mitigating the COVID Economic Crisis. https://voxeu.org/article/what-stock-market-tells-us-about-consequences-covid-19
- Rizvi, S. K. A., Mirza, N., Naqvi, B., & Rahat, B. (2020). Covid-19 and asset management in EU: A preliminary assessment of performance and investment styles. Journal of Asset Management, 21(4), 281–291. https://doi.org/10.1057/s41260-020-00172-3
- Ruiz Estrada, M. A. (2020). Economic Waves: The Effect of the Wuhan COVID-19 On the World Economy (2019-2020). https://papers.ssrn.com/sol3/papers.cfm?abstract_id=3545758
- Samuelson, P. A. (1939). Interactions between the multiplier analysis and the principle of acceleration. The Review of Economics and Statistics, 21(2), 75–78. https://doi.org/10.2307/1927758
- Schoenfeld, J. (2020). The invisible risk: Pandemics and the financial markets. https://papers.ssrn.com/sol3/papers.cfm?abstract_id=3567249
- Sin, C.-Y., & White, H. (1996). Information criteria for selecting possibly misspecified parametric models. Journal of Econometrics, 71(1-2), 207–225. https://doi.org/10.1016/0304-4076(94)01701-8
- Siu, A., & Wong, Y. C. R. (2004). Economic impact of SARS: The case of Hong Kong. Asian Economic Papers, 3(1), 62–83.
- Su, C.-W., Huang, S.-W., Qin, M., & Umar, M. (2021). Does crude oil price stimulate economic policy uncertainty in BRICS? Pacific-Basin Finance Journal, 66, 101519. https://doi.org/10.1016/j.pacfin.2021.101519
- Su, C.-W., Qin, M., Tao, R., Shao, X.-F., Albu, L. L., & Umar, M. (2020). Can Bitcoin hedge the risks of geopolitical events? Technological Forecasting and Social Change, 159, 120182. https://doi.org/10.1016/j.techfore.2020.120182
- Su, C.-W., Qin, M., Tao, R., & Umar, M. (2020). Financial implications of fourth industrial revolution: Can bitcoin improve prospects of energy investment? Technological Forecasting and Social Change, 158, 120178. https://doi.org/10.1016/j.techfore.2020.120178
- Su, C.-W., Sun, T., Ahmad, S., & Mirza, N. (2021). Does institutional quality and remittances inflow crowd-in private investment to avoid Dutch Disease? A case for emerging seven (E7) economies. Resources Policy, 72, 102111. https://doi.org/10.1016/j.resourpol.2021.102111
- Talib, A. A. (2001). The continuing behavioural modification of academics since the 1992 research assessment exercise. Higher Education Review, 33(3), 30–46.
- Talib, B. A., Jani, M. F. M., Mamat, M. N., & Zakaria, R. (2007). Impact assessment of liberalizing trade on Malaysian crude palm oil. Oil Palm Industry Economic Journal, 7(1), 9–17.
- Topcu, M., & Gulal, O. S. (2020). The impact of COVID-19 on emerging stock markets. Finance Research Letters, 36, 101691. https://doi.org/10.1016/j.frl.2020.101691
- Tripathy, N. (2017). Do BRIC countries stock market volatility move together? An empirical analysis of using multivariate GARCH models. International Journal of Business and Emerging Markets, 9(2), 104–123. https://doi.org/10.1504/IJBEM.2017.083353
- Umar, M., Mirza, N., Rizvi, S. K. A., & Furqan, M. (2021b). Asymmetric volatility structure of equity returns: Evidence from an emerging market. The Quarterly Review of Economics and Finance. https://doi.org/10.1016/j.qref.2021.04.016
- Umar, M., Rizvi, S. K. A., & Naqvi, B. (2021). Dance with the devil? The nexus of fourth industrial revolution, technological financial products and volatility spillovers in global financial system. Technological Forecasting and Social Change, 163, 120450. https://doi.org/10.1016/j.techfore.2020.120450
- Umar, M., Su, C.-W., Rizvi, S. K. A., & Shao, X.-F. (2021). Bitcoin: A safe haven asset and a winner amid political and economic uncertainties in the US? Technological Forecasting and Social Change, 167, 120680. https://doi.org/10.1016/j.techfore.2021.120680
- Wang, Y. H., Yang, F. J., & Chen, L. J. (2013). An investor’s perspective on infectious diseases and their in fluence on market behavior. Journal of Business Economics and Management, 14(sup1), S112–S127.
- WIPO. (2019). Global Innovation Index 2019. Retrieved from https://www.wipo.int/publications/en/details.jsp?id=4434
- Yarovaya, L., Mirza, N., Rizvi, S. K. A., & Naqvi, B. (2020). COVID-19 pandemic and stress testing the eurozone credit portfolios. Available at SSRN 3705474. http://dx.doi.org/10.2139/ssrn.3705474
- Zakoian, J.-M. (1994). Threshold heteroskedastic models. Journal of Economic Dynamics and Control, 18(5), 931–955. https://doi.org/10.1016/0165-1889(94)90039-6
- Zaremba, A., Aharon, D. Y., Demir, E., Kizys, R., & Zawadka, D. (2020). COVID-19, government policy responses, and stock market liquidity around the world: A note. Research in International Business and Finance, 56, 101359. https://doi.org/10.1016/j.ribaf.2020.101359
- Zhang, D., Hu, M., & Ji, Q. (2020). Financial markets under the global pandemic of COVID-19. Finance Research Letters, 36, 101528. https://doi.org/10.1016/j.frl.2020.101528
- Zhu, S., Liu, Q., Wang, Y., Wei, Y., & Wei, G. (2019). Which fear index matters for predicting US stock market volatilities: Text-counts or option based measurement? Physica A: Statistical Mechanics and its Applications, 536, 122567.