
 ?Mathematical formulae have been encoded as MathML and are displayed in this HTML version using MathJax in order to improve their display. Uncheck the box to turn MathJax off. This feature requires Javascript. Click on a formula to zoom.
Abstract
Due to the arrival of a novel coronavirus, the year 2020 will forever be remembered. It is not hyperbole to state that COVID-19 has affected and infected almost everyone in society and the global community in different ways. However, many parts of the world seem to be improving. Individuals, organisations, and governments are trying to work through some effective strategies. The present study investigates the influence of fluctuation in the oil prices, COVID-19, and daily news-based index on Electronic Arts Inc's stock prices by applying a novel approach entitled Quantile Autoregressive Distributed Lag (QARDL) during 2019–2020. This approach is quite meaningful as it incorporates various quantiles with a comprehensive explanation of overall dependence among stated variables ignored by the traditional models like quantile regression, OLS, ARDL, etc. The study outcomes through QARDL reveal that the error correction coefficient is significant in various quantiles while confirming the long-run linkage among oil price, COVID-19, and EPU. More specifically, the study outcomes confirm a positive linkage (in all the quantiles) between COVID-19 and stock prices of Electronic Arts Inc, whereas a negative connection (for 0.20th to 0.95th quantiles) between oil prices and SPI. Furthermore, the Granger causality findings indicate the bidirectional causality between SPI and OIL and between SPI and EPU. Various policy implications are also provided under the present study.
1. Introduction
The historical significance of the year 2020 cannot be neglected due to the arrival of novel Corona virus and related pandemic, which has affected all the world's economies and business units (Gao et al., Citation2021; Su et al., Citation2021). In various parts, one of the growing needs, as observed, is that an effective strategic decision making and proactive approach is much needed to tackle uneven situations like this in the coming future. Like any sector, the sports sector's autonomy is widely challenged by the outbreak of COVID-19, and various sports-related authorities have shown their deeper concern about it. However, over the last year, E-gaming trends have been changed dramatically as video games have received more popularity during COVID-19 since most people were spending time at home while entertaining themselves. Like any other business unit, the impact of the COVID-19 on sports and related activities is also observed as significant in nature. For example, with the outbreak of this pandemic, the Union of European Football Associations (UEFA) decided to postpone top league finals and many other group matches as various authelets were found positive COVID-19 (J. Wang et al., Citation2020).
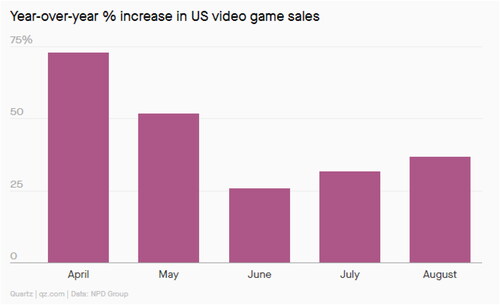
Furthermore, it is also observed that The International Olympic Committee (IOC) and the Japanese government have also announced that the Tokoyo Olympics 2020 are rescheduled to July 2021 while considering the same tile of Tokoyo Olympics 2020 (J. Wang et al., Citation2020). However, like many other sports, the nature and trends in e-sports have been changed dramatically during recent years just because of the COVID-19. This would justify the reasonable investigation regarding the latest trends in E-gaming, E-sports, and related activities. Although there is significant growth in the E-gaming industry, the systematic evaluation and contribution through theoretical and empirical studies in this field are observed in the infant stage. Furthermore, since 2020, the sale of video games has reached $29.4 billion in the United States only, with an increase of 23 percent from the last year of 2019 (Kretchmer, Citation2021). Furthermore, mobile game sales on iPhones have also experienced a dramatic increase of 44 percent in Japan and 20 percent in the European Union member states, as per Sensor Tower's findings. More specifically, during the recent epidemic, gaming sales in the US have increased to $3.3 billion (37%) in August, with a massive jump in sales (). All these facts indicate the dramatic change in E-gaming and relevant sports trends during the outbreak of COVID-19, which is under little observation of the researchers.
Figure 1. Year-over-year percentage increase in US Video Game. Source: WEF (Citation2021).
It is also claimed that, in the global tech sector, the growth in video gaming has received considerable attention as the situation of lockdown due to COVID-19 measures have created a captive audience with estimated spending of $159.3 billion and with the forecast of surpassing the digit of $200 billion by 2023 (Oxfordbusinessgroup, Citation2021). One of the well-known e-gaming companies named Electronic Arts, which is famous for soccer franchise, FIFA has added approximately more than 7 million new players worldwide during the second quarter of 2020, as per Bloomberg Intelligence findings (Kretchmer, Citation2021). This positive association between the pandemic like COVID-19 and E-gaming industry has provided several rationales to conduct the empirical analysis based on some novel methodology.
This study has provided several motivations to conduct the empirical analysis regarding trends in SPI stock prices through daily prices of WTI oil, COVID-19 cases, and daily news-based index entitled as EPU while considering the QARL methodology. The core motive behind applying the QARDL test is to analyse the long-run associations through various quantiles of the main dependent variable, SPI, and the possible asymmetric association with all of the explanatory variables under consideration. It is suggested that QARDL has the advantage of analysing the asymmetries over the linear ARDL model (Godil, Sarwat, et al., Citation2020). Furthermore, it also confirms the outcomes in nonlinear associations due to asymmetric linkages among the targeted series that show the marginal effect of explanatory variables under various explained variables (Shahbaz et al., Citation2018). In this regard, QARDL handles the long-run relationship between SPI, OIL, COVID-19, and EPU and provides short-run dynamics through various quantiles. Additionally, it is also believed that the QARDL method addresses the time-varying association across different quantiles due to some of the exogenous shocks that are undoubtedly one more benefit of employing QARDL over some traditional models like non-linear ARDL.
The present study's findings are significant for various stakeholders, specifically investors and policymakers, regarding reviewing the positive trends in the stock prices of e-gaming through COVID-19 and similar other pandemics. Additionally, both short-run and long-run linkage between the key exogenous and endogenous variables have been discussed appropriately. The remaining is structured into five different sections. The second section covers the literature review title, section three provides meaningful material for the research method, section four covers the study analysis, and the last two sections specify the conclusion and policy implication.
2. Literature review
In deriving economic activities, oil is vital irrespective of countries' regional or geographical significance. Since the 90s, it is believed that fluctuations in the oil price affect the real economy and various other sectors as well. For this reason, (Huang et al., Citation1996) state that the prices of stocks and oil in the economy are directly linked with each other, and variations in oil prices have their significant impact in terms of stock price volatility. Furthermore, as (Sarwat et al., Citation2019) expressed, another notion makes it evident that the causality direction in oil markets is from future oil prices to spot oil prices. Whereas Arshad et al. (Citation2017) specify significant and simultaneous volatility between the oil price and stock market, specifically from an Islamic perspective. For almost all industries, oil prices' cost plays a major role as it directly influences production costs.
However, the empirical findings regarding the association between oil prices and stock prices are mixed. For instance, Narayan and Narayan (Citation2010) investigates the trends in Vietnam's stock prices due to oil prices while using the daily data during 2000–2008. Their study findings have confirmed that oil prices have their significant and positive impact on stock prices. However, the findings are inconsistent with the theoretical foundation, and an increase in oil prices complements the Vietnamese stock market's growth. Jones and Kaul (Citation1996) observe the linkage between oil prices and stock returns for the United States during 1947–1991, for the Canadian economy during 1960–1991, for the Japanese market during 1970–1991. and for the UK during 1962–1991. The study findings through regression analysis specify a negative impact of oil prices on all the countries' stock returns as observed. Papapetrou (Citation2001) have applied the vector error correction model while exploring the impact of oil prices on Greece's stock returns during 1989–1996. The study results confirm a negative impact of oil prices on stock returns.
El-Sharif et al. (Citation2005) also, consider the UK economy for exploring the linkage between the oil price fluctuation and equity value. Their study confirms that the association between the oil price and stock return is positive with a higher significance level, hence confirming a direct impact of crude oil price volatility on the share's values. Hatemi-J et al. (Citation2017) aim to investigate the linkage between oil and stock price fluctuations through asymmetric causality tests for each of the G7 market economies and the world market. As the data was not normally distributed along with the varying time volatility, bootstrapping simulation was used. The study findings indicate no evidence of causal linkage among said variables neither in the panel of the world nor in any G7 country.
Furthermore, with the implication of the asymmetric causality test, they find a direct effect of an increase in oil price on the stock price in the world economy, Japan, and the US, whereas the evidence of a negative impact is found a decline in the oil prices. Such provides an overall inference that the US and Japanese stock markets reflect a good indication from the increase in the oil prices in the world economy, which is entirely different in the German stock market. Furthermore, the linkage between oil price and stock prices is observed, an ongoing phenomenon as observed in both theoretical and empirical perspective by various other researchers (Ashfaq et al., Citation2020; de Jesus et al., Citation2020; Hashmi et al., Citation2021; K.-H. Wang, Su, Lobonţ, et al., Citation2021; K.-H. Wang, Su, & Umar, Citation2021; Kumar & Ayedee, Citation2021; Su et al., Citation2020, Citation2021; Umar, Ji, et al., Citation2021; Umar, Rizvi, et al., Citation2021).
As stated earlier, the recent pandemic outbreak in COVID-19 has affected all sectors, financial markets, and key role players. In this regard, the impact of COVID-19 on stock prices is widely observed in contemporary literature through some traditional and novel methodological approaches. For instance, Štifanić et al. (Citation2020) investigate the impact of COVID-19 on the global economy while observing the trends in the financial movement of crude oil prices and three major stock indexes: DJI, S&P 500, and NASDAQ Composite. They have suggested predicting the stock and commodity prices with stationary wavelet transform and bidirectional long-term memory network. After decomposition, data of Crude Oil price and stock market indexes along with COVID-19 confirmed cases were used as input variables for future price movement forecasting. He et al. (Citation2020) use the event study approach to empirically test the market performance and response trends of various industries of China to the COVID-19 pandemic. The study results confirm that this pandemic has adversely impacted stock prices for the industries like transportation, electricity, environment, transportation, and heating. However, sectors like education, information technology, manufacturing and health care have shown some resilience to this pandemic. Liu et al. (Citation2020) investigate the stock market trends concerning COVID-19 among 21 leading stock market indices globally. While applying the event study method, their study indicates that stock markets in the world's major economies fell after the virus outbreak. However, countries in Asia have experienced more abnormal returns compared to other economies under observation. Zhang et al. (Citation2020) clear that the COVID-19 pandemic has a significant impact on the world's financial market, and substantial volatility is observed just after this pandemic, and a different pattern of global stock markets observe before and after this outbreak. Baker et al. (Citation2020) claim that the impact of COVID-19 on the stock prices is more forceful comparatively to all other earlier outbreaks. Besides, some other researchers have also explored the trends in stock prices for different sectors due to COVID-19, for example, the health sector (Sun et al., Citation2021), global stock market (Chowdhury et al., Citation2021), equity stock market (Umar, Mirza, et al., Citation2021) and oil and gold market (Qin et al., Citation2020).
The influence of the economic policy and uncertainty (EPU) index in determining stock price trends and market performance is also observed in recent and past literature. Liang et al. (Citation2020) claim that reducing uncertainty among the US consumers regarding the spending may affect the stock's performance in the bottom line of Asian producers. Their study test for the asymmetric uncertainty effects on 11 Asian stock market indices over the 2000M08 – 2017M02 period while taking the EPU as among the independent measures while applying a non-linear ARDL model for both short and long run duration. Their study results confirm that the increase in uncertainty results in a decline of stock prices while decreasing uncertainty, causing an upward shift in stock prices. Furthermore, their study confirms the significant benefit of applying the NARDL model while observing the asymmetry. Luo and Zhang (Citation2020) examine the impact of EPU on the stock price crash risk while taking the sample of large Chinese firms from 2000 to 2017. It is believed that with the increasing level of EPU, there is more crash of stock prices. Additionally, Cross-sectionally analysis reveals that the impact of EPU on the stock prices is observed stronger for the firms whose returns are more sensitive to EPU and vice versa. More specifically, young stocks, small stocks, high volatility stocks, and growth stocks, which have higher valuation uncertainty per se, are more sensitive to EPU and are more affected by EPU in crash risk.
Kannadhasan and Das (Citation2020) applied the quantile regression approach for the Asian emerging stock market for examining the impact of EPU and geopolitical risk (GPR) factors. Their findings confirm that EPU has its consistent and negative association across all the quantiles while the geopolitical risk is negatively linked with the lower quantiles. Additionally, the dependency of stock returns on EPU and GPR is asymmetric. Chen and Chiang (Citation2020) have confirmed similar findings for the adverse linkage between the increasing level of EPU and the lower level of stock return in the Chinese market. However, a positive linkage is found with the lagged EPU, and stock prices rebound. J. Wang et al. (Citation2020) conduct a momentous comparison between VIX and EPU while forecasting the future performance of 19 equity indices. The study findings confirm that the EPU index can improve the forecast accuracy of 5 equity indices.
Baig et al. (Citation2021) have considered the association between COVID-19 and asset management among the EU member states through performance and investment style components. For this purpose, they have considered the time duration between January and May 2020 and divided the spread of contagion into three different phases. The findings of their study reveal that social entrepreneurial funds show a positive return across all three different phases. Mirza, Naqvi, et al. (Citation2020) examine the price reaction, volatility, and performance of European investment funds during the time duration of COVID-19. They have analysed the time period between January and June 2020 and observed that most of the investment funds show stressed performance while social entrepreneurship funds are enduring resilience. Yarovaya et al. (Citation2020) investigate the impact of human capital efficiency on the performance of equity funds during the COVID-19 pandemic while collecting the data for 799 open-ended equity funds among different members of the EU.
The results show that during the outbreak of COVID-19, human capital efficiency has outperformed its counterparts. Mirza, Rahat, et al. (Citation2020) consider a decline of market capital due to COVID-19, which has further increased the default likelihood. However, sectors like constructions, mining, and retail stores are more vulnerable to market shocks during this pandemic. Mirza, Naqvi, et al. (Citation2020) have examined the association between human capital efficiency on Latin American mutual funds during the outbreak of COVID-19. It is observed that the performance persistency is more critical during the recent time duration. For this reason, they have attempted to analyse the performance of equity funds in Latin American economies. Their findings suggest that funds with a higher level of human capital efficiency significantly outperform those with a lower level of such efficiency. Mirza, Naqvi, et al. (Citation2020) assess the impact of COVID-19 on the valuation of non-financial firms while using the stress test scenario approach for 10 EU economies. Their findings show a significant loss in the valuation of all sectors because of a decline in sales.
To the best of our knowledge, this is the very first empirical attempt to investigate the relationship between oil prices, COVID-19, EPU, and SPI, as there is no single study in this regard. Therefore, this research will fill both theoretical and empirical gaps in the present body of literature.
3. Research methods and framework
The present research examines the nonlinear association between Electronic Arts Inc.'s stock prices, daily prices of WTI oil, number of daily new cases of COVID-19 as registered, and daily news-based index through applying the novel approach entitled QARDL. Various benefits for applying this approach have been examined in the present literature. For example, the method of QARDL allows assessing the long-run quantile effect of key explanatory variables on the main dependent variable of the study (Godil, Sharif, et al., Citation2020; Godil et al., Citation2021; Razzaq et al., Citation2021; Suki et al., Citation2020). Furthermore, the researchers most cited approaches where there is an existence of non-normality of the dataset. Compared to traditional approaches like OLS and traditional ARDL, QARDL provides the most reliable findings in the short-run and long run. Furthermore, to apply the robustness check, each of the study parameters' dependability for all the quantiles (i.e., 0.05th to 0.95th) is enclosed while incorporating the Wald-test. This method provides the findings for both short-long runs. For better understanding, following EquationEquation 1(1)
(1) blow provides the conventional model for the ARDL framework.
(1)
(1)
Where specifies the white noise residual as explained with the help of bottom ground formed through
and
Furthermore, the titles like p and q express the lag's orders with Schwarz Info Criterion's help (SIC). Additionally, the abbreviations like SPI, OIL, COVID-19, and EPU specify Electronic Arts Inc.'s stock prices, daily prices of WTI oil, the number of daily new COVID-19 cases registered, and daily news-based index, respectively. Furthermore, the adjustment in the above EquationEquation 1
(1)
(1) provides the layout for the following QARDL model as observed under the present study.
(2)
(2)
In the above EquationEquation (2)(2)
(2) , the titles like
and 0<
<1 represent the quantile (Kim & White, Citation2003). However, it is believed that various successive couples of quantiles (i.e., 0.05 to 0.95) are very much significant to consider for accomplishing the data estimation. Additionally, to address the likelihood of serial correlation among residual terms of the equation above, the QARDL Model observed in EquationEquation (2)
(2)
(2) is finalised with the help of the following EquationEquation (3)
(3)
(3) .
(3)
(3)
Furthermore, as per the recommendations of Cho et al. (Citation2015), EquationEquation (3)(3)
(3) is revisited to convert it into the error correction model based on the various quantiles of the ARDL approach.
(4)
(4)
With the delta approach's help, the combined short-run impact of previous values of Electronic Arts Inc on the current values is examined Furthermore, the joint short-run influence of OIL's present and past values on Electronic Arts's stock prices is also examined. Furthermore, the query of the speed of adjustment parameter or
is examined through EquationEquation (4)
(4)
(4) as observed from the research findings of Cho et al. (Citation2015) and Shahbaz et al. (Citation2018), respectively. Besides investigating both the short-run and long-run asymmetric impact of OIL, COVID-19, and SPI, this research has utilised the Walt test. This approach is very much helpful to investigate the long-short run coefficients while considering null and alternative hypotheses.
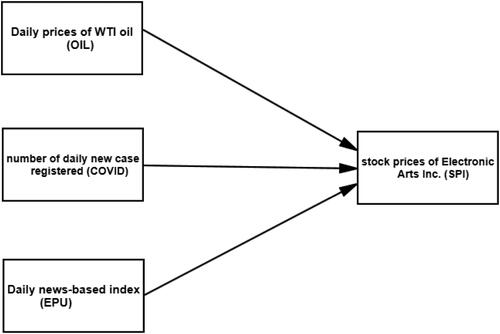
Furthermore, their methodological contribution (Cho et al., Citation2015) also specifies that both the short and long-run parameters should be based on the various quantiles with their further specification that these parameters may affect each era. The limitation for both the short-long run coefficients can be examined through the Wald test (Ghosh et al., Citation2016; Yakubu & Jalil, Citation2016; H. Zhu et al., Citation2016; S. Zhu et al., Citation2019). In addition, provides the outlook for the theoretical framework of the study covering the theoretical framework, covering three main independent variables entitled as daily prices of WTI oil, number of daily new COVID-19 cases, and Daily news-based index of EPU. At the same time, the main dependent variable is entitled to the stock prices of Electronic Arts Inc. (SPI).
Figure 2. Theoretical framework of the study. Sources: Authors.
4. Analysis and discussion
Descriptive findings are reported under through mean, minimum, maximum, standard deviation, and normality of the study variables through the J-B test. The mean score findings reveal that EPU represents the highest mean and standard deviation trends, whereas SPI specifies the lowest. That would justify the claim that, on average, EPU is greater than the rest of the study variables in terms of mean and standard deviation. Besides, EPU shows the highest score of 9.634, followed by COVID: 7.478. However, in terms of standard deviation, the trends in oil prices during the study period are 1.002, slightly lower than EPU. For examining the normality of the data, the J-B test specifies that all values are significant at 1 percent, claiming that data for all the study variables is not normality distributed, hence rejecting H0, which claims for the normal distribution.
Table 1. Results of descriptive statistics.
After descriptive and normality outcomes, the results for the two-unit root test named (Zivot & Andrews, Citation2002) (ZA) and Augmented Dickey-Fuller (ADF) are provided under . One of the significant benefits of reporting the ZA unit root test is that it accounts for the study data's structural breaks. The study findings confirm that for both ADF and ZA, all the variables' values are not statistically significant, which implies that data is non-stationary at the level. However, at (Δ), both ADF and ZA tests have shown significant scores at all three levels of significance. That means that all the variables have a unique order or integration.
Table 2. Results of unit root test.
reports the results for the QARDL model as generated during the study period. The outcomes specify that the estimated speed of adjustment coefficient, ρ*, is significant at 1 percent for the quantiles like 0.05, 0.10, 0.20, 0.30, 0.40, 0.60, and 0.70. At the same time, the findings for the ρ* for the rest of the higher-level quantiles are found to be statistically insignificant. Furthermore, the value of each coefficient of ρ* from 0.05 to 0.70 quantiles is negative, which implies a presence of reversion to the equilibrium (long-run) for the study variables like SPI OIL, COVID, and EPU, respectively. However, the speed of adjustment for the coefficients of ρ* is found to be lowest for the lowest quantiles (i.e., 0.05= −0.302***) and highest for the 70th quantile (i.e., −0.329*).
Table 3. Results of quantile autoregressive distributed lag (QARDL).
Meanwhile, this would justify that under the lowest quantiles, the coefficient of −0.302 is significant at 1 percent, whereas at 70th, it is significant at 10 percent, respectively. For the study's first explanatory variable, OIL, the cointegration parameters are negatively significant in all the quantiles except 0.05 and 0.10. That would justify the argument that there is an adverse long-run association between the daily prices of WTI oil and Electronic Arts Inc's stock prices, as observed under the present study. The negative linkage between oil prices and stock prices is widely supported in the present literature (Hashmi et al., Citation2021; Jones & Kaul, Citation1996; Papapetrou, Citation2001; Sadorsky, Citation1999). These coefficients' trends indicate the lowest for the lowest quantiles and the highest for the highest quantiles (i.e., 0.20 = −0.037**, 0.95 = −0.140***). However, the cointegration coefficients' values are found to be positively significant under all the stated quantiles in . That would justify the argument that there is a positive and long-run association between Electronic Arts Inc's stock prices and several daily new cases registered for COVID.
Furthermore, the level of significance for COVID is observed as highest for the lower quantiles (0.05–0.20), moderate for the quantiles like 0.40, 0.50, 0.60, 0.70, and 0.80, and finally highest for the remaining two quantiles (0.90, 0.95) as reported under . The reported results for OIL prices and COVID show entirely different trends for SPI, where the former is causing a downward shift and later specifies a positive and significant trend. It means that there is an adverse impact on Electronic Arts Inc's stock prices with the higher level of oil prices. However, this case is entirely different where COVID is causing an upward shift in SPI's stock value. In another way, the increasing trend in COVID cases is something like which is boosting the stock prices of EPI because people are forced to stay at home while having more time for online gaming activities, which in return showing a positive trend in the stock price of SPI. Various earlier studies have confirmed a positive relationship between COVID-19 and stock prices (Baker et al., Citation2020; He et al., Citation2020; Štifanić et al., Citation2020; Zhang et al., Citation2020), hence providing evidence that our results are consistent with them. Besides, the magnitude of the impact of COVID on the stock prices of Electronic Arts Inc. is higher than the impact of oil prices.
The findings under also examine the daily news-based index (EPU) impact on Electronic Arts Inc's stock prices over different quantiles. The results confirm that there is a negative but insignificant impact of EPU on SPI over the long run under the lowest quantiles. However, after the 0.30th quantile, the impact of EPU on Electronic Arts Inc's stock prices is negatively significant for the rest of the quantiles. More specifically, with the increasing level of quantiles, the influence of EPU on SPI is highly significant at 1 percent. That would employ that increasing level of quantiles show more concern for the negative influence of EPU on stock prices of Electronic Arts Inc. This finding of the negative impact of EPU on SPI is to be considered a meaningful contribution to the existing body of literature. Furthermore, various earlier studies have provided empirical evidence for the negative impact of EPU on stock prices in different markets. Notable work is provided by Chen and Chiang (Citation2020); Kannadhasan and Das (Citation2020); Liang et al. (Citation2020); Luo and Zhang (Citation2020).
After examining the long-run relationship between the study variables, the findings also reveal that past values of SPI have their significant and positive impact on the current values of SPI except for the last two quantiles (i.e., 0.90 and 0.95), where the impact is negatively significant at 5 percent and 10 percent, respectively. However, for all other quantiles, the association between past values of SPI and current values of SPI is found to be positively significant at 5 percent. Meanwhile, the OIL's contemporaneous changes have shown their negative and significant impact on the quantiles like 0.05, 0.10, 0.20, and 0.30, where the highly significant impact is recorded at 0.20th 0.30th quantiles. However, after significant and negative impact under OIL's short run on SPI, the impact is observed as negatively insignificant for the 0.40th, 0.50th, and 0.60th quantiles. Furthermore, the impact of OIL on SPI for the higher quantiles (i.e., 0.70th to 0.95th) is negatively significant at 5 percent.
This study also examined the parameter constancy of the estimated parameters through the Wald test. For this purpose, results are reported under , where the null hypothesis is rejected at a 1 percent level of significance, specifying the parameter constancy of the adjustment parameter's speed. Additionally, the null hypothesis for the linearity at different quantiles for the study variables' long-run parameters is also rejected with a 1 percent significance level. That would justify the argument that long-run parameters for the stock prices of Electronic Arts Inc. Daily prices of WTI oil, number of daily new cases registered, and the daily news-based index are observed as dynamic under-stated quantiles of the study. Furthermore, the Walt-test findings also reject the null hypothesis specifically for the short-run cumulative impact of the past values of Electronic Arts Inc.'s stock prices on the current ones. Additionally, it is also confirmed through findings under that OIL, COVID, and EPU have their nonlinear contemporaneous effect on Electronic Arts Inc's stock prices.
Table 4. Results of the Wald test for the constancy of parameters.
The results also reveal that the cumulative short-run effect of OIL, COVID, and EPU on stock prices of Electronic Arts Inc. is observed as non-linear at a 5 percent level of significance among various quantiles of the study. Finally, provides the outcomes for the Granger-causality in the Quantile test. The study results confirm a bi-directional causal association between the study variables in different quantiles. The findings also specify that OIL's concurrent and past realisation is accepted as better predictors of SPI and vice versa. The empirical results also confirm a two-way causality between the EPU and SPI for all the study quantiles achieved through the quantile causality test. However, there is a one-way causality between SPI and COVID in all the quantiles.
Table 5. Granger causality in quantile test results.
5. Conclusion and policy recommendations
This study investigates oil price fluctuation, COVID-19, and risk matters to electronic sports through a nonlinear approach. To address the study objective and fill the research gap, this research applies the quantile autoregressive lagged approach as suggested (Cho et al., Citation2015). The suggested method is meant to examine how the different ranges of quantiles of explanatory variables like oil prices, COVID-19 cases, and daily news-based index explain Electronic Arts Inc's stock prices compared to various traditional techniques like OLS or simple quantile regression estimation. Furthermore, this research also examines the causality in different quantiles as suggested by Troster (Citation2018); Troster et al. (Citation2018) in order to determine the causal association between the key variables like oil prices, COVID-19 cases, and daily news-based index are explaining the stock prices of Electronic Arts Inc in terms of vice versa. The findings through the QARDL method specify that the error correction parameter is statistically significant among various quantiles. That would justify the claim that there is a presence of a significant long-term association between the key explanatory variables and stock prices of Electronic Arts Inc. Furthermore, the study outcomes confirm that under long-run analysis, there is a significant and negative effect of oil prices on the SPI among all the quantiles except for the 0.05 and 0.10. However, the study findings provide good insight while claiming a significant and positive connection between the COVID-19 and stock prices of all the quantiles in the long run.
Furthermore, the short-run findings provide some interesting facts while claiming that past values of SPI have their significant and positive impact on the current values of SPI except for the last two quantiles. However, for all other quantiles, the association between past values of SPI and current values of SPI is found to be positively significant at 5 percent. Meanwhile, the study findings through Granger-causality in different quantiles also confirm th presence of bi-directional causality between the SPI and OIL, between COVID and SPI, and between SPI and EPU in all the study quantiles.
5.1. Policy recommendations
After conducting a careful review of the current study outcomes, it is observed that various policy implications for exploring the relationship between oil price, COVID-19, daily news-based index, and SPI can come to pass. For instance, based on the study findings, it is observed that there is a significant growth of 0.3 percent in the EA stock during the pandemic, which gives an overall increase in gaming demand. One of the major reasons behind this upward shift is that there due to lockdown and similar other conditions, most individuals have spent their major time slot at home with a direct desire for playing EA and related sports activities. This direct and positive impact of COVID-19 on stock prices of Electronic Arts Inc has provided some significant indication to invest more in e-gaming as the ‘new normal’ has changed the world economy's entire trends for the sports industry. More specifically, investors in the EA stock can directly obtain some significant guidelines while observing both short-run and long-run dynamic relationships between the stock prices of EA and COVID. However, on the other side, considering the negative impact of EPU on the stock prices of EA, the investors and financial advisor at EA sports should reasonably consider their relationship. That can significantly improve the decision-making capabilities for controlling the negative long-run linkage through strategic decision-making. Besides, the EA management needs to explore the dynamic linkage between EPU and its stock prices, which may provide better results in the coming time or at the outbreak of such epidemic diseases.
Disclosure statement
No potential conflict of interest was reported by the authors.
References
- Arshad, H., Muda, R., & Osman, I. (2017). Impact of exchange rate and oil price on the yield of sovereign bond and sukuk: Evidence from Malaysian capital market. Journal of Emerging Economies & Islamic Research, 5(4), 1–15.
- Ashfaq, S., Maqbool, R., & Rashid, Y. (2020). Daily dataset of oil prices and stock prices for the top oil exporting and importing countries from the region of Asia. Data in Brief, 28, 104871. https://doi.org/10.1016/j.dib.2019.104871
- Baig, A. S., Butt, H. A., Haroon, O., & Rizvi, S. A. R. (2021). Deaths, panic, lockdowns and US equity markets: The case of COVID-1s9 pandemic. Finance Research Letters, 38, 101701. https://doi.org/10.1016/j.frl.2020.101701
- Baker, S. R., Bloom, N., Davis, S. J., Kost, K. J., Sammon, M. C., & Viratyosin, T. (2020). The unprecedented stock market impact of COVID-19. National Bureau of Economic Research.
- Chen, X., & Chiang, T. C. (2020). Empirical investigation of changes in policy uncertainty on stock returns—Evidence from China’s market. Research in International Business and Finance, 53, 101183. https://doi.org/10.1016/j.ribaf.2020.101183
- Cho, J. S., Kim, T., & Shin, Y. (2015). Quantile cointegration in the autoregressive distributed-lag modeling framework. Journal of Econometrics, 188(1), 281–300. https://doi.org/10.1016/j.jeconom.2015.05.003
- Chowdhury, E. K., Khan, I. I., & Dhar, B. K. (2021). Catastrophic impact of COVID‐19 on the global stock markets and economic activities. Business and Society Review. https://doi.org/10.1111/basr.12219
- de Jesus, D. P., Bezerra, B. F. L. S., & da Nóbrega Besarria, C. (2020). The non-linear relationship between oil prices and stock prices: Evidence from oil-importing and oil-exporting countries. Research in International Business and Finance, 54, 101229. https://doi.org/10.1016/j.ribaf.2020.101229
- El-Sharif, I., Brown, D., Burton, B., Nixon, B., & Russell, A. (2005). Evidence on the nature and extent of the relationship between oil prices and equity values in the UK. Energy Economics, 27(6), 819–830. https://doi.org/10.1016/j.eneco.2005.09.002
- Gao, X., Ren, Y., & Umar, M. (2021). To what extent does COVID-19 drive stock market volatility? A comparison between the US and China. Economic Research-Ekonomska Istraživanja, 1–21. https://doi.org/10.1080/1331677X.2021.1906730
- Ghosh, A., Mandal, A., Martín, N., & Pardo, L. (2016). Influence analysis of robust Wald-type tests. Journal of Multivariate Analysis, 147, 102–126. https://doi.org/10.1016/j.jmva.2016.01.004
- Godil, D. I., Sarwat, S., Sharif, A., & Jermsittiparsert, K. (2020). How oil prices, gold prices, uncertainty and risk impact Islamic and conventional stocks? Empirical evidence from QARDL technique. Resources Policy, 66, 101638. https://doi.org/10.1016/j.resourpol.2020.101638
- Godil, D. I., Sharif, A., Agha, H., & Jermsittiparsert, K. (2020). The dynamic nonlinear influence of ICT, financial development, and institutional quality on CO2 emission in Pakistan: New insights from QARDL approach. Environmental Science and Pollution Research International, 27(19), 24190–24200. https://doi.org/10.1007/s11356-020-08619-1
- Godil, D. I., Yu, Z., Sharif, A., Usman, R., & Khan, S. A. R. (2021). Investigate the role of technology innovation and renewable energy in reducing transport sector CO2 emission in China: A path toward sustainable development. Sustainable Development. https://doi.org/10.1002/sd.2167
- Hashmi, S. M., Chang, B. H., & Bhutto, N. A. (2021). Asymmetric effect of oil prices on stock market prices: New evidence from oil-exporting and oil-importing countries. Resources Policy, 70, 101946. https://doi.org/10.1016/j.resourpol.2020.101946
- Hatemi-J, A., Al Shayeb, A., & Roca, E. (2017). The effect of oil prices on stock prices: Fresh evidence from asymmetric causality tests. Applied Economics, 49(16), 1584–1592. https://doi.org/10.1080/00036846.2016.1221045
- He, P., Sun, Y., Zhang, Y., & Li, T. (2020). COVID-19’s impact on stock prices across different sectors—An event study based on the Chinese stock market. Emerging Markets Finance and Trade, 56(10), 2198–2212. https://doi.org/10.1080/1540496X.2020.1785865
- Huang, R. D., Masulis, R. W., & Stoll, H. R. (1996). Energy shocks and financial markets. Journal of Futures Markets, 16(1), 1–27. https://doi.org/10.1002/(SICI)1096-9934(199602)16:1<1::AID-FUT1>3.0.CO;2-Q
- Jones, C. M., & Kaul, G. (1996). Oil and the stock markets. The Journal of Finance, 51(2), 463–491. https://doi.org/10.1111/j.1540-6261.1996.tb02691.x
- Kannadhasan, M., & Das, D. (2020). Do Asian emerging stock markets react to international economic policy uncertainty and geopolitical risk alike? A quantile regression approach. Finance Research Letters, 34, 101276. https://doi.org/10.1016/j.frl.2019.08.024
- Kim, T.-H., & White, H. (2003). Estimation, inference, and specification testing for possibly misspecified quantile regression. Emerald Group Publishing Limited.
- Kretchmer, H. (2021). Vaccine nationalism–and how it could affect us all. World Economic Forum, 6, 27–39.
- Kumar, A., & Ayedee, D. (2021). Technology adoption: A solution for SMEs to overcome problems during COVID-19. Forthcoming, Academy of Marketing Studies Journal, 25(1), 22–36.
- Liang, C. C., Troy, C., & Rouyer, E. (2020). US uncertainty and Asian stock prices: Evidence from the asymmetric NARDL model. The North American Journal of Economics and Finance, 51, 101046. https://doi.org/10.1016/j.najef.2019.101046
- Liu, H., Manzoor, A., Wang, C., Zhang, L., & Manzoor, Z. (2020). The COVID-19 outbreak and affected countries stock markets response. International Journal of Environmental Research and Public Health, 17(8), 2800. https://doi.org/10.3390/ijerph17082800
- Luo, Y., & Zhang, C. (2020). Economic policy uncertainty and stock price crash risk. Research in International Business and Finance, 51, 101112. https://doi.org/10.1016/j.ribaf.2019.101112
- Mirza, N., Naqvi, B., Rahat, B., & Rizvi, S. K. A. (2020). Price reaction, volatility timing and funds' performance during Covid-19. Finance Research Letters, 36, 101657. https://doi.org/10.1016/j.frl.2020.101657
- Mirza, N., Rahat, B., Naqvi, B., & Rizvi, S. K. A. (2020). Impact of COVID-19 on corporate solvency and possible policy responses in the EU. The Quarterly Review of Economics and Finance. https://doi.org/10.1016/j.qref.2020.09.002
- Narayan, P. K., & Narayan, S. (2010). Modelling the impact of oil prices on Vietnam’s stock prices. Applied Energy, 87(1), 356–361. https://doi.org/10.1016/j.apenergy.2009.05.037
- Oxfordbusinessgroup. (2021). Video games and COVID-19: the impact in emerging markets. https://oxfordbusinessgroup.com/news/video-games-and-COVID-19-impact-emerging-markets
- Papapetrou, E. (2001). Oil price shocks, stock market, economic activity and employment in Greece. Energy Economics, 23(5), 511–532. https://doi.org/10.1016/S0140-9883(01)00078-0
- Qin, M., Su, C.-W., Tao, R., & Umar, M. (2020). Is factionalism a push for gold price? Resources Policy, 67, 101679. https://doi.org/10.1016/j.resourpol.2020.101679
- Razzaq, A., Sharif, A., Ahmad, P., & Jermsittiparsert, K. (2021). Asymmetric role of tourism development and technology innovation on carbon dioxide emission reduction in the Chinese economy: Fresh insights from QARDL approach. Sustainable Development, 29(1), 176–193. https://doi.org/10.1002/sd.2139
- Sadorsky, P. (1999). Oil price shocks and stock market activity. Energy Economics, 21(5), 449–469.
- Sarwat, S., Kashif, M., Aqil, M., & Ahmed, F. (2019). Determination of causality in prices of crude oil. International Journal of Energy Economics and Policy, 9(4), 298–304. https://doi.org/10.32479/ijeep.7724
- Shahbaz, M., Lahiani, A., Abosedra, S., & Hammoudeh, S. (2018). The role of globalization in energy consumption: A quantile cointegrating regression approach. Energy Economics, 71, 161–170. https://doi.org/10.1016/j.eneco.2018.02.009
- Štifanić, D., Musulin, J., Miočević, A., Baressi Šegota, S., Šubić, R., & Car, Z. (2020). Impact of COVID-19 on forecasting stock prices: An integration of stationary wavelet transform and bidirectional long short-term memory. Complexity, 2020, 1–12. https://doi.org/10.1155/2020/1846926
- Su, C.-W., Huang, S.-W., Qin, M., & Umar, M. (2021). Does crude oil price stimulate economic policy uncertainty in BRICS? Pacific-Basin Finance Journal, 66, 101519. https://doi.org/10.1016/j.pacfin.2021.101519
- Su, C.-W., Qin, M., Tao, R., Moldovan, N.-C., & Lobonţ, O.-R. (2020). Factors driving oil price——From the perspective of United States. Energy, 197, 117219. https://doi.org/10.1016/j.energy.2020.117219
- Suki, N. M., Sharif, A., Afshan, S., & Suki, N. M. (2020). Revisiting the environmental Kuznets curve in Malaysia: The role of globalization in sustainable environment. Journal of Cleaner Production, 264, 121669. https://doi.org/10.1016/j.jclepro.2020.121669
- Sun, T.-T., Tao, R., Su, C.-W., & Umar, M. (2021). How do economic fluctuations affect the mortality of infectious diseases? Frontiers in Public Health, 9, 678213. https://doi.org/10.3389/fpubh.2021.678213
- Troster, V. (2018). Testing for Granger-causality in quantiles. Econometric Reviews, 37(8), 850–866. https://doi.org/10.1080/07474938.2016.1172400
- Troster, V., Shahbaz, M., & Uddin, G. S. (2018). Renewable energy, oil prices, and economic activity: A Granger-causality in quantiles analysis. Energy Economics, 70, 440–452. https://doi.org/10.1016/j.eneco.2018.01.029
- Umar, M., Ji, X., Mirza, N., & Rahat, B. (2021). The impact of resource curse on banking efficiency: Evidence from twelve oil producing countries. Resources Policy, 72, 102080. https://doi.org/10.1016/j.resourpol.2021.102080
- Umar, M., Mirza, N., Rizvi, S. K. A., & Furqan, M. (2021). Asymmetric volatility structure of equity returns: Evidence from an emerging market. The Quarterly Review of Economics and Finance. https://doi.org/10.1016/j.qref.2021.04.016
- Umar, M., Rizvi, S. K. A., & Naqvi, B. (2021). Dance with the devil? The nexus of fourth industrial revolution, technological financial products and volatility spillovers in global financial system. Technological Forecasting and Social Change, 163, 120450. https://doi.org/10.1016/j.techfore.2020.120450
- Wang, J., Lu, X., He, F., & Ma, F. (2020). Which popular predictor is more useful to forecast international stock markets during the coronavirus pandemic: VIX vs EPU? International Review of Financial Analysis, 72, 101596. https://doi.org/10.1016/j.irfa.2020.101596
- Wang, K.-H., Su, C.-W., Lobonţ, O.-R., & Umar, M. (2021). Whether crude oil dependence and CO2 emissions influence military expenditure in net oil importing countries? Energy Policy, 153, 112281. https://doi.org/10.1016/j.enpol.2021.112281
- Wang, K.-H., Su, C.-W., & Umar, M. (2021). Geopolitical risk and crude oil security: A Chinese perspective. Energy, 219, 119555. https://doi.org/10.1016/j.energy.2020.119555
- WEF (2021). Game on: How COVID-19 became the perfect match for gamers. https://www.weforum.org/agenda/2020/09/COVID-19-coronavirus-pandemic-video-games-entertainment-media/
- Yakubu, Y., & Jalil, S. A. (2016). Modified Wald test approach into causality between electricity and manufacturing sector in Nigeria. Journal of Economics and Finance, 7(1), 47–61.
- Yarovaya, L., Mirza, N., Rizvi, S. K. A., & Naqvi, B. (2020). COVID-19 pandemic and stress testing the eurozone credit portfolios. SSRN 3705474. https://papers.ssrn.com/sol3/papers.cfm?abstract_id=3705474
- Zhang, D., Hu, M., & Ji, Q. (2020). Financial markets under the global pandemic of COVID-19. Finance Research Letters, 36, 101528. https://doi.org/10.1016/j.frl.2020.101528
- Zhu, H., Duan, L., Guo, Y., & Yu, K. (2016). The effects of FDI, economic growth and energy consumption on carbon emissions in ASEAN-5: Evidence from panel quantile regression. Economic Modelling, 58, 237–248. https://doi.org/10.1016/j.econmod.2016.05.003
- Zhu, S., Liu, Q., Wang, Y., Wei, Y., & Wei, G. (2019). Which fear index matters for predicting US stock market volatilities: Text-counts or option based measurement? Physica A: Statistical Mechanics and Its Applications, 536, 122567. https://doi.org/10.1016/j.physa.2019.122567
- Zivot, E., & Andrews, D. W. K. (2002). Further evidence on the great crash, the oil-price shock, and the unit-root hypothesis. Journal of Business & Economic Statistics, 20(1), 25–44. https://doi.org/10.1198/073500102753410372