
 ?Mathematical formulae have been encoded as MathML and are displayed in this HTML version using MathJax in order to improve their display. Uncheck the box to turn MathJax off. This feature requires Javascript. Click on a formula to zoom.
Abstract
By aiming to understand the importance of the ongoing effects of COVID-19 on several economies, this study attempts to highlight the impact of COVID-19 confirmed cases and deaths occurring in the most affected countries of the world such as China and the USA, especially in the context of their respective currencies. For this purpose, the daily data from January 22, 2020, till May 7, 2021, has been taken into account, and then has been analyzed to examine the linear relationship between the currency and proxies of the COVID-19 pandemic. Moreover, the (autoregressive distributed lag) ARDL model has been employed in order to fulfil the research objective with numerous statistical diagnostic measures, so as to validate the model. The results indicate that the exchange rate is affected negatively due to the effect of COVID-19 cases and deaths in particular countries. Moreover, the effect of the pandemic is not limited to the short run only, but also in the long run, as it is hurting the financial backbone of China and the USA.
1. Introduction
There is no doubt that pandemics are indeed a natural phenomenon, and history is marked with various instances of natural catastrophes and horrible consequences of such disasters. Similarly, The COVID-19 pandemic, also known as the novel coronavirus pandemic, has been an ongoing global pandemic believed to be initiated in December 2019, from the city of Wuhan, China (Gao et al., Citation2021; Mirza et al., Citation2020; Su et al., Citation2021). The World Health Organization declared this as a pandemic on 11th March 2020. Conferring to World Health Organization (WHO), this deadliest pandemic in the global history has spread in almost 220 countries, and territories reported a total of 169 million confirmed cases, with a death toll of 3.5 million deaths till the time of this research. Apart from being a worldwide wellbeing concern, COVID-19 has also had a significant impact on the world economy. The quarantines and lockdowns necessary to reduce the spread of COVID-19 continue to freeze the worldwide economy. Moreover, the impact of the COVID-19 pandemic has been so broad that the countries, whether they are big, small, rich or poor, have been adversely affected by it. In 2020, the International Monetary Fund (IMF) estimated that the global output due to the onset of the Corona virus had fallen by 3.5%. The outbreak of the COVID-19 contagion has been extraordinary, and its impact on the world’s markets has been reflected in the fluctuations in the foreign exchange as well ( Rizvi et al., Citation2020; Umar et al., Citation2021a, Citation2021c). As exchange rate is one of the major important indicators of economics, it has also been affected by the pandemic, and the volatility can be seen in the unpredictability of the exchange rates (Su et al., Citation2021).
The beginning of the year 2020 brought the contagious virus to the USA, and more than 33 million positive cases, and 607,726 deaths had been reported there in the first month alone. Moreover, China, which was the origin of the virus, recorded more than 90,000 confirmed positive cases, while 4,636 deaths had been reported since December 2019. The COVID-19 pandemic has caused a shocking loss of life, and has also shattered the USA and China's economy (Umar et al., Citation2021b; Umar et al., Citation2020). Both the nations have been brutally confronted with demand, supply and sudden financial shocks through the impact of this novel disease. In addition to this, USA’s unemployment rate has also shot up with such an accelerated speed that according to the Federal Reserve Bank of St. Louis, 3.3 million Americans filed for unemployment insurance during March 2020 alone. Similarly, the Chinese stock market, which one of the largest markets worldwide, has also been significantly affected by this pandemic (Apergis & Apergis, Citation2020).
Thus far, global researchers have focused a numerous amount of studies on the impact of the virus, based on several different aspects. Investigated that the COVID-19 pandemic has a considerably high impact on the volatility of the financial market in the United States. The negative impact of the COVID-19 pandemic on the Chinese stock market returns has also been investigated by Apergis and Apergis (Citation2020), using the Generalized Autoregressive Conditionally Heteroskedastic (GARCHX) model. A study based on the relationship between stock market volatility and COVID-19 has also been undertaken by Syed and Fatima (Citation2021), primarily using the vector autoregressive (VAR) model. The results of the model have shown that a sharp rise in the coronavirus cases has caused an increase in the volatility of the stock market of Pakistan. In addition to this, (Handoyo, Citation2020) predicted that the COVID-19 pandemic also triggered global economic trade, which fell from 12% to 32% in 2020. Other than that, (Feng et al., Citation2021) also observed that an increase in the confirmed cases of COVID-19, in 20 countries significantly led to an increase in the exchange rate volatility. Moreover, a study based on the relationship between the USA exchange rate and oil prices has also been carried out by Devpura (Citation2021).
The observations in this study show that the oil prices tend to have a significant impact on the Euro/USD exchange rate, however though, after relatively controlling the spread of COVID-19, this relationship tends to vanish. Although the literature seems to be exponentially increasing in terms of the discipline of finance augmented with COVID-19 measures, certain gaps are yet to be filled (Su et al., Citation2021). Therefore, this study contributes in several ways to this emerging literature. First, this is a novel study that provides a comparative analysis of the currencies of the most affected countries such as China and the USA, as various studies thus far have taken the stock market indices in consideration. Secondly, the research has employed two proxies of COVID-19, which confirm the daily cases and deaths, and individually address the impact of the pandemic in both the countries taken into account. Moreover, the study has followed the econometric model of ARDL, in line with the studies of (Albulescu, Citation2020; Erokhin & Gao, Citation2020; Gherghina et al., Citation2020).
The rest of the paper is organized by means of four more sections. Section 2 is dedicated to outlining the emerging literature, and Section 3 deliberates the methodological framework. Similarly, section 4 highlights the outcomes of the study and section 5 wrap up the conclusion.
2. Literature review
A voluminous literature has been evolving to assess the influence of pandemic on different economies through various statistical and econometrics techniques. Few of the recent studies are cited here; (Mirza et al., Citation2020) evaluated the price response, returns, and fluctuations of European investment funds in the epidemic of COVID-19. They examined it from January 2020 to June 2020, and the results showed that even though most investment funds have shown considerable returns, social entrepreneurship funds had shown resilience (Umar et al., Citation2021a). These symptoms are persistent at different stages of the development of this infection. Social funds have also shown temporary volatility, which most peers lack. The study further showed that social entrepreneurship funds perform better than their competitors in the epidemic. The result of fluctuations is still stable, indicating that this phenomenon exists in social funds. The Ministry of Finance's budget was positive initially, but the equity ratio became negative as the epidemic worsened.
Cepoi (Citation2020) explored new empirical data on the relationship between COVID-19 news and stock market performance in the six most affected countries by the pandemic. Using a quantitative regression model in the panel structure, the research proved that the stock market is overly linked to information related to COVID-19. Furthermore, the results suggested that appropriate communication channels are needed to reduce COVID-19 financial shocks. Similarly, the study revealed that news media have a negative impact, and the same effect can be seen in the Corruption Perceptions Index, which shows that the more institutions associated with COVID-19 news, the worse the stock market performance, especially during the recovery period.
The widespread coronavirus has caused concern in many European Union companies. The study of Mirza et al. (Citation2020), in line with it, introduced the different situations of listed companies that are not financial companies and pointed out a gradual increase in the possibility of late payment, an increase in debt repayments, and a reduction in collateral. The results showed that each company's credit rating is declining. Production, mining, and retail are most vulnerable to declining market margins and declining sales. The study also examined possible policy interventions to maintain COVID-19 solvency levels. Along with it, tax deferrals would suffice in the event of a moderate economic downturn. However, if the economic downturn intensifies, it should provide mixed debt and stock support to prevent a collapse. The study concludes that delays in the payment of taxes reduced the cost to the treasury, and the granting of student loans and equity grants relied heavily on official sources.
The stock index of the Philippines, the currency of peso and diesel prices, has been taken by CAMBA and CAMBA (Citation2020) to observe the influence of COVID-19. The robust least-squares regression with the MM method concluded that the daily COVID-19 infection hurt the Philippine stock index, the peso exchange rate, and the retail price of diesel and the coefficient was found to be statistically significant. This is in line with the results of the follow-up analysis. For the VAR model, the delay value of the explanatory variable shows the importance of explaining the Philippine stock market index, the peso/dollar exchange rate, and the retail price of diesel. In addition, the shock response confirmed the relative effects of daily COVID-19 infection and short-term variance analysis, suggesting that daily COVID-19 infection played a small role in explaining the fluctuation of the dollar peso index, stock market and retail prices of diesel pumps. In the long run, the effects will stabilize. Grangers' causality test asserts that daily infection with COVID-19 can lead to short-term changes in the Philippine stock index and peso price. However, there is no causal link between the COVID-19 infection and the retail price of diesel.
Mirza et al. (Citation2020) showed that the performance of investment funds depends on the fund manager's performance. This makes the efficiency of human resources very important for continuous risk mitigation measures. In times of great turmoil, such as those experienced in the COVID-19 epidemic, the continuity of events becomes more important. The study evaluated the performance of equity funds in the Latin American countries that have the most impact on the epidemic. Around 95% of these equity funds are invested in infected areas, classified according to their performance in human resources, with 2019 as the reference year. Results revealed that higher workforce efficiency funds are better than comparable funds, which have lower workforce efficiency. These results have not changed for the sub-level decided to map the development of COVID-19.
The spread of COVID-19 and international prevention measures will have a major impact on economic activity in the UK. However, (Griffith et al., Citation2020) described how these effects vary by industry and the extent of government support for workers and companies in this regard, based on data on the share prices of listed companies in London. To realize the potential benefits of CJRS for different industries, depending on the severity of these industries, the study exhibited the relationship between the potential coverage of CJRS and the cumulative decline in stock prices of some key industries. As social distance measures continue, more capital-intensive companies that cannot significantly reduce costs may face greater difficulties that may require more government support. However, if these companies are forced to close, and the skills and experience of employees are lost, it can be sustainable for the economy.
Pasiouras and Daglis (Citation2020) used the standard Bayesian method to test whether the current crisis caused by the spread of COVID-19 is affecting the exchange rate. The study presented a new autonomous Bayesian vector model and forecast with economic models available in the literature. Based on the results, the new Bayesian model proposed by the authors is more predictable than the traditional econometric model. More importantly, it may reveal the effect of COVID-19's spread on the exchange rate, which the economic model fails to explain. The proposed Bayesian model has new technical aspects and may reveal the potential impact of external variables on internal variables. The study found that the new Bayesian model is superior to two other economic models in prophecy. This means that the new model is not only superior to traditional econometric models in terms of predictability, but it can also reveal ‘hidden’ external information. Furthermore, the study concludes that the new Bayesian model can show that confirmed cases of COVID-19 affect the exchange rate, which economic methods cannot determine. This information is valuable because it reflects the effect of COVID-19 stress on the exchange rate.
Rizvi et al. (Citation2020) recorded some preliminary data on the performance and investment strategies of the development of European funds in COVID-19. It is estimated that the period January 2020 to May 2020 was divided into three stages. In the study, the researchers divided the last five months into three phases, referring to the initial phase where the infection is confined to China, the second phase (becoming a global problem), and the third phase (mainly determined by strict closure). The performance of social entrepreneurship funds is better than other types; even if the gap between the second and third levels widens, it will remain unchanged. Style analysis draws some interesting conclusions. The results showed that social entrepreneurship funds showed positive returns in all three phases, while most other sub-categories were in the negative area. The results show that fund managers are moving from a high-risk investment policy to a low-risk one. There has also been a shift from the risky to the less sensitive and the shift in investment from influential countries to ineffective countries.
Devpura (Citation2021) used data within 24 hours that showed the relationship between the euro/dollar exchange rate and the future price of oil. Hourly data was collected from January 1, 2019 to November 30, 2020, and 17 hours per day from 1 am to 5 pm. The author estimated that oil prices affected the exchange rate, but the indicators are very limited. Furthermore, the study concluded that the effect of COVID-19, this relationship will also disappear, and COVID-19 will generally affect the March 2020 exchange rate. Yarovaya et al. (Citation2021) examine the impact of capital efficiency on mutual fund returns during the three phases of the COVID-19 pandemic. They collected data from 799 equity funds in five EU countries, divided them into five HCE classes, and compared their risk-adjusted results in those classes. The results conclude that while COVID-19 broke out, funds with higher capital outperformed their HCE counterparts.
The above review highlighted that most of the research had been done on panel settings, and different financial variables have been targeted instead of exchange rate returns. Thus, this study attempts to explore the impact of COVID-19 on the exchange rate of the most affected countries like the USA and China.
3. Data and empirical framework
3.1. Variables and sample
To examine the unprecedented impact of COVID-19 on exchange rates of China and the USA, this study took daily data from January 22, 2020, till May 7, 2021. The data of COVID-19 confirmed cases and deaths were obtained from the database of John Hopkin's University. In order to uniform the frequency of days for exchange rate and COVID-19 proxies, three days moving averages have calculated from Friday to Monday for cases and deaths of COVID-19 and then incorporate to Monday. USD/EURO and CHYUAN/EURO are used for exchange rates of the USA and China, respectively. Compounded returns of both currencies have been deployed in the study, while several cases and deaths are taken in logarithmic form.
3.2. Unit root tests
In order to identify the order of integration, the study deployed two variants of unit root tests, i.e. with and without structural breaks. The exchange rate series seems to hold structural breaks due to the COVID-19 outbreak, and the traditional procedure is a bias towards breaks; thus, the order of integration has been confirmed by both variants. The Augmented Dickey-Fuller (Dickey & Fuller, Citation1979, Dickey & Fuller, Citation1981) tests and (Phillips & Perron, Citation1988) and (Perron, Citation1988) are used by taking without breaks while incorporating the breaks (Zivot & Andrews, Citation2002) has been utilized. All three test are based on the null hypothesis of non-stationarity, and it will be rejected if the p-value (t-statistic) is less than (greater than) the level of significance (the tabulated value).
The prerequisite of unit root is essential to analyse the existence of a co-integration relationship among variables. Since stationarity of variables at the same order of integration is obligatory for using the traditional co-integration tests, the ARDL bounds test of co-integration relaxes this pre-testing before deploying the co-integration test (Sezgin & Yildirim, Citation2002). Therefore, in ARDL, the order of integration for the variable is not necessary. As of Lundgren et al. (Citation2004), the F-statistic obtained by Pesaran et al., (Citation2000) will be no longer beneficial if any of the variables under study is integrated of order two, i.e. I(2) since the bounds test is only valid for I(0) and I(1) variables. Thus, to ensure that none of the variables is of order 2, the root test must be applied.
3.3. Econometric model
The time series is co-integrated if they hold a long run and equilibrium relationship between them. There are several tests developed in the time series and econometrics literature to investigate the co-integration among variables, such as (Engle & Granger, Citation1987; Johansen, Citation1988) co-integration test (Johansen & Juselius, Citation2009) co-integration test, (Boswijk, Citation1994) and (Banerjee et al., Citation1998) ECM-based test. All tests have their limitations, while they all are not reliable in small sample size and different order of integration. According to Govindaraju and Tang (Citation2013), every test produces a different decision, but perfection lies under which test is difficult to report. Under these circumstances, this study deployed the Autoregressive distributed lag (ARDL) model proposed by Pesaran et al. (Citation1999, Citation2000; Peseran & Peseran, Citation1997). There are several reasons to apply the said method. Firstly, the long-run estimates obtained by ARDL asymptotically follow a normal distribution and are consistent (Peseran & Peseran, Citation1997). Secondly, (Pesaran et al., Citation2000) assert lags in the ARDL model adjusted for both residuals correction and endogeneity. Thirdly ARDL method can differentiate between the dependent and independent variables. Thus, it even works if explanatory variables are correlated with each other, i.e. overcome the problem of endogeneity (Alam & Quazi, Citation2003). Furthermore, it behaves well in small samples. Mainly this method is free from the condition of the same order of integration since this method is robust to the series with mix order either I (0) or I (1) but not supportive against I (2) variable. The model under the framework of ARDL methodology is as follows;
(1)
(1)
(2)
(2)
Where ER denotes the Exchange rate of China and the USA, two proxies of COVID-19 have been applied to fulfil the prime objectives of the study, one is COVID-19(cases), and the second is COVID-19(deaths) in two countries. Furthermore and
Are error terms that required to be white noise. The long-run model for the baseline ARDL model can be written as;
(3)
(3)
(4)
(4)
Similarly following is the short-run model with error correction terms can be written as;
(5)
(5)
(6)
(6)
The coefficient of error correction term measures the speed of adjustment towards long-run equilibrium. The structural lags are selected based on Akaike Information Criteria (AIC).
The Pesaran et al. (Citation2001) bound test of co-integration was used to access the linkage among the pandemic's exchange rate returns and proxies. The null hypothesis of the bound co-integration test claims that there will be no co-integration among the variables. The test statistic of the Bound test is the Wald test based on the F statistic. The critical values can be obtained from Pesaran et al. (Citation2000) and Pk (Citation2005) although (Pk, Citation2005) are preferable as it performs well for small samples. The null hypothesis of no co-integration will be rejected if the F statistic seems to be larger than the critical upper bound. Once the co-integration confirms, the unrestricted vector error correction model will be estimated to observe the model's long-run and short-run elasticities. Several diagnostic tests were used to access the residuals to ensure the model validation, i.e. free from serial correlation, heteroscedasticity, and incorrect functional form. The Cumulative Sum (CUSUM) and Cumulative Sum of Squares (CUSUMsq) test were used to confirm the model stability.
4. Estimation results
4.1. Graphical display and summary statistics
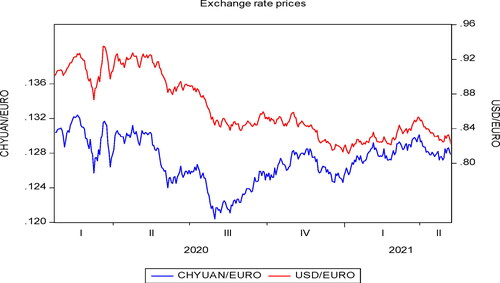
presents the exchange rate prices of China and the USA during the selected time period. It has been evident that the rates in the rates almost exhibited the same pattern in both countries. A sharp decline has been observed at the end of the third quarter of 2020 in CHYUAN/EURO; however, this is quickly recovered, and the upward trend is shown until the second quarter of 2021. The behaviour of USD/EURO seems to be similar to the CHYUAN/EURO from the last few months of 2020, indicating that during the COVID-19, exchange rates of both countries may linearly correlate with each other.
Figure 1. Time series plot of Exchange rates of China and the USA.
Source: Authors Estimation.
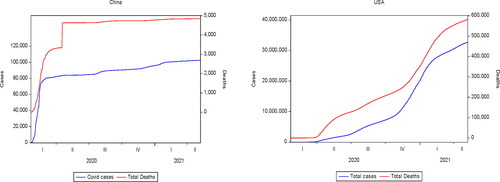
Daily COVID-19 confirmed cases and deaths for China and the USA are plotted and presented in . The left panel shows that the cases and deaths in China occurred in the same fashion after the second quarter of 2020. The constant increase in cases and deaths shows that the consequences of the pandemic are trying to restore the situation. On the other hand, the USA graph in the right pane indicates a linear trend with tremendous increment in the cases along with the reported deaths of the COVID-19, which somehow results in the downfall of 3.8% in the economic growth of the USA (Gormsen & Koijen, Citation2020).
Figure 2. Time series plot of the number of cases and deaths reported in China and the USA.
Source: Authors Estimation.
furnishes the results of summary statistics of the variables used in the study. The average negative exchange rate returns of both countries are illustrating the impact of COVID-19 on the currencies. On average, 87,316.99 and 1,1301,333 daily cases were reported in China and the USA during the selected time period. A maximum of 48,465 and 80,999 deaths was recorded in China and the USA, representing the massive loss of lives in the world's most developed nation. Overall all the variables under study are non-normal, which has been evident by high kurtosis and significant JB test values.
Table 1. Summary statistics of variables under study.
The result of unit root tests, given in . The test outcome reveals that the exchange rate for both China and the USA is stationary, but COVID-19 cases and deaths show the non-stationary result at level and stationary at first difference. We implemented the (Zivot & Andrews, Citation2002) test to detect a single structural break in the exchange rate series as it performs better than the test without incorporating the structural break. Overall the results show that incorporating the structural breaks favours the stationarity of the series at levels for both countries. Moreover, in the presence of a structural break, COVID-19 cases and deaths show a non-stationary series at level but stationary after the first difference. Hence the mixed number of integration stimulates us to move towards the ARDL bound test of co-integration. Moreover, explains the findings of bound testing co-integration, and findings confirm the evidence of the long-run relationship between exchange rate and COVID19 in the USA and China.
Table 2. Outcomes of the unit root test with and without structural break.
Table 3. Estimation results of ARDL Bound test of cointegration.
4.2. Cointegration analysis and long(short)-run relationship
The preliminary step in moving towards the ARDL model is to test the long-run relationship among the variables under study. The selection of suitable lag length has been performed based on the least value of Akaike Information Criteria. The results have been displayed in . The F-statistic seems to be significant at a 5% level of significance, and three co-integrating vectors are evident by taking Exchange returns, logCOVID-19(cases) and logCOVID-19 deaths as the response variable.
The estimates of the long-run and short-run exchange rate models for China and the USA are displayed in . The long-run results show that although the coefficient differs in magnitude but appears to be negative and significant for both countries in the scenario of COVID-19 cases. Similarly, the trend variable augmented in the model to capture the effect of structural breaks in the dependent variable is positive and significant. As far as short-run estimates are concerned, all the coefficients possess the expected signs and also significant at a 5% level of significance. Hence, the rising number of COVID-19 cases in both countries negatively impacts their currencies; however, the magnitude of the coefficient is not remarkable. Moreover, the error correction term (ECT) coefficient seems to be negative and statistically significant. This implies that the Exchange rate converges toward the long-run equilibrium of 2.8% in a period with an adjustment rate via COVID-19 cases in China. For the US, the speed of adjustment is found to be 9.2%, and it is also statistically significant. It is worth noting that the exchange rate model is improved by 9.2% every day to acquire a steady long-term relationship since short-term blows. Furthermore, the diagnostic measures for both China and the USA confirm the absence of multicollinearity and heteroscedasticity in the model. The errors of the model are normally distributed. Thus, these diagnostic tests confirmed the efficiency, consistency and stability of the model. and have plotted for the CUSUM test. It has been evident from the figure that the model is stable, and a 95% confidence interval is significant for both China and the USA when the COVID-19 cases proxy was incorporated in the model.
Figure 3. CUSUM stability test of China and the USA for COVID-19 cases.
Source: Authors Estimation.
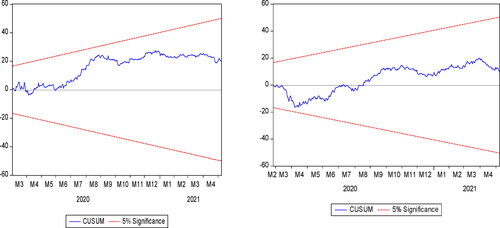
Figure 4. CUSUM stability test of China and the USA for COVID-19 Deaths.
Source: Authors Estimation.
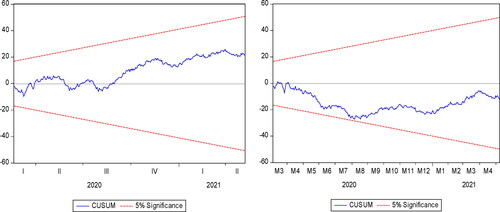
Table 4. Estimation results of ARDL long (short) run estimates with COVID-19 cases.
presents the result of the long-run and short-run impact of COVID-19 deaths on the Exchange rate for China and the USA. The estimates of the long-run model portray a negative and significant relationship between the exchange rate and the COVID-19 deaths for both countries, i.e. China and the US. Similarly, the dummy variable for a structural break at intercept is statistically significant for China and the USA. Moreover, the coefficient of the ECT is 5.6% (negative) and statistically significant, indicating that the Exchange rate moves on the way to the long-run equilibrium of 2.8% daily with the rate of adjustment by COVID-19 deaths in China. For the USA, the coefficient of the ECT is −4.3% and also statistically significant. The suggested ARDL model with the proxy of COVID-19 for China and the USA passes the hurdle of model adequacy measures and found to be an effective model in explaining the variation of currencies.
Table 5. Estimation results of ARDL long (short) run estimates with COVID-19 deaths.
5. Conclusions and policy suggestions
The magnitude of the destruction caused by the pandemic cannot be measured or forecasted accurately, as nobody knows how long it will exist in the world. Lockdowns and isolation are creating social problems, but the common man's livelihood is also affected through its presence. The economic and financial institutions of various countries are collapsed, and the recovery period is still going on at various levels. In such circumstances, the currency plays a vital role in accessing the financial position of any country. If the exchange rate is deteriorating, the purchasing power will be affected, ultimately leading the country towards high inflation. Thus analysing the influence of various factors on the exchange rate is of serious concern for policymakers and high officials of the state.
This study attempts to explore the relationship between the currencies of China and the USA during the time period of novel coronavirus. USD/EURO and CHYUAN/EURO have been considered for the USA and China. Two proxies were engaged for COVID-19, i.e. a total number of daily confirmed reported cases and deaths in China and the USA from January 22, 2020, till May 7, 2021. Three days moving average method was employed to uniform the frequency of data for five days a week. The prerequisite of application of ARDL model that none of the series will be I(2), the study deployed (Dickey & Fuller, Citation1979, Dickey & Fuller, Citation1981) and (Zivot & Andrews, Citation2002) test and confirmed that all the variables are of mixed integration but only I(0) and I(1). Moving towards the bound test of co-integration to establish the long-run association among the currencies of China and the USA with COVID-19 (cases) and COVID-19(deaths). Three co-integrating vectors were suggesting the existence of co-integration for both countries. After confirming the long term movement between the response and explanatory variables, the proposed ARDL has been obtained. The ARDL model results reveal that both proxies negatively influenced the exchange rate of China and the USA, respectively. The effect of structural break is also significant, reflecting the influence of pandemic on currencies of Chin and the USA. The speed of adjustment is also found to be moderate in both cases. Overall, the pandemic affected China and the USA in early 2020 while economies are trying to regain their global status in economic and financial positions.
This study opens various avenues for the future in the context of exchange rates research, especially for China and the USA. The rising number of COVID-19 (cases) and deaths are evident in the exchange rate returns for both countries. This is high time for both countries to regain their financial position around the globe. More sophisticated statistical and econometric techniques are required to enhance the pandemic's impact and provide further insight to control the situation. Economic growth, trade, health expenditure and various economic and financial variables will help predict the exchange rates. More proxies of COVID-19 can also help explain to the currency model as vaccination doses have started across the globe.
Disclosure statement
No potential conflict of interest was reported by the authors.
Additional information
Funding
References
- Alam, I., & Quazi, R. (2003). Determinants of capital flight: An econometric case study of Bangladesh. International Review of Applied Economics, 17(1), 85–103. https://doi.org/10.1080/713673164
- Albulescu, C. (2020). Do COVID-19 and crude oil prices drive the US economic policy uncertainty? ArXiv Preprint ArXiv, 2003(07591).
- Apergis, N., & Apergis, E. (2020). The role of Covid-19 for Chinese stock returns: Evidence from a GARCHX model. Asia-Pacific Journal of Accounting & Economics, 1–9.
- Banerjee, A., Dolado, J., & Mestre, R. (1998). Error‐correction mechanism tests for cointegration in a single‐equation framework. Journal of Time Series Analysis, 19(3), 267–283. https://doi.org/10.1111/1467-9892.00091
- Boswijk, H. P. (1994). Testing for an unstable root in conditional and structural error correction models. Journal of Econometrics, 63(1), 37–60.
- CAMBA, A. L., & CAMBA, A. C., Jr. (2020). The effect of COVID-19 pandemic on the Philippine stock exchange, Peso-Dollar Rate and retail price of diesel. The Journal of Asian Finance, Economics and Business, 7(10), 543–553. https://doi.org/10.13106/jafeb.2020.vol7.no10.543
- Cepoi, C.-O. (2020). Asymmetric dependence between stock market returns and news during COVID-19 financial turmoil. Finance Research Letters, 36, 101658. https://doi.org/10.1016/j.frl.2020.101658
- Devpura, N. (2021). Effect of COVID-19 on the relationship between Euro/USD exchange rate and oil price. MethodsX, 8, 101262. https://doi.org/10.1016/j.mex.2021.101262
- Dickey, D. A., & Fuller, W. A. (1981). The likelihood ratio statistics for autoregressive time series with a unit root. Econometrica, 49(4), 1057–1072. https://doi.org/10.2307/1912517
- Dickey, D. A., & Fuller, W. A. (1979). Distribution of the estimators for auto regressive time series with a unit root. Journal of the American Statistical Association, 74(366a), 427–431. https://doi.org/10.2307/1912517
- Engle, R. F., & Granger, C. W. (1987). Co-integration and error correction: Representation, estimation, and testing. Econometrica, 55(2), 251–276. https://doi.org/10.2307/1913236
- Erokhin, V., & Gao, T. (2020). Impacts of COVID-19 on trade and economic aspects of food security: Evidence from 45 developing countries. International Journal of Environmental Research and Public Health, 17(16), 5775. https://doi.org/10.3390/ijerph17165775
- Feng, G.-F., Yang, H.-C., Gong, Q., & Chang, C.-P. (2021). What is the exchange rate volatility response to COVID-19 and government interventions? Economic Analysis and Policy, 69, 705–719. https://doi.org/10.1016/j.eap.2021.01.018
- Gao, X., Ren, Y., & Umar, M. (2021). To what extent does COVID-19 drive stock market volatility? A comparison between the U.S. and China. Economic Research-Ekonomska Istraživanja, 1–21. https://doi.org/10.1080/1331677X.2021.1906730
- Gherghina, Ș. C., Armeanu, D. Ș., & Joldeș, C. C. (2020). Stock market reactions to Covid-19 pandemic outbreak: Quantitative evidence from ARDL bounds tests and Granger causality analysis. International Journal of Environmental Research and Public Health, 17(18), 6729. https://doi.org/10.3390/ijerph17186729
- Gormsen, N. J., & Koijen, R. S. (2020). Coronavirus: Impact on stock prices and growth expectations. The Review of Asset Pricing Studies, 10(4), 574–597. https://doi.org/10.1093/rapstu/raaa013
- Govindaraju, V. C., & Tang, C. F. (2013). The dynamic links between CO2 emissions, economic growth and coal consumption in China and India. Applied Energy, 104, 310–318. https://doi.org/10.1016/j.apenergy.2012.10.042
- Griffith, R., Levell, P., & Stroud, R. (2020). The impact of COVID‐19 on share prices in the UK. Fiscal Studies, 41(2), 363–369. https://doi.org/10.1111/1475-5890.12226
- Handoyo, R. D. (2020). Impact of COVID 19 on trade, FDI, real exchange rate and era of digitalization: Brief review global economy during pandemic. Journal of Developing Economies, 5(2), 86–90. https://doi.org/10.20473/jde.v5i2.23641
- Johansen, S. (1988). Statistical analysis of cointegration vectors. Journal of Economic Dynamics and Control, 12(2-3), 231–254. https://doi.org/10.1016/0165-1889(88)90041-3
- Johansen, S., & Juselius, K. (2009). Maximum likelihood estimation and inference on cointegration—With appucations to the demand for money. Oxford Bulletin of Economics and Statistics, 52(2), 169–210. https://doi.org/10.1111/j.1468-0084.1990.mp52002003.x
- Lundgren, E., Outtara, L., Mikkelsen, A., Andersen, J. N., Sefert, W., & Samuelson, L. (2004). A cross-sectional STM study of nanowhiskers. In APS March Meeting Abstracts (Vol. 2004, pp. R1–290).
- Mirza, N., Hasnaoui, J. A., Naqvi, B., & Rizvi, S. K. A. (2020). The impact of human capital efficiency on Latin American mutual funds during Covid-19 outbreak. Swiss Journal of Economics and Statistics, 156(1), 16–17. https://doi.org/10.1186/s41937-020-00066-6
- Mirza, N., Naqvi, B., Rahat, B., & Rizvi, S. K. A. (2020). Price reaction, volatility timing and funds’ performance during Covid-19. Finance Research Letters, 36, 101657. https://doi.org/10.1016/j.frl.2020.101657
- Pasiouras, A., & Daglis, T. (2020). The dollar exchange rates in the Covid-19 era: Evidence from 5 currencies. European Research Studies Journal, 23(Special 2), 352–361.
- Perron, P. (1988). Trends and random walks in macroeconomic time series: Further evidence from a new approach. Journal of Economic Dynamics and Control, 12(2-3), 297–332. https://doi.org/10.1016/0165-1889(88)90043-7
- Pesaran, M. H., Shin, Y., & Smith, R. J. (2001). Bounds testing approaches to the analysis of level relationships. Journal of Applied Econometrics, 16(3), 289–326.
- Pesaran, M. H., Shin, Y., & Smith, R. J. (2000). Structural analysis of vector error correction models with exogenous I (1) variables. Journal of Econometrics, 97(2), 293–343. https://doi.org/10.1016/S0304-4076(99)00073-1
- Pesaran, M. H., Shin, Y., & Smith, R. P. (1999). Pooled mean group estimation of dynamic heterogeneous panels. Journal of the American Statistical Association, 94(446), 621–634. https://doi.org/10.1080/01621459.1999.10474156
- Peseran, M. H., & Peseran, B. (1997). Working with Microfit 4: Interactive econometric analysis. Oxford University Press.
- Phillips, P. C., & Perron, P. (1988). Testing for a unit root in time series regression. Biometrika, 75(2), 335–346. https://doi.org/10.1093/biomet/75.2.335
- Pk, N. (2005). The saving and investment nexus for China: Evidence from cointegration tests. Appl Econ, 37(17), 1979–1990.
- Rizvi, S. K. A., Mirza, N., Naqvi, B., & Rahat, B. (2020). Covid-19 and asset management in EU: A preliminary assessment of performance and investment styles. Journal of Asset Management, 21(4), 281–291. https://doi.org/10.1057/s41260-020-00172-3
- Rizvi, S. K. A., Yarovaya, L., Mirza, N., & Naqvi, B. (2020). The impact of COVID-19 on valuations of non-financial European firms. Available at SSRN 3705462.
- Sezgin, S., & Yildirim, J. (2002). The demand for Turkish defence expenditure. Defence and Peace Economics, 13(2), 121–128. https://doi.org/10.1080/10242690210973
- Su, C.-W., Dai, K., Ullah, S., & Andlib, Z. (2021). COVID-19 pandemic and unemployment dynamics in European economies. Economic Research-Ekonomska Istraživanja, 1–13. https://doi.org/10.1080/1331677X.2021.1912627
- Su, C.-W., Huang, S.-W., Qin, M., & Umar, M. (2021). Does crude oil price stimulate economic policy uncertainty in BRICS? Pacific-Basin Finance Journal, 66, 101519. https://doi.org/10.1016/j.pacfin.2021.101519
- Su, C.-W., Song, Y., & Umar, M. (2021). Financial aspects of marine economic growth: From the perspective of coastal provinces and regions in China. Ocean & Coastal Management, 204, 105550. https://doi.org/10.1016/j.ocecoaman.2021.105550
- Syed, A. A. S., & Fatima, K. (2021). The impact of COVID-19 on stock market volatility in Pakistan. ArXiv Preprint ArXiv, 2103, 03219.
- Umar, M., Ji, X., Kirikkaleli, D., Shahbaz, M., & Zhou, X. (2020). Environmental cost of natural resources utilization and economic growth: Can China shift some burden through globalization for sustainable development? Sustainable Development, 28(6), 1678–1688. https://doi.org/10.1002/sd.2116
- Umar, M., Mirza, N., Rizvi, S. K. A., & Furqan, M. (2021a). Asymmetric volatility structure of equity returns: Evidence from an emerging market. The Quarterly Review of Economics and Finance, https://doi.org/10.1016/j.qref.2021.04.016
- Umar, M., Rizvi, S. K. A., & Naqvi, B. (2021b). Dance with the devil? The nexus of fourth industrial revolution, technological financial products and volatility spillovers in global financial system. Technological Forecasting and Social Change, 163, 120450. https://doi.org/10.1016/j.techfore.2020.120450
- Umar, M., Su, C.-W., Rizvi, S. K. A., & Shao, X.-F. (2021c). Bitcoin: A safe haven asset and a winner amid political and economic uncertainties in the US? Technological Forecasting and Social Change, 167, 120680. https://doi.org/10.1016/j.techfore.2021.120680
- Yarovaya, L., Mirza, N., Abaidi, J., & Hasnaoui, A. (2021). Human capital efficiency and equity funds’ performance during the COVID-19 pandemic. International Review of Economics & Finance, 71, 584–591. https://doi.org/10.1016/j.iref.2020.09.017
- Zivot, E., & Andrews, D. W. K. (2002). Further evidence on the great crash, the oil-price shock, and the unit-root hypothesis. Journal of Business & Economic Statistics, 20(1), 25–44. https://doi.org/10.1198/073500102753410372