
 ?Mathematical formulae have been encoded as MathML and are displayed in this HTML version using MathJax in order to improve their display. Uncheck the box to turn MathJax off. This feature requires Javascript. Click on a formula to zoom.
Abstract
To fill the gap in the research on the convergence trend of air pollutants since 2013 in China and overcome the Galton fallacy caused by the parametric regression method, this study examines the convergence trend of the annual average concentration of fine particulate matter 2.5 (PM2.5) in China’s prefecture-level cities after 2013 using a distribution dynamic approach. The winter PM2.5 pollution in Chinese cities is severe. Hence, the convergence of the average winter PM2.5 concentration of prefecture-level cities is also explored in this study. The results show that during 2015–2019, the annual average PM2.5 concentration level improved significantly. However, the average PM2.5 winter concentration level in 2015–2018 did not significantly decrease, with some cities showing severe pollution levels. The annual average PM2.5 of China's prefecture-level cities exhibit club convergence, while the PM2.5 concentration in winter exhibits ‘unikurtosis’. In the long run, the annual average PM2.5 clusters around two levels, at approximately 35 μg/m3 and 60 μg/m3, while the average PM2.5 in winter is concentrated at 100 μg/m3. In the long run, in the central region, PM2.5 pollution is more severe than in northern and southern areas, regardless of the annual or winter average PM2.5 concentration.
1. Introduction
In recent years, environmental pollution has become a major obstacle to global sustainable development, especially in China. Air pollution creates health risks for people worldwide (Zeng et al., Citation2020). For example, Li et al. (Citation2021) show that fine particulate matter 2.5 (PM2.5) is related to an increase in paediatric outpatient visits for respiratory diseases in four Chinese cities. Meanwhile, air pollution also affects a country’s economic growth and industrial structure, hindering its innovation ability, a crucial factor for sustainable development (Gil-Alana et al., Citation2020; Luo et al., Citation2019; Saunila, Citation2020). On 12 September 2013, the State Council of China issued the ‘Ten Measures of the Air Pollution Prevention and Control Action Plan’ to promote air quality improvement (henceforth, the Ten Measures for the Atmospheric Country). The policy was enacted between September 2013 and the end of 2017. According to the final assessment results of the plan implementation notified by the Ministry of Ecology and Environment of China, the Chinese government has fully achieved the environmental air quality improvement objectives set out in the Ten Articles of the Atmospheric Country in 2017.
2013 is the turning point year of China's air pollution, after which the air pollution situation of Chinese cities has been improving. On the one hand, since 2013, the literature on air pollution improvement has mainly focused on evaluating this policy. For example, Yang et al. (Citation2020) use the difference-in-difference (DID) method to test the impact of said policy on the monthly average emissions of major air pollutants such as PM2.5, PM10, sulphur dioxide (SO2), nitrogen dioxides (NO2), carbon monoxide (CO), and ozone (O3). On the other hand, some studies focus on the quantitative assessment of the environmental health benefits generated by the policy. For example, Wu et al. (Citation2019) argue that policy implementation has prevented approximately 60,213 premature deaths. However, to the best of our knowledge, very few studies have addressed the convergence of China's air pollutant emissions since the implementation of the 2013 policy. Can the cities with different initial air pollution levels converge to the same level, and can the cities with poor air quality catch up with the cities with good air quality, so as to achieve the goal of overall improvement of national air pollution? These issues are among the core problems in the study of concentration convergence of air pollutants and are also of interest to the government and researchers. Hence, this study drew on the convergence mechanism that characterises economic development to examine the convergence characteristics of air pollutant concentrations in prefecture-level cities in China since implementing the Ten Articles of the Atmospheric Country in 2013.
Convergence theory is an essential corollary of the Solow model of neoclassical growth (Solow, Citation1956) originally used to study the convergence of per capita income across different economies. Convergence may be divided into various categories, such as beta convergence, sigma convergence, and club convergence (Blanco et al., Citation2020; Haller et al., Citation2021; Yu & Zhang, Citation2015). The environmental convergence hypothesis is closely related to the economic convergence hypothesis. Strazicich and List (Citation2003) find an inverted U-shaped relationship between pollutant emissions and income in different stages of economic development, that is, the so-called environmental Kuznets curve (EKC). If the EKC and economic convergence hypothesis hold, we expect to observe environmental convergence (Nguyen-Van, Citation2005). Some studies provide empirical support to the EKC curve (Li, Citation2016; Rahman et al., Citation2019; Wawrzyniak & Doryń, Citation2020) but also indicate that the EKC curve does not hold in China (Liu & Pei, Citation2017). No consensus in the literature exists as to whether an EKC curve holds in China. Moreover, addressing the EKC curve can only clarify whether environmental convergence is observed, with no indication regarding the convergence speed and club convergence. Therefore, the changing trend of environmental variables in different regions or countries should be assessed using a quantitative approach. Many studies have been conducted in this area. List (Citation1999) applies convergence theory to environmental issues for the first time, performing a convergence analysis on the emissions of SO2 and nitrogen oxides in different states in the United States. The results show that air pollution exhibits a trend of convergence. Carbon dioxide (CO2) convergence is the primary focus of research on the convergence of air pollutant emissions at home and abroad (Apergis et al., Citation2017; Camarero et al., Citation2013; Wu & He, Citation2017; Xu, Citation2010, Citation2013), but various studies also address the convergence of SO2 and haze pollution (Cai et al., Citation2017; Yu & Zhang, Citation2015).
However, as mentioned above, few studies have addressed the convergence characteristics of China's air pollutant emissions since the implementation of the Ten Articles of the Atmospheric Country. In addition, most previous studies on convergence have adopted parametric regression methods. When the distribution of the studied variables tends to be concentrated, divergent, or unchanged, a negative correlation may be observed between the economic growth rate and the initial conditions. Hence, the sign of convergence is not sufficient to judge whether the economy is convergent, divergent, or stable. This problem is called the Galton fallacy (Huang & Xia, Citation2014; Quah, Citation1993). Quah (Citation1996a, Citation1996b, Citation1996c, Citation1997) proposes a non-parametric distribution dynamic method, which redefines the connotation of club convergence, compensating for the fact that the parametric regression method only focuses on whether a single country or region tends to its steady state. Parametric regressions cannot explain the phenomena of cross-regional changes, stratification, and polarisation and cannot analyze the long-term trend of the PM2.5 concentration in Chinese cities when time tends to infinity (Criado & Grether, Citation2011; Duro, Citation2013; Wu & He, Citation2017; Wu et al., Citation2021; Yutao, Citation2013).
The contributions of this study are as follows: (1) This study fills the gap in the study of the convergence of the annual average concentration of PM2.5 in prefecture-level cities in China since the implementation of the Ten Atmospheric Countries in 2013. (2) As far as we know, our study is the first time to use the method of distribution dynamic to study the convergence of PM2.5 pollution in Chinese cities. (3) There are few studies on the convergence of air pollution in specific seasons. The winter PM2.5 pollution in Chinese cities is severe (Wang et al., Citation2020). Hence, this study also examines the convergence of the average winter PM2.5 concentration of prefecture-level cities in China since 2013.
The remainder of this paper is organised as follows. Section 2 presents the distribution dynamic analysis framework and the data. Section 3 reports the results and discussion, and the last section provides our concluding remarks and discusses the study’s policy implications.
2. Materials and methods
To overcome the limitations of traditional convergence analysis methods, Quah (Citation1996b, Citation1996c, Citation1997) proposes a distribution dynamic approach to analyse the dynamics of economic growth. The distribution dynamic method has also been employed to study the distribution of pollutant emissions. Two different distribution dynamic methods exist: discrete and continuous. Due to the simplicity of the calculation, most studies use discrete methods to estimate the transition probability matrix and the corresponding ergodic distribution, but the estimation results of discrete methods are very sensitive to the discretisation process (Johnson, Citation2005; Quah, Citation1997). To solve this problem, Quah (Citation1997) proposes a kernel method to estimate the transition probability and ergodic distribution of an infinite state space. This continuous distribution dynamic method does not require discretisation of variables. Therefore, it can be considered an improved version of the discrete method (Wu et al., Citation2021).
2.1. The distribution dynamic method
2.1.1. Kernel density estimation of PM2.5 in Chinese cities
Quah's analysis framework comprises three steps. The first is to estimate the probability density of the variables. In general, the kernel density estimation method is used.
Let be a sample from the probability density
where
is an unbounded support set, and the traditional kernel density estimation reads:
(1)
(1)
where K(.) is the kernel function, and h is the bandwidth
The kernel function satisfies the following condition:
We used the Gaussian kernel: Through the smooth curve generated by EquationEq. (1)
(1)
(1) , we intuitively obtained the overall shape of the PM2.5 concentration distribution in each city and initially explore the existence of club convergence.
2.1.2. Transition probability estimation
Although the kernel density estimates at the beginning and the end of the period provide an initial assessment of the evolution of the PM2.5 concentration level distribution, a direct comparison of kernel densities cannot reflect changes in different locations within the city. Even if the PM2.5 concentration level distribution does not change significantly over time, changes may still be observed in different regions within the distribution. The transition probabilities between different periods provide information on the flows within a city. Therefore, the second step of the Quah’s analysis framework estimates the transition probabilities. A discrete and the continuous method exist for estimating the transition probability. The advantage of the discrete method is intuitive, and the advantage of the continuous method is that it can overcome some of the information loss characterising the discretisation process. Hence, this study combined the two methods to study the internal mobility of cities.
2.1.2.1. Discretised transition probability
The discretisation of the transition probability estimation first needs to determine the various states. The Ambient Air Quality Standards (GB 3095—2012) formulated by the Ministry of Environmental Protection of China divides the PM2.5 index into six levels according to the classification of air quality levels. A ‘good’ level (a pollution level that does not cause significant adverse effects on human health) entails two intensities: ‘excellent’ and ‘good’. There are four levels of ‘harmful’ (a pollution level that causes significant adverse effects on human health): ‘light’, ‘medium’, ‘heavy’, and ‘severe’ ‘light’, ‘medium’, ‘heavy’, and ‘severe’ ().
Table 1. Air quality grade corresponding to the PM2.5 index.
Based on the average concentration of PM2.5, this study divided Chinese cities into four urban agglomerations ().
Table 2. PM2.5 urban agglomerations.
Assuming that the state of urban air pollution at time t is a random variable to examine the evolution of the urban air pollution distribution club, we considered the first-order discrete transition probability, that is, the probability of a transition from state
at time
to state
at time t:
(2)
(2)
where
represents the frequency of state
is the frequency of transition from state
to
and
represents the probability matrix of the transition from state
to
2.1.2.2. Continuous transition probability
Let and
denote the cross-sectional distribution density of China's prefecture-level city PM2.5 at time
and time
respectively, where
Assuming that the evolution of the distribution is a time-invariant first-order distribution, the future income distribution
may be estimated as follows:
(3)
(3)
where
is the transition probability that determines the evolution process of PM2.5; in line with the discrete method, for any x, we obtain
(Johnson, Citation2005).
The continuous transition probability is estimated as follows (Hyndman et al., Citation1996):
(4)
(4)
where
is estimated by EquationEq. (1)
(1)
(1) , and
(5)
(5)
The two-dimensional kernel function uses the product kernel:
2.1.3. Continuous ergodic distribution
The third step of the Quah’s analysis framework estimates the ergodic distribution of the continuous states. Assuming that the transition probability does not change over time, the ergodic distribution analyses the long-term trend of the PM2.5 concentration in Chinese cities.
The expression of the ergodic distribution of the continuous state is at both ends of EquationEq. (3)
(3)
(3) :
(6)
(6)
where
is estimated using EquationEq. (4)
(4)
(4) . EquationEquation (6)
(6)
(6) is the second kind of homogeneous Fredholm integral equation for the ergodic distribution
This study used the iterative algorithm of Guo (Citation2007) to find an approximate solution for
In addition,
may be subject to short-term external shocks. However, in the long run, the ergodic distribution
is independent of the initial PM2.5 distribution and can be seen as an expansion of the transition probability (Johnson, Citation2005).
In distribution dynamic analyses, the ergodic distribution is represented by a kernel density map, while the three-dimensional graphs and contour maps are typically used to represent the continuous transition probability
The kernel density estimation of the continuous transition probability can be plotted on a two-dimensional contour map (the PM2.5 concentration level at time t on the x-axis and the PM2.5 concentration level at time + τ on the y-axis) and the corresponding three-dimensional map. According to Quah (Citation1997), a 45-degree diagonal line was added to the contour map. If the main part of the distribution is mainly around the 45 degree diagonal and parallel to the 45 degree diagonal, then the internal fluidity of the individual level is not high. If the overall PM2.5 is in a period of improvement (just in line with the situation in China after 2013), and the main body of the contour line is clockwise around a 45-degree diagonal, then the PM2.5 concentration levels in Chinese cities have a trend of convergence. If the main part of the distribution is parallel to the x-axis, it indicates a complete convergence of the variables (Huang & Xia, Citation2014).
2.2. Data sources and processing
The list of China's prefecture level cities in this study comes from China City Statistical Yearbook 2019 published by National Bureau of Statistics (Citation2020), with a total of 298 prefecture level cities.
2.2.1. Air pollutant data
Air pollutant data were obtained from the national urban air quality real-time release platform of the China Environmental Monitoring Station, including daily and hourly air pollution information from 1 January 2015 to 31 December 2019, from all Chinese observation sites. The data algorithms for obtaining air pollutants in 298 prefecture-level cities were as follows:
A: Since 2014, the number of PM2.5 monitoring stations in China has been constantly changing. In order to ensure the consistency of data collection, the observation sites in China from 1 January 2015 to 1 January 2016 are used, a total of 1497 sites. As some sites have too many default values by the end of 2019, the sites with a missing rate of more than 40% were discarded, a total of 38 sites were deleted, and 1459 valid sites were retained.
B: The Baidu Geocoder API (https://maplocation.sjfkai.com/) was employed to obtain the latitude and longitude of 298 prefecture-level cities. We then matched these data with air pollution observation sites to find the nearest station, used the data of this station as the air pollution information of the nearest city, and obtained 298 hourly observations for prefecture-level cities.
C: We calculated the average of the daily PM2.5 data of the 298 cities and then obtained the annual and winter (1 November–29 February) average of each city.
2.2.2. China's regions
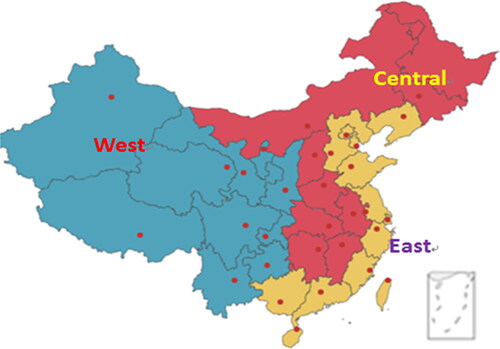
During the Seventh Five-Year Plan period, the State Planning Commission divided the country into three major zones—eastern, central, and western—according to the distance from the coastline and the level of economic development. The eastern region includes the 12 provinces and municipalities of Liaoning, Hebei, Beijing, Tianjin, Shandong, Jiangsu, Shanghai, Zhejiang, Fujian, Guangdong, Guangxi, and Hainan. The central region comprises Heilongjiang, Jilin, Inner Mongolia, Shanxi, Henan, Anhui, Hubei, Hunan, and Jiangxi. The western region includes Shaanxi, Gansu, Ningxia, Qinghai, Xinjiang, municipalities of Chongqing, Sichuan, Yunnan, Guizhou, and Tibet.
3. Results
3.1. Distribution dynamic of PM2.5 in Chinese cities
3.1.1. The overall changes in PM2.5
Many local governments in China have begun disclosing PM2.5 information since 2014. Comprehensive data are available from 2015. Therefore, this study used data from the 2015–2019 period. As mentioned above, wintertime was considered the period between 1 November in the current year to 29 February in the next year.
The left-hand panel of indicates that compared with 1998, the kurtosis of the PM2.5 kernel density estimates in 2013 clearly shifted to the right, and the kurtosis height dropped significantly, indicating a scattered ‘bikurtosis’. During 1998–2013, the overall PM2.5 level of Chinese cities deteriorated, showing a trend of club convergence. The right peak is near 60 μg/m3, indicating that the annual average PM2.5 concentration in many cities in China is relatively high.
Figure 1. Left: Annual average PM2.5 kernel density of Chinese cities from 1998 to 2013. Right: Annual average PM2.5 kernel density of Chinese cities from 2015 to 2019. Note: 1998–2013 average PM2.5 concentration data source: Columbia University project (van Donkelaar et al., Citation2016).
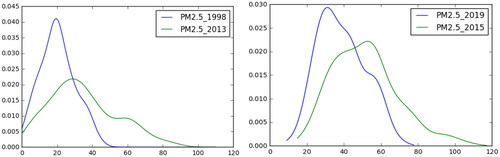
Since 2013, the State Council of China and local governments have taken active measures to control air pollution. The right-hand panel of indicates that compared with 2015, the PM2.5 kernel density curve in 2019 shifted significantly to the left, and the kurtosis height increased substantially, indicating a ‘bikurtosis’ pattern (right kurtosis is not evident). The results show that from 2015 to 2019, the overall PM2.5 concentration level of Chinese cities substantially decreased. Especially in cities with severe tail pollution, a tendency towards club converge is suggested but not evident. Most cities exhibit left kurtosis (35 μg/m3).
3.1.2. China's inter-city mobility and convergence
The kernel density estimation curves at the beginning and the end of China’s urban PM2.5 distribution describe the overall morphological changes in the PM2.5 distribution. However, these values do not reflect changes in inter-city mobility. In this study, the discrete transition probability matrix was used to examine the mobility of Chinese urban agglomerations and between urban agglomerations. Based on the continuous transition probability three-dimensional map and contour map, we further studied the convergence of Chinese urban PM2.5 levels.
As shown in , most urban agglomerations reduced their PM2.5 pollution during the sample period, except for a small number of cities in the superior urban agglomerations. The transfer status of urban agglomerations is that of neighbouring urban agglomerations, indicating that China achieved success in treating PM2.5 pollution, but further measures are still needed.
Table 3. The transition probability matrix of PM2.5 in Chinese cities from 2015 to 2019.
All members of the ‘lightly polluted urban agglomeration’ shifted towards the ‘good urban agglomeration’, indicating that China achieved remarkable results in the governance of cities with high PM2.5 pollution. However, further measures need to be introduced in the future to promote their transition to a ‘superior urban agglomeration’. The internal mobility of ‘good urban agglomeration’ is more significant than that between other urban agglomerations. It is worth mentioning that cities in a ‘good urban agglomeration’ only shifted towards a ‘superior urban agglomeration’. The internal mobility of the ‘superior urban agglomeration’ is much greater than the mobility between clubs. Almost all cities in the ‘superior urban agglomeration’ remained in the same category during the sample period.
Overall, cities in superior urban agglomerations did not witness worsened pollution levels, while polluting cities shifted towards good urban agglomerations. Approximately 63% of the cities in a ‘good urban agglomeration’ remained in this category, and approximately 37% shifted towards a ‘superior urban agglomeration’. Preliminary analysis showed that Chinese cities form clusters in a ‘superior urban agglomeration’ and ‘good urban agglomeration’, and the distribution of PM2.5 in Chinese cities generates a ‘multi-peak’ pattern, showing a club convergence trend.
The left-hand panel of is the three-dimensional map of the PM2.5 transition probability density from 2015 to 2019, and the right-hand panel represents the two-dimensional contour map of the PM2.5 transition probability density for the same period (the projection of the left-hand panel figure).
Figure 2. Left: 2015–2019 PM2.5 transition probability density three-dimensional diagram. Right: 2015–2019 PM2.5 transition probability density two-dimensional contour.
Source: Organized by the authors.
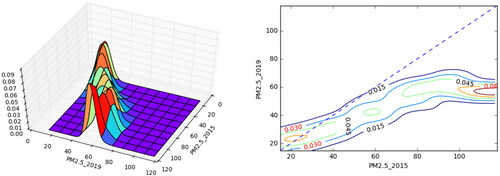
The analysis of discrete transition probability only showed that approximately 63% of the ‘good urban agglomeration’ cities in this interval remained inside the original club. Whether these cities improved their PM2.5 levels cannot be determined by discrete transition probabilities. The continuous transition probability image (, right-hand panel) clearly shows that the portion of 36–75 μg/m3 is almost entirely below the 45-degree diagonal, indicating that the annual average PM2.5 concentration of cities in this range decreased from 2015 to 2019.
Overall, the transition probability contour lines are almost entirely below the 45-degree line, with a clockwise shape, which indicates that almost all cities improved their PM2.5 levels. Cities with a lower initial level of PM2.5 exhibit a lower improvement rate, while cities with a higher initial level of PM2.5 improved significantly, which means that the PM2.5 concentration level of Chinese cities shows a convergence trend during the sample period.
Furthermore, the high-end of the distribution (approximately greater than 75 μg/m3) is almost parallel to the x-axis (y = 60), implying that cities with severe air pollution tend to gather at 60 μg/m3, forming a club. The low-end of the distribution (less than 35 μg/m3) is partly above the 45-degree diagonal, which means that the PM2.5 concentration of some cities in a ‘superior urban agglomeration’ increased, while the PM2.5 concentration of cities with ‘good’ grades declined; hence, these two types of cities may form a club at the junction of superior and good grades (35 μg/m3).
If the conditional probability does not change with time, that is, the governance intensity remains unchanged, will the distribution of PM2.5 in Chinese cities exhibit stratification and polarisation in the long run? Will it eventually form a club? The answer to these questions may be obtained using continuous ergodic distribution analysis (instead of parametric regression).
3.1.3. Long-term PM2.5 distribution in Chinese cities
The ergodic distribution is unrelated to the initial distribution; it is an enlarged version of the transition probability and long-term steady-state distribution. The left-hand side of shows the ergodic distribution in 1998–2013 and 2015–2019, while the right-hand side of depicts the actual distribution in 2019 and the ergodic distribution in 2015–2019.
Figure 3. Left: The ergodic distribution in 1998–2013 and 2015–2019. Right: The actual distribution in 2019 and the ergodic distribution in 2015–2019.
Source: Organized by the authors.
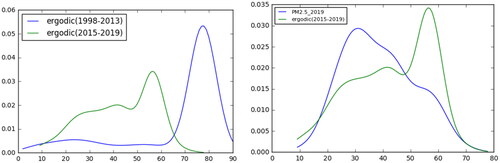
From a long-term perspective, the ergodic distribution between 1998 and 2013 (the left-hand side of ) indicates that if the government does not implement effective measures to prevent air pollution (the transition probability remains unchanged), most cities will concentrate around a kurtosis of approximately 80 μg/m3, while the limit of PM2.5 for light pollution is 75 μg/m3. In contrast, between 2015 and 2019, after the Chinese government introduced strict pollution control measures, the kurtosis of the ergodic distribution dropped significantly and shifted to the left, and the overall distribution became more dispersed, showing a ‘bikurtosis’ situation. The ‘club convergence’ observed in and indicates that if the Chinese government maintains the current intensity of pollution control, the annual average concentration of PM2.5 in Chinese cities will improve in the long run.
As shown in the right-hand side of , the distribution of PM2.5 in Chinese cities in 2019 shows insignificant ‘bikurtosis’. The left kurtosis is approximately 35 μg/m3, while the right kurtosis is approximately 60 μg/m3, and the right kurtosis is significantly lower than the left. The graph of the ergodic distribution indicates that its right kurtosis (near 60 μg/m3) is significantly higher than other kurtosis values, suggesting that in the long run, if the transition probability does not change with time, many Chinese cities will tend to concentrate around 60 μg/m3, a relatively high annual average level of PM2.5 compared to the 35 μg/m3 observed in 2019. Therefore, the government should continue to increase urban air pollution control efforts. As mentioned above, on 27 June 2018, the State Council of China issued the Three-Year Action Plan for Winning the Blue Sky War, confirming that the Chinese government attaches great importance to air pollution.
3.2. Distribution dynamic in winter
3.2.1. Overall changes in PM2.5 in Chinese cities in winter
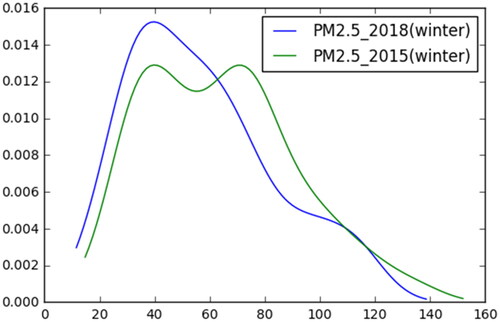
indicates that the average winter PM2.5 distribution in Chinese cities in 2018 is rather concentrated, showing an inconspicuous bimodality pattern, with the left kurtosis more pronounced than right kurtosis. The left kurtosis in the vicinity of 40 μg/m3 indicates that the PM2.5 pollution in Chinese cities in winter improved to some extent. However, in 2018, the city’s winter average PM2.5 concentration is mostly greater than 75 μg/m3 (the threshold value of light pollution per day), and a less evident right kurtosis is formed near 110 μg/m3. These results show that although the overall PM2.5 pollution situation improved in winter, the improvement in severely polluted cities is limited.
Figure 4. The distribution of average PM2.5 in winter in Chinese cities from 2015 to 2018.
Source: Organized by the authors.
3.2.2. Mobility and convergence between Chinese cities in winter
As shown in , overall, the cities in the four urban agglomerations decreased their PM2.5 concentration levels, especially cities with severe pollution. However, a considerable proportion (45%) of lightly polluted urban agglomerations remained in the same category, with no significant improvement in their PM2.5 pollution levels. The government should strengthen pollution control measures in this part of the city.
Table 4. The transition probability matrix of winter PM2.5 in Chinese cities from 2015 to 2018.
Almost all members of the ‘severely polluted urban agglomeration’ shifted towards the ‘lightly polluted urban agglomeration’, indicating that China achieved remarkable results in the governance of cities with severe PM2.5 pollution. However, pollution-reduction measures need to be strengthened to further promote the transition towards a ‘good urban agglomeration’ and ‘superior urban agglomeration’. The internal mobility of ‘lightly polluted urban agglomerations’ is almost identical to the mobility between urban agglomerations. Many large cities remained in their original urban agglomerations, and some cities shifted towards ‘heavily polluted urban agglomerations’. Hence, the government needs to strengthen pollution control measures for ‘lightly polluted urban agglomerations’. The internal mobility of the ‘good urban agglomeration’ cities is greater than that of urban agglomerations. It is worth mentioning that some cities in the ‘good urban agglomeration’ also shifted towards ‘lightly polluted urban agglomerations’. The internal mobility of ‘superior urban agglomeration’ is far greater than that between urban agglomerations, and almost all cities remained in the same category. Overall, China’s PM2.5 pollution situation in winter improved slightly. Severe pollution still exists, and light pollution must be controlled to prevent further deterioration.
The overall transition probability of winter PM2.5 concentration levels in 2015–2018 as seen in is substantially different from that in , which is generally below the 45-degree diagonal. The contour map of the average PM2.5 transition probability in winter in 2015–2018 () lies on both sides of the 45-degree diagonal, and the area on the lower side is significantly larger than the area on the upper side. This result implies that the overall winter PM2.5 level in Chinese cities in 2015–2018 decreased, but its improvement is not as substantial as that observed in the annual average level (the right-hand side in ). Most of the low-end distribution (less than 40 μg/m3) lies above the 45-degree diagonal, indicating that the PM2.5 concentration level of cities in this area increased, while the middle part (40–100 μg/m3) mainly lies above the 45-degree diagonal and is parallel to it, indicating that the urban PM2.5 concentration level in the middle part of the distribution improved to some extent. However, the internal relative ranking remains unchanged, and the high-end distribution (greater than 100 μg/m3) is parallel to the x-axis, indicating a trend of club convergence in cities at this stage in 2015.
Figure 5. Three-dimensional diagram of the transition probability and the corresponding two-dimensional contour.
Source: Organized by the authors.
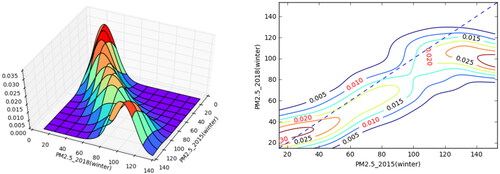
Overall, shows that the contour line of the average PM2.5 transition probability in winter periods mainly lies below the 45-degree line and presents an hour-hand shape in 2015–2018. Therefore, similar to the year situation, a trend of convergence is observed in winter, but the rate of convergence is slower than that of the average annual concentration.
3.2.3. Long-term PM2.5 distribution in Chinese cities in winter
The ergodic distribution in shows ‘unikurtosis’ and concentrated morphological characteristics. The observed kurtosis (100 μg/m3) is in the interval of relatively severe pollution, while the actual distribution peak of the average PM2.5 concentration in the winter of 2018 is approximately 40 μg/m3 and presents a non-evident bimodal state with a left high peak and a right low peak.
Figure 6. The ergodic distribution of PM2.5 in winter 2015–2018 and the actual distribution of PM2.5 in the winter of 2015.
Source: Organized by the authors.
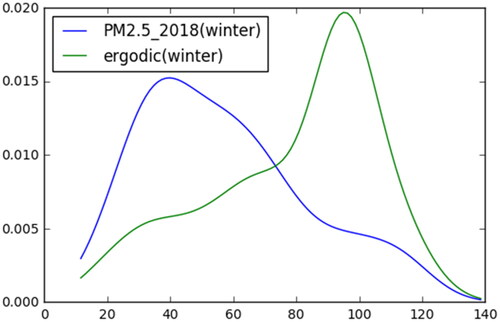
Overall, during 2015–2018, the average winter PM2.5 concentration in Chinese cities improved to some extent. However, the overall situation is still not optimal, especially in heavily polluted cities. During 2015–2018, the winter average PM2.5 concentration levels of Chinese cities showed a trend of convergence, slower than the annual average convergence rate of 2015–2019, and exhibited a state of ‘unikurtosis’. If the transition probability is constant over time, that is, the Chinese government cannot further formulate effective measures to improve China’s winter air pollution, the average winter PM2.5 level in most cities in China will exhibit kurtosis (100 μg/m3) in the long run.
3.3. Regional analysis of PM2.5 distribution in Chinese cities
This section analysed the regional characteristics of the PM2.5 distribution in Chinese cities and the transition probability matrix and its ergodic distribution in the three regions established by the State Planning Commission during the Seventh Five-Year Plan period ().
Figure 7. Three regions of China.
Note: Described in section 2.2.2.
shows the discrete probability transition matrix of the annual average PM2.5 for cities in eastern, central, and western China from 2015 to 2019. Overall, the cities in the three regions decreased their pollution levels. The internal mobility rate of the ‘good urban agglomeration’ in the central region is significantly greater than the proportion of transfers to the ‘superior urban agglomeration’.
Table 5. The transition probability matrix of annual PM2.5 of cities in eastern, central, and western regions from 2015 to 2019.
reports the discrete probability transition matrix of the average PM2.5 in winter in eastern, central, and western cities in China from 2015 to 2018. Compared with the overall improvement in the year, the winter improvement is marginal. In particular, the internal mobility of severely polluted cities in the eastern and central regions is greater than 0, which means that cities in these two regions are still heavily polluted. In addition, the ratio of ‘lightly polluted urban agglomeration’ to ‘good urban agglomerations’ is only approximately 50% in the three regions, and some cities in the central and western regions shifted towards the ‘heavily polluted urban agglomeration’. The results indicate that the government should strengthen pollution control measures in heavily polluted cities in the eastern and central regions. For cities in the central and western regions that shifted towards heavily polluted urban agglomerations, the reasons must be further investigated, and pollution management should be strengthened.
Table 6. The transition probability matrix of winter PM2.5 of cities in eastern, central, and western regions from 2015 to 2018.
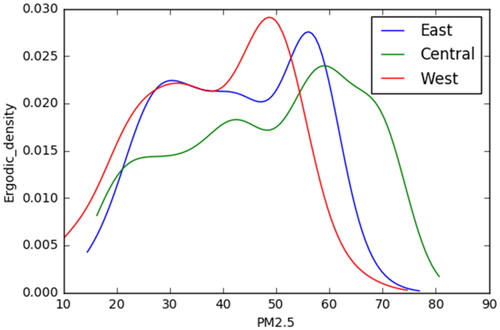
shows the annual average PM2.5 ergodic distribution of cities in eastern, western, and central China from 2015 to 2019. The ergodic distributions of the three regions present a multi-kurtosis pattern. The kurtosis on the right-hand side of the western cities is approximately 50 μg/m3, the kurtosis on the right-hand side of the eastern cities is approximately 55 μg/m3, and the right kurtosis of the central part is approximately 60 μg/m3. Compared with eastern and western cities, the annual PM2.5 level of cities in the central region improved less. In the long run, there will be a relatively large number of cities with annual average PM2.5 levels greater than 60 μg/m3 in these areas.
Figure 8. The annual average PM2.5 ergodic distribution of cities in three regions from 2015 to 2019.
Source: Organized by the authors.
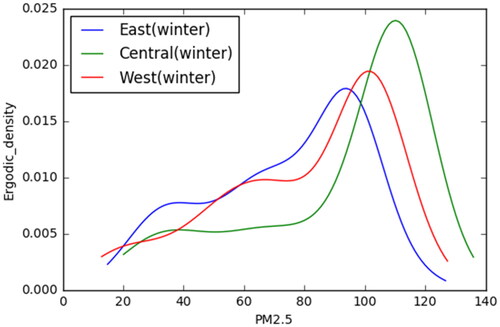
The winter conditions of the three regions generally exhibit very high ‘unikurtosis’ (). The kurtosis is approximately 90 μg/m3 in eastern cities, nearly 100 μg/m3 in western cities, and approximately 115 μg/m3 in central cities. In the long run, the winter PM2.5 pollution situation in the three regions is not expected to be optimal, especially in the central cities. Central cities show the smallest improvement both in annual and winter PM2.5 concentration terms. The Chinese government should strengthen the winter PM2.5 control in all regions, especially in the central region.
Figure 9. The ergodic distribution of winter PM2.5 of cities in three regions from 2015 to 2018.
Source: Organized by the authors.
4. Concluding remarks
This study investigated the convergence of PM2.5 concentration in Chinese cities after the implementation of the Ten Measures for the Atmospheric Country introduced in 2013. Kernel density was used to estimate the average PM2.5 concentration distribution changes during the 2015–2019 period and 2015–2018 winter seasons. Quah’s (Citation1997) method was employed to analyse the PM2.5 trend convergence and internal mobility of Chinese cities using discrete and continuous transition probabilities. Finally, using a continuous ergodic distribution, the distribution of the PM2.5 concentration in Chinese cities was analysed from a long-term perspective.
The results show that the annual average PM2.5 in Chinese cities improved significantly during the sample period, but pollution reduction in winter is marginal. The average PM2.5 concentrations in the 2015–2019 and 2015–2018 winter seasons show convergence, but the convergence speed in the 2015–2018 winter seasons is slow. In 2015–2019, the annual average PM2.5 of Chinese cities exhibits club convergence, while in the 2015–2018 winter seasons, no club convergence is observed. From a long-term perspective, if the transition probability does not change over time, the Chinese government cannot formulate effective measures to improve China’s winter air pollution. Then, the average value of PM2.5 in winter will be concentrated around kurtosis values (100 μg/m3) in most Chinese cities. The ergodic distribution of cities in central China is more left-biased than in the western and eastern areas. Whether it is an annual or a winter curve, the ergodic distribution of the three regions in winter approximately presents a ‘unikurtosis’ pattern and a relatively high level of pollution.
From the annual perspective, the Chinese government’s air pollution policy achieved great success, but the level of winter pollution in Chinese cities is still severe. The Chinese government should adopt continuous pollution control policies to accelerate the pollution reduction. The ergodic distribution of Chinese cities in winter should converge to sustainable pollution levels.
Future research should consider various other factors that influence convergence, which is a very important topic, but it rarely appears in the study of distribution dynamic.
Additional information
Funding
References
- Apergis, N., Payne, J. E., & Topcu, M. (2017). Some empirics on the convergence of carbon dioxide emissions intensity across US states. Energy Sources, Part B: Economics, Planning, and Policy, 12(9), 831–837. https://doi.org/10.1080/15567249.2017.1310956
- Blanco, F. A., Delgado, F. J., & Presno, M. J. (2020). R&D expenditure in the EU: Convergence or divergence? Economic Research-Ekonomska Istraživanja, 33(1), 1685–1710. https://doi.org/10.1080/1331677X.2020.1756371
- Cai, H. Y., Xu, Y. Z., & Sun, W. Y. (2017). Regional differences and convergence of haze pollution intensity distribution in China—The empirical analysis based on provincial panel data. Journal of Shanxi University of Finance and Economics, 39(03), 1–14. (In Chinese). https://doi.org/10.1136/adc.2010.186338.152
- Camarero, M., Picazo-Tadeo, A. J., & Tamarit, C. (2013). Are the determinants of CO2 emissions converging among OECD countries? Economics Letters, 118(1), 159–162. https://doi.org/10.1016/j.econlet.2012.10.009
- Criado, C. O., & Grether, J.-M. (2011). Convergence in per capita CO2 emissions: A robust distributional approach. Resource and Energy Economics, 33(3), 637–665. https://doi.org/10.1016/j.reseneeco.2011.01.003
- Duro, J. A. (2013). International mobility in carbon dioxide emissions. Energy Policy, 55, 208–216. https://doi.org/10.1016/j.enpol.2012.11.053
- Gil-Alana, L. A., Kare, M., & Claudio-Quiroga, G. (2020). Innovation and knowledge as drivers of the 'great decoupling' in China: Using long memory methods. Journal of Innovation & Knowledge, 5(4), 266–278. https://doi.org/10.1016/j.jik.2020.08.003
- Guo, S. G. (2007). Some methods of solving integral equations. Journal of Sichuan University of Science & Engineering, 20(05), 53–56. (In Chinese).
- Haller, A.-P., Butnaru, G. I., Hârșan, G.-D T., & Ştefănică, M. (2021). The relationship between tourism and economic growth in the eu-28. is there a tendency towards convergence? Economic Research-Ekonomska Istraživanja, 34(1), 1121–1145. https://doi.org/10.1080/1331677X.2020.1819852
- Huang, J., & Xia, C. L. (2014). Visualized analysis on dynamic distribution of urban output in China. Journal of Finance and Economics Theory, (06), 58–67. (In Chinese).
- Hyndman, R. J., Bashtannyk, D. M., & Grunwald, G. K. (1996). Estimating and visualizing conditional densities. Journal of Computational and Graphical Statistics, 5(4), 315–336. https://doi.org/10.2307/1390887
- Johnson, P. A. (2005). A continuous state space approach to ‘convergence by parts’. Economics Letters, 86(3), 317–321. https://doi.org/10.1016/j.econlet.2004.06.023
- Li, G. (2016). Estimation of China's environmental Kuznets curve based on PM2.5 index. Statistics and Decision, 23, 21–25. (In Chinese).
- Li, Y., Li, C., Liu, J., Meng, C., Xu, C., Liu, Z., Wang, Q., Liu, Y., Han, J., & Xu, D. (2021). An association between PM2.5 and pediatric respiratory outpatient visits in four Chinese cities. Chemosphere, 280(11), 130843. https://doi.org/10.1016/j.chemosphere.2021.130843
- List, J. A. (1999). Have air pollutant emissions converged among US regions? Evidence from unit root tests. Southern Economic Journal, 66(1), 144–155. https://doi.org/10.2307/1060840
- Liu, H., & Pei, Y. F. (2017). An empirical test of the environmental Kuznets curve of China’s haze pollution. Statistical Research, 34(3), 45–54. (In Chinese).
- Luo, N., Xu, M., & Wang, Y. (2019). Does air pollution affect enterprise innovation? Economic Review, 1, 20–32. (In Chinese).
- National Bureau of Statistics. (2020). China City Statistical Yearbook 2019. China Statistical Publishing House, Beijing.
- Nguyen-Van, P. (2005). Distribution dynamic of CO2 emissions. Environmental and Resource Economics, 32(4), 495–508. https://doi.org/10.1007/s10640-005-7687-6
- Quah, D. T. (1993). Galton's Fallacy and tests of the convergence hypothesis. The Scandinavian Journal of Economics, 95 (4), 427–443. https://doi.org/10.2307/3440905
- Quah, D. T. (1996a). Convergence empirics across economies with (some) capital mobility. Journal of Economic Growth, 1(1), 95–124. https://doi.org/10.1007/BF00163344
- Quah, D. T. (1996b). Empirics for economic growth and convergence. European Economic Review, 40(6), 1353–1375. https://doi.org/10.1016/0014-2921(95)00051-8
- Quah, D. T. (1996c). Twin peaks: Growth and convergence in models of distribution dynamic. The Economic Journal, 106(437), 1045–1055. https://doi.org/10.2307/2235377
- Quah, D. T. (1997). Empirics for growth and distribution: Stratification, polarization, and convergence clubs. Journal of Economic Growth, 2(1), 27–59. https://doi.org/10.1023/A:1009781613339
- Rahman, Z. U., Cai, H., Khattak, S. I., & Hasan, M. M. (2019). Energy production-income-carbon emissions nexus in the perspective of N.A.F.T.A. and B.R.I.C. nations: A dynamic panel data approach. Economic Research-Ekonomska Istraživanja, 32(1), 3384–3391. https://doi.org/10.1080/1331677X.2019.1660201
- Saunila, M. (2020). Innovation capability in SMES: A systematic review of the literature. Journal of Innovation & Knowledge, 5(4), 260–265. https://doi.org/10.1016/j.jik.2019.11.002
- Solow, R. M. (1956). A contribution to the theory of economic growth. The Quarterly Journal of Economics, 70(1), 65–94. https://doi.org/10.2307/1884513
- Strazicich, M. C., & List, J. A. (2003). Are CO2 emission levels converging among industrial countries? Environmental and Resource Economics, 24(3), 263–271. https://doi.org/10.1023/A:1022910701857
- van Donkelaar, A., Martin, R. V., Brauer, M., Hsu, N. C., Kahn, R. A., Levy, R. C., Lyapustin, A., Sayer, A. M., & Winker, D. M. (2016). Global estimates of fine particulate matter using a combined geophysical-statistical method with information from satellites, models, and monitors. Environmental Science & Technology, 50(7), 3762–3772. https://doi.org/10.1021/acs.est.5b05833
- Wang, P., Chen, K., Zhu, S., Wang, P., & Zhang, H. (2020). Severe air pollution events not avoided by reduced anthropogenic activities during COVID-19 outbreak. Resources, Conservation, and Recycling, 158, 104814. https://doi.org/10.1016/j.resconrec.2020.104814
- Wawrzyniak, D., & Doryń, W. (2020). Does the quality of institutions modify the economic growth-carbon dioxide emissions nexus? Evidence from a group of emerging and developing countries. Economic Research-Ekonomska Istraživanja, 33(1), 124–144. https://doi.org/10.1080/1331677X.2019.1708770
- Wu, J. X., & He, L. Y. (2017). The distribution dynamic of carbon dioxide emissions intensity across Chinese provinces: A weighted approach. Sustainability, 9(1), 101. https://doi.org/10.3390/su9010101
- Wu, J., Wu, Y., & Cheong, T. S. (2021). New evidence on the convergence and regional clusters in China: A weighted continuous distribution dynamic approach. Applied Economics, 53(8), 976–995. https://doi.org/10.1080/00036846.2020.1820443
- Wu, W. L., Xue, W. B., Wang, Y. L., Lei, Y., Feng, T., & Cai, Z. L. (2019). Health benefit evaluation for air pollution prevention and control action plan in China. Environmental Science, 40(7), 2961–2966. (In Chinese).
- Xu, G. (2010). The convergence in carbon dioxide emissions: Theoretical hypotheses and empirical research in China. The Journal of Quantitative & Technical Economics, 9, 31–42. (In Chinese). https://doi.org/10.13653/j.cnki.jqte.2010.09.006
- Xu, G. (2013). The club convergence of carbon intensity: Theoretical model and evidence in China–On the rationality and feasibility for the target of reducing carbon intensity. Management Review, 25(4), 48–58. (In Chinese). https://doi.org/10.14120/j.cnki.cn11-5057/f.2013.04.007
- Yang, S., Wang, F., & Liu, N. (2020). Assessment of the air pollution prevention and control action plan in China: A difference-in-difference analysis. China Population, Resources and Environment, 30(5), 110–117. (In Chinese).
- Yu, H., & Zhang, Q. X. (2015). A study on convergence of urban air pollution in China – An empirical analysis on sulfur dioxide (SO2). East China Economic Management, (08), 144–152. (In Chinese).
- Yutao, S. (2013). A study on the club convergence of the distribution of innovation across nations based on distribution dynamic. Management Review, 25(6), 59–66. (In Chinese). https://doi.org/10.14120/j.cnki.cn11-5057/f.2013.06.011
- Zeng, J. Y., Guijarro, M., & Carrilero-Castillo, A. (2020). A regression discontinuity evaluation of the policy effects of environmental regulations. Economic Research-Ekonomska Istraživanja, 33(1), 2993–3016. https://doi.org/10.1080/1331677X.2019.1699437