
 ?Mathematical formulae have been encoded as MathML and are displayed in this HTML version using MathJax in order to improve their display. Uncheck the box to turn MathJax off. This feature requires Javascript. Click on a formula to zoom.
Abstract
As an effective form of interaction between innovation subjects and resources, the regional innovation network’s optimal allocation of resources is the key to improving national innovation capacity. According to the innovation value chain, the process of resource allocation in innovation can be divided into two correlative sub-systems: the knowledge innovation stage (KIS) and the achievements commercialisation stage (ACS). To evaluate regional innovation efficiency, a two-stage network data envelopment analysis model with shared inputs is used, with fuzzy set qualitative comparative analysis to analyse the improvement path of resource allocation efficiency from the dimensions of regional environment and network structure. The results show that efficiency in the KIS is higher than in the ACS, and the efficiency scores for most regions in China are better under the model with shared inputs. The efficiency of innovative resource allocation is affected by the cross-action of seven factors: regional economic development, infrastructure, policy system, social culture, network scale, network openness, and network centrality. To achieve high-efficiency resource allocation, regions should build an innovation network that matches their environmental characteristics. These findings provide theoretical guidance for formulating innovative resource allocation policies suitable for different regions.
1. Introduction
With the transformation of the technological innovation model from closed to open, linear to network, innovation subjects such as enterprises, R&D institutions, and universities have begun to promote in-depth cooperation and coordinated development. These innovation subjects form a regional innovation network based on the sharing of innovation resources and activities. The optimal allocation of regional innovation resources plays a key role in improving national innovation capacity. Of particular concern is how to evaluate the effects of regional allocation and realise the optimal allocation of resources.
In considering how to realise the optimal allocation of innovation resources, scholars have focused on what perspective and which method to adopt. Relevant literature based on a macro perspective has mainly analysed the impact of national Science and Technology (S&T) planning or innovation policies on resource allocation (Klingebiel & Rammer, Citation2014; Zhou et al., Citation2002). Research from the micro perspective has paid particular attention to how companies, universities, and research institutions optimise their internal resources. In terms of method, the work can be divided into two categories: evaluation index system and mathematical model optimisation. For example, Qi and Guo (Citation2015) proposed an evaluation index system for the allocation of China’s S&T resource market, using the stochastic frontier analysis (SFA) method to analyse the optimisation of allocation in terms of technology transfer, collaborative innovation, and degree of market development. Yin et al. (Citation2020) constructed an efficiency evaluation system in terms of financial resource allocation and the benefits of innovation achievement. The research used the entropy-weight Technique for Order Preference by Similarity to an Ideal Solution (TOPSIS) method to analyse the characteristics of resource allocation efficiency in different regions, and it proposed an optimised path for the allocation of innovative resources.
Another approach is the mathematical model optimisation method. From innovative subjects, Wang and Wang (Citation2008) constructed a structural equation model (SEM) of the allocation system and proposed an optimal allocation model based on the national R&D programme to improve efficiency. Liu (Citation2011) used a two-dimensional decision model that integrates fuzzy data envelopment analysis and the analytic hierarchy process (AHP) to perform resource allocation optimisation tasks for R&D projects. Samimi et al. (Citation2016) proposed a new market model, combinatorial double auction resource allocation, which can be applied to resource allocation optimisation.
The resource allocation process of the regional innovation network is complex and changeable; it includes not only the breakthrough and accumulation of knowledge and technology but also the realisation of economic and market value. Thus, a single indicator often fails to measure its configuration accurately, and the allocation efficiency reflects its input–output level to some extent (Zhang, Citation2019). Resource allocation efficiency reflects the utility of the use of resources in the allocation process and is the ratio between various inputs and outputs. To improve the quality of economic growth and national competitiveness, innovation resource allocation efficiency has received high attention (Li & Chu, Citation2017). In recent years, scholars have divided innovation activities into sub-stages for efficiency analysis based on the innovation value chain (Cruz-Cázares et al., Citation2013; Jayanthi et al., Citation2009; Wang et al., Citation2016), which can effectively open the ‘black box’. However, most of these studies have used the general two-stage DEA model (Guan & Chen, Citation2010; Xiang & Chen, Citation2016; Xiao et al., Citation2012), in which the output of the first stage is evaluated as the entire input of the second stage. However, this model does not consider actual scenarios such as sub-stages, shared inputs, final production from the first stage, and new inputs in the second stage.
Recently, many scholars have begun to focus on the impact of the macro environment on the efficiency of regional innovation resource allocation. The S&T resource allocation efficiency index system constructed by Mei and Chen (Citation2015) contains dimensions such as the level of economic development, the degree of economic openness, financial support for science and technology, the level of energy consumption, the intensity of financial support for education, and the level of information technology. Wang et al. (Citation2016) focus on how internal and external resources of Chinese manufacturers interact to influence innovation capabilities, and the interactions between internal and external resources of firms show different patterns of influence on innovation capabilities. Barasa et al. (Citation2017) analysed the relationship between the impact of firm resources and the quality of regional institutions and hypothesised that the institutional environment in which firms operate mediates the impact of resources on innovation output. The results showed that the role of firm resources varies depending on the institutional environment and that regional institutions play a positive moderating role on firm resources.
The focus of this paper is the optimal allocation of regional innovation resources. Overall, this paper contributes to the existing literature in two important ways. First, the past studies lack a systematic quantitative evaluation export of the efficiency of regional innovative resource allocation. To address this research gap, we use an improved two-stage NDEA model to evaluate the efficiency of regional innovative resource allocation. Because of the high interdependence inherent within the structure of the regional innovation network, the main body of the network node cannot ignore the integrity and synergy when allocating innovation resources. This distinction, which our second contribution, proposing that the efficiency of regional innovation resource allocation is not affected by a particular characteristic element or simply superimposed; rather, it is the result of matching network structural elements and environmental elements in different regional environments.
In this paper, an improved two-stage NDEA model with resource sharing is developed and applied to the evaluation of the efficiency of regional innovative resource allocation. The improvement path of resource allocation efficiency is studied using the fuzzy set qualitative comparative analysis (fsQCA) method from the dimensions of regional environment and network structure. This combination of quantitative and qualitative methods generates new ideas for research on the path of optimal resource allocation.
2. Two-stage network DEA model with shared resources
When evaluating the efficiency of the decision-making units (DMUs), the general DEA model considers each one as a black box. The initial input is used to produce the final output through the black box without considering the intermediate products. Multiple studies have been conducted on DMUs with a two-stage structure, where intermediate products are the output of the first stage and the only input of the second stage (Färe et al., Citation2007; Kao & Hwang, Citation2008; Lewis & Sexton, Citation2004; Tone & Tsutsui, Citation2009). However, in many practical environments, part of the input to the first stage is shared by both stages. Moreover, the two-stage DEA models constructed in previous research are unsuitable, because they assume no output in the first sub-stage or no input in the second sub-stage.
Chen and Guan (Citation2012), however, have taken such a scenario into account, proposing a relational network two-stage DEA modelling framework that does not depend on pre-assigned weights for the efficiency scores for the two sub-stages. Drawing on their analytical framework, we have developed an improved two-stage network model (see ) that can evaluate scientific and technological innovation activities under a shared resources scenario, as described below.
Figure 1. A two-stage process with shared resource inputs.
Source: Adopted from Chen and Guan (Citation2012).
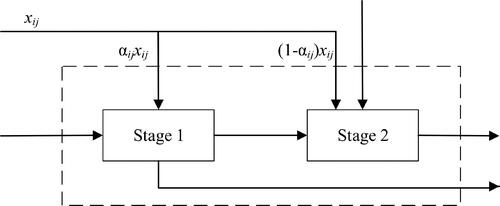
Parts of some resources are the only inputs to one stage, while others are shared as inputs in both stages. Note that each sub-stage owns its unique input.
There are intermediate products in the whole process, and a part of the intermediate products is withdrawn directly as the output of sub-stage 1, which can also be regarded as the output of the whole process. Another part of the intermediate product is used as the input resource of the second stage.
Suppose that there is a set of n DMUs denoted by DMUj (j = 1,2,…,n) and that each DMUj has m shared resources denoted by xij (i = 1,2,…,m). Assume that the proportion of xij in the first stage and second stage are αij and (1-αij), respectively. The first stage has m1 inputs denoted by xi1j(i = 1,2,…,m1) and shared input denoted by αijxij. Correspondingly, the inputs for the second stage are denoted by xi2j(i = 1,2,…,m2) and (1-αij)xij. Suppose also that the first stage has s1 outputs denoted by yr1j(r1=1,2,…,s1) and h intermediate outputs denoted by zdj(d = 1,2,…,h), which zdj then become inputs to the second stage and are referred to as intermediate measures. The outputs from the second stage are denoted by yr2j(r2=1,2,…,s2).
Based upon the variable returns to scale (VRS) model of Banker et al. (Citation1984), the fractional efficiency scores for DMUk in the first and second stages are calculated respectively by
(1)
(1)
and
(2)
(2)
Where
is the weight vector of inputs xij, xi1j, and xi2j, and
is the weight vector of outputs yr1j, yr2j, respectively.
and
represent the weight vectors of the shared resources xij allocated to sub-processes. Since zdj dual role as input and output, using
and
to represent the weight vector of output from stage 1 and input in stage 2, respectively.
According to Chen and Guan (Citation2012) research to regard the overall efficiency is the weighted average of efficiency scores of the two sub-stages. The additive model is used for efficiency analysis. The overall efficiency of DMUk is as follows
(3)
(3)
Where and
are user-specified weights that the ratio of input resources in each sub-stage to overall resources of the DMUk, represented by
(4)
(4)
(5)
(5)
By letting
and
The overall efficiency of the two-stage process with shared resource for DMUk can be evaluated by solving the fractional planning model (6)
(6)
(6)
Assume that the optimal solution of the model (6) is thus the overall efficiency and sub-stages efficiency for DMUk can be calculated as
(7)
(7)
(8)
(8)
(9)
(9)
Once we obtain an optimal solution to model (7)–(9), the efficiency scores of both individual stages can be calculated accordingly. However, since model (6) can have alternative optimal solutions, the decomposition of the overall efficiency defined in model (7) may not be unique. Therefore, we follow Kao and Hwang (Citation2008) approach to find a set of multipliers that produce the highest first or second stage efficiency score while maintaining the overall efficiency score of the entire process. Under the VRS assumption, the sub-stages efficiency can be obtained by
(10)
(10)
and
(11)
(11)
3. Empirical analysis
3.1. Evaluating the allocation of regional innovative resources with shared inputs
3.1.1. Indicator system
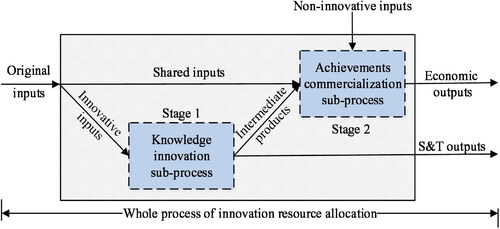
Based on the innovation value chain and considering the shared inputs (Broekel, Citation2015; Guan & Chen, Citation2012), the process of regional innovative resource allocation was divided into two sub-processes: the knowledge innovation sub-process (KIS) and the achievements commercialisation sub-process (ACS) (see ).
Figure 2. Two-stage process with shared inputs of regional innovative resource allocation.
Source: Author’s own drawing.
The efficiency of regional innovation resource allocation can be regarded as the output–input ratio of regional innovative resources. Adhering to the principles of systematicness, scientificity, and accessibility, we built a two-stage efficiency measurement index system that considers shared resources. The evaluation index system incorporates human, financial, material, and other innovation elements (Kogan et al., Citation2017; Tan, Citation2004; Wang et al., Citation2016). The input–output choices were as described in the following sub-sections.
3.1.1.1. Original inputs in the knowledge innovation Sub-process (stage 1 KIS)
R&D talents are an important part of regional human resources in innovation. R&D labour input plays a decisive role in improving the efficiency of the regional innovation network’s resource allocation. We therefore selected the full-time equivalent of R&D personnel to represent human resources (IHR).
Financial investment (capital investment) has a direct impact on the allocation of regional innovation resources. Generally speaking, the more financial resources are invested, the more regional innovation activities will be carried out, which is conducive to enhancing efficiency. Intramural expenditure on R&D was therefore chosen as a proxy variable for financial resources (IFR).
Regional innovative material resources include land and workshops, production equipment, and R&D equipment (Fu et al., Citation2020). Considering the availability of data, fixed assets (in scientific research and technical services) were selected to represent material resources (IMR).
3.1.1.2. Original inputs in the achievement commercialisation Sub-process (stage 2 ACS)
The new inputs in the ACS mainly included human resources (NHR) and financial resources (NFR) consumed during this stage. The non-R&D personnel was represented by subtracting the number of personnel in R&D from the annual average number of employees, and financial resources were represented by expenditure on new product development. It is worth noting that previous studies (Furman et al., Citation2002; Guan & Chen, Citation2012) ignored the original input of the KIS, thereby neglecting indispensable factors in Stage 2 economic activities. On this basis, we selected material resources as the shared input of the KIS and the ACS; that is, the KIS and the ACS share the input of fixed assets (in scientific research and technical services).
Patents have so far emerged as the most appropriate indicator measuring regional innovation achievements (Guan & Chen, Citation2012). Compared with the pieces of patent applications and grants, the number of inventions in force owned by the region can better reflect the innovation ability (Bai & Bian, Citation2016). It is an effective indicator to measure the innovation output visible in a part of KIS, of course, it will then be used as an input to ACS.
3.1.1.3. Intermediate products connecting the KIS and the ACS
Patents have emerged as the most appropriate indicator of regional innovation achievements (Guan & Chen, Citation2012). Compared with patent applications and grants, the number of inventions in force owned by a region better reflects its innovation ability (Bai & Bian, Citation2016). Because it is an effective indicator for measuring the innovation output visible in a part of the KIS, it was used here as an input to the ACS.
3.1.1.4. Final outputs from the KIS
The S&T outputs of knowledge and technology constitute the main output in the KIS. The number of scientific papers is an effective indicator of the quality of a regional innovation subject and the output of new knowledge. The transaction value of the technology market reflects the scale of technology research and development, technology transfer, technology consulting, and technology service transactions in a region, and effectively reflects the market value of technology. Thus, for the expected outputs of the KIS, we selected the scientific papers issued by higher education and R&D institutions, and the value of contract exportation form domestic technical markets.
3.1.1.5. Final outputs from the ACS
The final output of the commercialisation stage is the economic benefits of new products. Compared to other measures, new product sales revenue can more fully reflect the commercial value of innovations. Thus, we selected the sales revenue from new products (RNP) as the economic output indicator.
To eliminate the impact of price changes on our analysis, we dealt with the variables related to prices as follows (Goto & Suzuki, Citation1989; Griliches, Citation1980; Zhu & Xu, Citation2003). The perpetual inventory method provided a stock estimate of internal expenditure on R&D and new product development after price deflating (taking the baseline year as 2010 and the depreciation rate as 15%). New product sales revenue was processed with the producer price index for industrial products, and the price index for investment in fixed assets was used to process innovation material resources.
As innovative resource allocation is a continuous process, time-lag effects needed to be considered. Many studies have discussed the lag effect of innovation input on S&T outputs (intermediate outputs) or economic outputs (final outputs). Drawing on the whole process of innovative resource allocation and the existing literature (Bai & Bian, Citation2016), we set the R&D input to the economic output as a two-year lag period; that is, the KIS and the ACS both have a one-year lag. If the original inputs in the KIS are the t-period, then the intermediate products are the t + 1 period. Thus, the original inputs in the ACS are period t + 1, and the final outputs from the KIS are period t + 2.
3.1.2. Data sources and descriptive statistics
In line with availability, this study used data from 30 provinces in China from 2010 to 2018. Taking the two-year lag effect into account, the complete analysis period runs from 2010 to 2016. The relevant data came from China’s economic and social development statistics database (https://data.cnki.net/). Descriptive statistics were performed on the characteristics of the data samples, and the results are shown in .
Table 1. Descriptive analysis of evaluation indexes.
The mean values of the indicators of innovative human resources, innovative financial resources, and innovative material resources are 112,170 × 104, 4,159,641 × 104, and 1,092,424 × 104, respectively. Comparing the maximum and minimum values, the results show that the sample characteristics are close to non-normal distribution. Judging from the standard deviation of the sample data, each variable is relatively scattered.
3.1.3. Efficiency comparison
In accordance with the indicator system constructed, we used the two-stage network DEA model with shared inputs to measure the efficiency of China’s regional innovation resource allocation. We then compared the results with the general network DEA model. reports overall efficiency and sub-process efficiency under shared input scenarios and in the general two-stage NDEA model, respectively.
Table 2. Efficiency scores of innovation resource allocation.
From the results in , we note that the overall efficiency scores of most provinces under shared input are higher than in the general two-stage NDEA model. The rank of some provinces changed greatly; for instance, Shaanxi rose from 29th (= 0.4413) to 19th (
= 0.5937), Sichuan rose from 17th (
= 0.5716) to 8th (E = 0.7387), and Liaoning rose from 28th (
= 0.4582) to 22nd (E = 0.5677). The overall efficiency of these provinces improved significantly after considering the shared resources in the KIS. In contrast, Shanxi dropped from 12th (
= 0.6292) to 25th (E = 0.5238), Heilongjiang dropped from 20th (
= 0.5382) to 29th (E = 0.4611), and Ningxia dropped from 19th to 24th. This indicates that the resource inputs in the KIS of these provinces are redundant, leading to a decrease in overall efficiency.
On the whole, the efficiency of Beijing is good in each of the two models. Other regions close to the efficient frontier are Shanghai, Zhejiang, Jiangsu, Guangdong, and Hunan, which indicates that these regions have high resource utilisation rates and favourable resource allocation. The regions in the lower quartile of efficiency (the lower quartile limit value is 0.5646) are eastern China (Hainan Province), central China (Shanxi, Jilin, and Heilongjiang), and western China (Inner Mongolia, Gansu, Ningxia, and Xinjiang). When the results in are combined, the efficiency scores of the regions in central and western China are lower than those in eastern China.
Given these findings, the curve of efficiency from 2010 to 2016 was plotted to investigate the variation, as shown in .
Figure 3. Trends in the overall and sub-stages efficiency of regional innovation resources.
Source: Author’s own drawing.
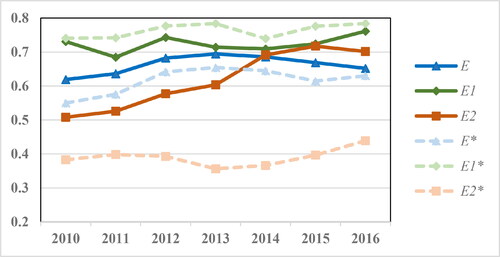
The overall efficiency value shows a fluctuating upward trend, but the rate of improvement is relatively slow. As for sub-phases, the efficiency value of the ACS rose from 2013 to 2016, indicating that some improvements have been achieved in recent years in the commercial transformation of regional innovation results. However, the efficiency of the KIS is significantly higher than that of the ACS, which shows that there is still ample room for better allocation and improvement in the business transformation process compared with the knowledge innovation process. Comparison of the models shows that the efficiency score of the KIS with shared inputs is lower than the estimated value in the general two-stage model, whereas the efficiency performance of the ACS is higher than the estimated result in the general model.
3.2. Optimal path of innovation resource allocation
3.2.1. Selection and calibration of variables
In the regional innovation network, although many factors are not input variables, they can significantly affect innovation output, thereby impacting the effect of resource allocation. Determining which factors lead to differences in the efficiency of innovation resource allocation in different regions will help governors to open the black box and achieve optimal allocation.
As an organic whole, the regional innovation network is situated in a certain environment. Therefore, in addition to the structure of the innovation network itself, the regional environment has an important influence on its development (Schilling & Phelps, Citation2007). However, few studies have examined the effect of environmental characteristics on the efficiency of regional innovation activities from a general environmental perspective. Therefore, this paper analyses the optimised path of regional innovation resource allocation by considering shared input from the dimensions of regional environment and network structure.
3.2.1.1. Network structure dimension
The larger the network scale, the more resource acquisition channels, and the easier it is to optimise resource allocation. However, this relationship is not absolute. The effectiveness of the network will take the form of an inverted U shape as the network scale changes (Ngamassi et al., 2014). Universities, scientific research institutions, and enterprises are the important network subjects engaged in technological innovation and resource interaction (Yu et al., Citation2013). Therefore, the numbers of higher education institutions, R&D institutions, and industrial enterprises above a designated size were taken as indicators of network scale (NS).
Network openness (NO) reflects the willingness of local governments and local network members to develop in foreign economies and their ability to attract and digest foreign resources (Li, Citation2014). Accordingly, the value of imports and exports, the value of technology imported contracts, and the amount of foreign capital utilised were taken as measures of NO.
Network centrality (NC) emphasises the status and importance of a certain network ‘star’. In China, a small number of state-owned or large enterprises, as well as some universities and scientific research institutions, have abundant high-quality scientific and technological resources or resource acquisition channels, which often act as the star in the innovation network (Ren et al., Citation2011). However, the distribution of resources is uneven, not only among individual network members but also in the local distribution of the network. For example, the distribution of innovation resources in large and medium-sized cities or provincial capitals often accounts for a large proportion of their provinces (Shao et al., Citation2018). The proportion of key universities to ordinary universities, the proportion of large and medium-sized industrial enterprises to industrial enterprises above a designated size, and the proportion of provincial capital city GDP to the province’s GDP were selected as measures of NC.
3.2.1.2. Regional innovation milieu
Based on previous research, the following indicators were selected from the two aspects of hard and soft environment: the economic development environment (ED), the basic establishment environment (BE), the systems and policies environment (SP), and the social-cultural environment (SC).
A good economic development environment can provide excellent financial support for regional innovation, and it is an important factor in the geographical selection of innovation subjects (Bai & Bian, Citation2016). Regions with superior economies have strong innovation ability and more rational allocation of resources (Zhao & Wang, Citation2017). Given that per capita GDP can objectively eliminate differences in regional population and allocation, it was used here to characterise ED.
The basic establishment environment refers to infrastructure with public welfare attributes that support scientific research, technology development, and product development, such as large-scale facilities, S&T infrastructure, and industrial technology innovation infrastructure. In line with the availability of data, this paper took the number of large national research infrastructures and the number of key state laboratories in each region to represent BE.
The government’s application of policy tools such as R&D subsidies and tax preferences can effectively promote cooperation among innovation subjects to optimise the effect of resource allocation (McElwee & Atherton, Citation2005). Accordingly, this paper used the regional S&T financial expenditure index to reflect SP (Zhang et al., Citation2018).
A network of effective resource allocation often exists in a regional environment with a high cultural level and strong innovation ability (Bai & Bian, Citation2016). Thus, the provincial innovation index and the number of ordinary universities in each region were taken as measures of higher education level and innovation ability to capture SC.
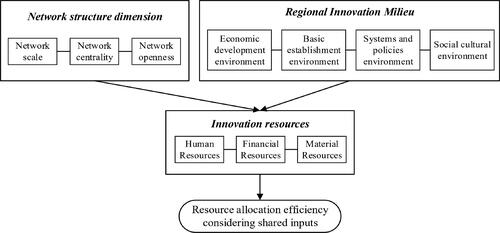
The above data were all taken from China’s economic and social development statistics database, new infrastructure research report, and urban and industrial innovation report. Following the time proximity principle and to optimise the path of efficiency improvement in the near future, we focused on factors that influenced the allocation efficiency of innovation resources in different regions in 2016. Thus, the resource allocation efficiency scores (E2016) considering shared inputs in 2016 were used as the outcome variable. The network structure and regional innovation milieu were used as condition variables. The effect of the condition variables on the outcome variable is shown in .
Figure 4. Influencing mechanism of regional innovation resource allocation efficiency.
Source: Author’s own drawing.
The fsQCA method was used to explore how various regional innovation networks realised the interaction between factors under specific environmental conditions, and to find multiple equivalent paths for high-efficiency resource allocation. According to the synergy principle, the innovation network is characterised by its aggregation and cooperativity. Because there is a certain interdependence between its characteristic factors, ignoring the interaction causes deviations in the results of the analysis (Tao et al., Citation2016). Therefore, instead of being linearly affected by a particular factor, the efficiency of regional innovation resource allocation is the result of the joint action of various factors. In this context, the application of the fsQCA method has certain advantages.
When using fuzzy sets to calculate data, partial condition variables need to be integrated internally. Of these, the NS, NC, and NO variables included three indicators, while the BE and SC variables included two indicators. The values of Cronbach’s alpha for these five indicators were 0.7634, 0.8641, 0.7985, 0.7063, and 0.7912, respectively, which is higher than the critical value 0.7 and shows satisfactory consistency.
When calibrating condition variables to the fuzzy membership scores, three qualitative breakpoints need to be set: full membership, full non-membership, and the cross-over point (Fiss, Citation2011). These three benchmarks can be selected as the top decile, lowest decile, and median of the sample data, respectively. Using this method, the variables were calibrated for fuzzy value, with the breakpoints shown in .
Table 3. Qualitative breakpoints for variables fuzzy calibration.
3.2.2. Necessary tested and truth table analysis
When performing qualitative comparative analysis, the necessary conditions need to be eliminated (Fiss, Citation2011). In order to determine whether there were necessary conditions for the efficient allocation of innovative resources among the seven condition variables in this study, we first tested the necessity of the high-efficiency scores (that is, the necessity of the condition sets after calibrating the fuzzy sets). If the consistency score is greater than 0.9, this indicates that the causal condition is a superset of the high-efficiency outcome; as this violates the sufficiency principle of path research, the condition should be eliminated (Fiss, Citation2011; Schneider & Wagemann, Citation2012).
shows the necessity analysis results, positive and negative, for the seven conditions. The consistency scores of all the condition variables were less than 0.9, indicating that efficient allocation of regional innovation resources is a combination of multiple factors. A single factor does not have strong explanatory power for the score of allocation efficiency, which shows that the pathway analysis of multi-factor interaction is feasible.
Table 4. Necessity analysis of conditional variables.
The truth table algorithm incorporates a two-stage analytic procedure (Rihoux & Ragin, Citation2009). The first step creates a truth table from the fuzzy data, which includes specifying the outcome for each configuration and determining which configurations to include in the analysis. The second step specifies which causal conditions and outcomes to minimise. Through the truth table algorithm, all paths of causal conditions can be obtained (reflecting all possible combinations of causal conditions: the 1 s and 0 s indicate the different corners of the vector space defined by the fuzzy set causal conditions).
As this study involved seven condition variables, the truth table included 27 (128) potential paths. Each region was assigned to these 128 paths as a sample case. Because the total number of cases (N) was relatively small, the frequency threshold was set to 1, and the consistency threshold was set to 0.8 (Ragin, Citation2006). The Truth Table Analysis module in fsQCA 3.0 was then used to obtain different paths for the efficient allocation of innovative resources in China, as shown in . The eighth column indicates the case number in , the ninth column gives the coding of the regions (1 for a high-efficiency region, and 0 for an inefficient region), and the tenth column indicates the consistent subset of membership in the outcome.
Table 5. Truth table of efficient path for regional innovation resource allocation.
As shown in , there were nine high-efficiency paths, which means that the remaining 119 paths were remainders and cannot be supported by actual cases. FsQCA minimises the causal condition of the path through Boolean algebra to obtain the complex solution. For paths without samples, fsQCA uses counterfactual analysis to simplify the filtered paths, obtaining an intermediate solution and a parsimonious solution. The parsimonious solution is the core element that has a high degree of causality with the outcome variable (Ragin, Citation2008). Thus, through a combination of the parsimonious and intermediate solutions, it is possible to determine which condition variables are the core elements of the outcome and which are its auxiliary elements.
3.2.3. Path analysis for efficient allocation
In Section 3.2.2, three solutions were derived: complex, parsimonious, and intermediate. The complex solution yields many paths, and the explanation is not representative. The parsimonious solution incorporates all counterfactual analysis, which may make it unsuitable for explaining real-life problems. The solution that lies between the two extremes is the intermediate solution. An important advantage of the intermediate solution is that it does not allow the elimination of necessary conditions, instead taking any superset of the result and meaningful conditions as necessary conditions (Rihoux & Ragin, Citation2009). In general, the intermediate solution is superior to the complex and parsimonious solutions (Fiss, Citation2011). presents the intermediate solution and parsimonious solution for the efficient allocation of regional innovation resources.
Table 6. Parsimonious and intermediate for efficient allocation of regional innovation resources.
As shows, the consistency of the intermediate solution was 0.833203 (greater than the threshold value of 0.75), and its coverage was 0.673844 (i.e. the paths are likely to account for 67% of the efficient allocation of innovative resources). The parsimonious solution had two paths; its consistency was 0.772995 (greater than the threshold value of 0.75), and its coverage was 0.830272, which can be interpreted as high.
Under the complex effect of the seven condition variables in the network internal structure and the external innovation environment, two valid parsimonious solutions constitute two main paths with high resource allocation efficiency: (1) the strategy of low network scale in regions with high network openness, namely type Ha, and (2) the strategy of high network scale in the region of high cultural level and high innovation ability, namely type Hb. The parsimonious and intermediate solutions were sorted to form the path set shown in , which reflects the efficient allocation of ‘All roads lead to Rome’. Referring to the recommendations of Fiss (Citation2011), is used to indicates that the condition does not occur, ● is used to indicates that the condition occurs, where ● represents the core condition (each combination in parsimonious solutions) and ● represents auxiliary condition (the non- parsimonious part of intermediate), blank indicates that the condition does not affect to outcome.
Table 7. Efficient allocation path of regional innovation resources.
From and , there were 6 paths for the efficient allocation of innovative resources. Observing the coverage scores, it is found that the coverage of path Hb2 is the highest (RC = 0.423686). Based on this, the third path can be judged to be the most important. The analysis of each separate path to the outcome is given below.
As and show, there were six paths for the efficient allocation of innovative resources. Path Hb2 had the highest coverage score (RC = 0.423686). Based on this, the third path, Hb3, can be judged to be the most important. The analysis of each separate path to the outcome is given below.
Path Ha1 (∼NS*NO*NC*ED*BE*SP) shows that when a region has a high level of GDP per capita, a sound innovation infrastructure, and strong local policy support, efficient allocation of innovative resources can be achieved. Due to the superior economic basis, innovation capability, and infrastructure conditions in such regions, some powerful members in the innovation network allocate resources uniformly, with the result that the centrality of this type of network is generally high. Further, the willingness of local governments and local network members to develop in foreign economies and their ability to absorb foreign capital is also strong. The areas representative of the Ha1 path are Tianjin (0.68,0.35) and Shanghai (0.63,1).
Path Ha2 (∼NS*NO*ED*∼BE*SP*∼SC) indicates that the level of economic development is good, but that the regional innovation infrastructure is weak, the number of institutions of higher learning is small, and the innovation capacity is poor. To achieve higher resource allocation efficiency in these areas, local governments need to formulate compelling innovation policies. By building resource-sharing platforms, the internal connections of the innovation network can be strengthened. Although regional innovation networks are not big in scale, their openness and centrality are relatively high. Core organisations need to take the lead in the network to help innovation subjects obtain funds, conduct R&D activities, and expand sales channels. The areas that represent the Ha2 path are Chongqing (0.76,0.93) and Jilin (0.51,0.21).
Path Hb1 (NS*NO*NC*BE*SP*SC) indicates that the regional innovation infrastructure is comprehensive and that there is a good social environment for innovation. With strong policy support from local government, the level of economic development is no longer a necessary condition for improving innovation ability and resource allocation efficiency. When such regions have efficient allocation, they tend to have large networks of their own (i.e. many innovation nodes in the network, such as universities, research institutions, and enterprises), and regional network centrality and openness are high. The regions representative of the Hb1 path are Guangdong (0.85,0.95), Beijing (0.84,1.00), and Sichuan (0.56,0.95).
The raw coverage for path Hb2 (NS*NO*ED*BE*SP*SC) is 0.4236, which means that this solution term contains 42.36% of the cases in the results and has the strongest explanatory power for the path of efficient allocation. In this type of path, the regional innovation environment is in a nationally advantageous position; that is, it has the best economic development, a comprehensive innovation infrastructure, high innovation ability, and a considerable number of universities. The strong support of local government for innovation policies is also conducive to attracting greater investment and encouraging S&T talents to join the innovation network, which means that the network scale is generally relatively large. In the context of macroeconomics and politics, the network has a high degree of openness and strong resource mobility, and there is no need to maintain intensive relationships among network members to help them obtain resources. Therefore, under this external environment and these network characteristics, regions have higher allocation efficiency. The regions representative of the Hb2 path are Jiangsu (0.98,0.9), Guangdong (0.87,0.95), Zhejiang (0.86,1), Beijing (0.84,1), Shandong (0.79,0.24), Hubei (0.58,0.81), and Fujian (0.53,0.41).
Path Hb3 (NS*∼NO*∼NC*∼ED*∼BE*SP*SC) indicates that regions with low GDP and an imperfect innovation infrastructure but a relatively good innovation culture (that is, a large number of institutions of higher learning and training for high-level S&T talents) can also achieve efficient resource allocation. If the government gives support and reinforcement to innovation-related policies, for example by publicising public tax breaks for high-tech enterprises, it will reduce the cost of enterprise innovation. Innovative individuals in this type of regional innovation network should increase communication with each other to achieve rapid circulation and sharing of resources. With enhanced government guidance and good individual communication, the local innovation network can achieve high-efficiency resource allocation. The region representative of the Hb3 path is Hebei (0.51,0.74).
Path Hb4 (NS*∼NO*∼NC*ED*BE*∼SP*SC) describes a region where the level of economic development is good, the innovation infrastructure is comprehensive, and the social and cultural environment matches the innovation development. If local government support for innovative tax incentives or R&D subsidies is inadequate, the requirements for the regional innovation network are that the scale of the network should be large, and that more universities, scientific research institutions, and enterprises need to join the network. Innovative subjects in this kind of network can achieve the effects of high resource allocation without high network openness. The representative region for this path is Liaoning (0.6,0.83).
4. Discussion
The path analysis showed that the intersection of network structure elements and regional environment elements yields six combined paths, each of which embodies an independent combination of realized outcomes and reasonably interprets the paths and ways to reach the outcome variables, thus once again demonstrating the superiority of the QCA method, which takes into account the cross-combination effects of multiple condition variables while effectively avoiding the endogeneity problem common to regression analysis.
Considering the path results discussed in Section 3.2.3, the following three points can be clarified. First, the systems and policies environment is an important condition for realising efficient allocation of regional innovation resources, in agreement with results from Zhang et al. (Citation2018). To some extent, this reflects the importance of local government support for innovation. Of the six efficiently allocated paths discussed above, five confirm that the condition occurs. From the results of the necessity analysis, the consistency of this condition (CI = 0.770167) is the highest among all the indicators, which shows that its importance is reflected in the scores. Government application of policy tools such as R&D subsidies and tax incentives can effectively promote collaboration and cooperation between innovative entities, thereby optimising the effect of resource allocation.
Second, network size is not a necessary condition for maintaining efficient resource allocation in all regions. The findings from Ngamassi et al. (Citation2014) seem consistent with our study, they pointed out that the effectiveness of the network will take the form of an inverted U shape as the network scale changes. The analysis of the Ha path shows that a larger network scale does not necessarily lead to more effective resource allocation. The scale of the network can have different effects on behaviour. Appropriate expansion of the network scale will help to reduce transaction costs and secure more innovative resources. However, excessive redundant connections may also cause individuals to invest too many resources while neglecting one another. This will increase the burden of coordination among members, which is not conducive to the development of the entire regional innovation network and can have a negative impact on resource allocation.
Third, although the regional innovation milieu provides important support for improvements in efficiency, not all environmental elements are at a sufficiently high level to achieve efficient allocation of regional innovation resources. As noted by Zhang (Citation2019), not all environmental factors are at a high level to achieve efficient allocation. When the economic development, infrastructure, and social and cultural environment of a region are below average, local government should enact strong policies to create a highly supportive environment for innovation and to make it more convenient to introduce capital, talents, material resources, technology, and other important innovation resources. In this context, a region can also achieve efficient allocation of innovative resources by strengthening cooperation between nodes.
5. Conclusions and policy implications
This study has combined quantitative and qualitative approaches to shed light on the optimal allocation path of regional innovation resources considering shared inputs from the perspective of efficiency improvement. First, an improved network DEA model was built to measure the efficiency of China’s regional innovation resource allocation from 2010 to 2016, overall and in sub-stages, and the efficiency differences of shared input were compared. Social network analysis was then used to explore the spatial relationship of regional innovation resource allocation in two stages. Finally, the condition variables of promoting regional innovation resource allocation to achieve high efficiency were explored, and the cross-action of high-efficiency factors verified through comparative analysis of case paths based on QCA. The policy implications and conclusions of the findings are as follows.
Most regions in China scored higher for efficiency of innovation resource allocation under shared inputs. During the study period, the overall efficiency of China’s regional innovation resource allocation was at a medium-to-high level, leaving considerable room for improvement. This emphasises the existence of problems such as redundancy or waste of resource inputs, low conversion of high inputs, and low output. The efficiency of the ACS has increased, but it remains at a lower level than the KIS, which sets a constraint on overall efficiency and needs to be improved. Regions should integrate existing innovation resources scientifically, link up the industrial chain, devote resources to the transformation and promotion of innovation achievements, and adopt measures to eliminate gaps in the commercialisation of achievements.
The spatial correlation network in the ACS was more complicated than in the KIS. The efficiency of the allocation of innovative resources in various regions not only affects neighbouring provinces but also transcends geographical restrictions to have a spatial relationship with non-neighbouring provinces. Given the spatial relationship of China’s regional innovation resource allocation, this correlation should be used as a reference for formulating more adaptable innovation and development policies in different regions. At the same time, all regions should seek to strengthen spatial relations in the ACS, actively cooperating with other regions to strengthen collaborative innovation and resource sharing.
Improvement path analysis shows that the efficiency of regional innovation resource allocation is affected by cross-actions of network scale, network openness, network centrality, regional economic development, basic establishment, policy systems, and the socio-cultural environment. To achieve efficient allocation of innovation resources, each region should therefore build an innovation network that matches its own environmental characteristics. Local governments should actively create a policy and institutional environment that is conducive to innovation, promoting the free flow of regional innovation resource elements.
Disclosure statement
No potential conflict of interest was reported by the authors.
Additional information
Funding
References
- Bai, J., & Bian, Y. (2016). Factor market distortion and the efficiency losses of Chinese innovative production. China Industrial Economics, 1(11), 39–55. https://doi.org/10.19581/j.cnki.ciejournal.2016.11.005
- Banker, R. D., Charnes, A., & Cooper, W. W. (1984). Some models for estimating technical and scale inefficiencies in data envelopment analysis. Management Science, 30(9), 1078–1092. https://doi.org/10.1287/mnsc.30.9.1078
- Barasa, L., Knoben, J., Vermeulen, P., Kimuyu, P., & Kinyanjui, B. (2017). Institutions, resources and innovation in East Africa: A firm level approach. Research Policy, 46(1), 280–291. https://doi.org/10.1016/j.respol.2016.11.008
- Broekel, T. (2015). Do cooperative research and development subsidies stimulate regional innovation efficiency? Evidence from Germany. Regional Studies, 49(7), 1087–1110. https://doi.org/10.1080/00343404.2013.812781
- Chen, K., & Guan, J. (2012). Measuring the efficiency of China’s regional innovation systems: Application of network data envelopment analysis (DEA). Regional Studies, 46(3), 355–377. https://doi.org/10.1080/00343404.2010.497479
- Cruz-Cázares, C., Bayona-Sáez, C., & García-Marco, T. (2013). You can’t manage right what you can’t measure well: Technological innovation efficiency. Research Policy, 42(6–7), 1239–1250. https://doi.org/10.1016/j.respol.2013.03.012
- Färe, R., Grosskopf, S., & Pasurka, C. A. (2007). Environmental production functions and environmental directional distance functions. Energy, 32(7), 1055–1066. https://doi.org/10.1016/j.energy.2006.09.005
- Fiss, P. C. (2011). Building better causal theories: A fuzzy set approach to typologies in organization research. Academy of Management Journal, 54(2), 393–420. https://doi.org/10.5465/amj.2011.60263120
- Fu, L. N., Peng, J. C., & Yi, M. (2020). A study on regional innovation resource allocation efficiency based on meta-frontier production function. Macroeconomics, 1(4), 85–102. https://doi.org/10.16304/j.cnki.11-3952/f.2020.04.009
- Furman, J. L., Porter, M. E., & Stern, S. (2002). The determinants of national innovative capacity. Research Policy, 31(6), 899–933. https://doi.org/10.1016/S0048-7333(01)00152-4
- Goto, A., & Suzuki, K. (1989). R&D capital, rate of return on R&D investment and spillover of R&D in Japanese manufacturing industries. The Review of Economics and Statistics, 71(4), 555–564. https://doi.org/10.2307/1928096
- Griliches, Z. (1980). R&D and the productivity slowdown. The American Economic Review, 70(2), 343–348. https://doi.org/10.2307/1815495
- Guan, J., & Chen, K. (2010). Measuring the innovation production process: A cross-region empirical study of China’s high-tech innovations. Technovation, 30(5–6), 348–358. https://doi.org/10.1016/j.technovation.2010.02.001
- Guan, J., & Chen, K. (2012). Modeling the relative efficiency of national innovation systems. Research Policy, 41(1), 102–115. https://doi.org/10.1016/j.respol.2011.07.001
- Jayanthi, S., Witt, E. C., & Singh, V. (2009). Evaluation of potential of innovations: A DEA-based application to U.S. photovoltaic industry. IEEE Transactions on Engineering Management, 56(3), 478–493. https://doi.org/10.1109/TEM.2009.2013833
- Kao, C., & Hwang, S. N. (2008). Efficiency decomposition in two-stage data envelopment analysis: An application to non-life insurance companies in Taiwan. European Journal of Operational Research, 185(1), 418–429. https://doi.org/10.1016/j.ejor.2006.11.041
- Klingebiel, R., & Rammer, C. (2014). Resource allocation strategy for innovation portfolio management. Strategic Management Journal, 35(2), 246–268. https://doi.org/10.1002/smj.2107
- Kogan, L., Papanikolaou, D., Seru, A., & Stoffman, N. (2017). Technological innovation, resource allocation and growth. The Quarterly Journal of Economics, 132(2), 665–712. https://doi.org/10.1093/qje/qjw040
- Lewis, H. F., & Sexton, T. R. (2004). Network DEA: Efficiency analysis of organizations with complex internal structure. Computers & Operations Research, 31(9), 1365–1410. https://doi.org/10.1016/S0305-0548(03)00095-9
- Li, X. (2014). Research on the regional scientific innovation based on the innovation network. Scientific Management Research, 1(6), 52–55. https://doi.org/10.19445/j.cnki.15-1103/g3.2014.06.014
- Li, M., & Chu, Y. (2017). Explore the research front of a specific research theme based on a novel technique of enhanced co-word analysis. Journal of Information Science, 43(6), 725–741. https://doi.org/10.1177/0165551516661914
- Liu, C. C. (2011). A study for allocating resources to research and development programs by integrated fuzzy DEA and fuzzy AHP. Scientific Research and Essays, 6(19), 3973–3978. https://doi.org/10.5897/SRE10.838
- McElwee, G., & Atherton, A. (2005). Publication trends and patterns in entrepreneurship: The case of the international journal of entrepreneurship and innovation. Journal of Small Business and Enterprise Development, 12(1), 92–103. https://doi.org/10.1108/14626000510579662
- Mei, S., & Chen, W. J. (2015). Research on allocation efficiency of S&T resource and the influential factors of sub-provincial cities. Science and Technology Management Research, 1(6), 64–68.
- Ngamassi, L., Maitland, C., & Tapia, A. H. (2014). Humanitarian interorganizational information exchange network: how do clique structures impact network effectiveness. VOLUNTAS: International Journal of Voluntary and Nonprofit Organizations, 25(6), 1483–1508. https://doi.org/10.1007/s11266-013-9403-4
- Qi, Y., & Guo, Y. (2015). Evaluation on market allocation efficiency of science and technology resources based on SFA model. Science Research Management, 36(3), 84–91. https://doi.org/10.19571/j.cnki.1000-2995.2015.03.011
- Ragin, C. C. (2006). Set relations in social research: evaluating their consistency and coverage. Political Analysis, 14(3), 291–310. https://doi.org/10.1093/pan/mpj019
- Ragin, C. C. (2008). Redesigning social inquiry: Fuzzy Sets and Beyond. University of Chicago Press. https://doi.org/10.7208/chicago/9780226702797.001.0001
- Ren, S. G., Hu, C. Y., & Wang, L. W. (2011). Empirical study of the influence of China's regional innovation network structural characteristics on regional innovation capability. Systems Engineering, 2(1), 50–55.
- Rihoux, B., & Ragin, C. C. (2009). Configurational comparative methods: Qualitative comparative analysis (QCA) and related techniques. Sage Publications. https://doi.org/10.4135/9781452226569
- Samimi, P., Teimouri, Y., & Mukhtar, M. (2016). A combinatorial double auction resource allocation model in cloud computing. Information Sciences, 357(357), 201–216. https://doi.org/10.1016/j.ins.2014.02.008
- Schilling, M. A., & Phelps, C. C. (2007). Interfirm collaboration networks: the impact of large-scale network structure on firm innovation. Management Science, 53(7), 1113–1126. https://doi.org/10.1287/mnsc.1060.0624
- Schneider, C. Q., & Wagemann, C. (2012). Set-theoretic methods for the social sciences: A guide to qualitative comparative analysis. Cambridge University Press. https://doi.org/10.1080/13645579.2013.762611
- Shao, H., Zhou, L., & Liu, Y. (2018). Study on the spatial network structure and driving factors of regional innovation development in China. Studies in Science of Science, 36(11), 2055–2069. https://doi.org/10.16192/j.cnki.1003-2053.2018.11.016
- Tan, Q. (2004). On the efficient allocation of regional innovation resources. Studies in Science of Science, 1(5), 543–545. https://doi.org/10.16192/j.cnki.1003-2053.2004.05.018
- Tao, Q., Li, R., & Wang, Y. (2016). Effects on innovation performance by combinations of innovation network features and environmental turbulence. Science & Technology Progress and Policy, 33(18), 19–27. https://doi.org/10.6049/kjjbydc.2016020263
- Tone, K., & Tsutsui, M. (2009). Network DEA: A slacks-based measure approach. European Journal of Operational Research, 197(1), 243–252. https://doi.org/10.1016/j.ejor.2008.05.027
- Wang, Q., Hang, Y., Sun, L., & Zhao, Z. (2016). Two-stage innovation efficiency of new energy enterprises in China: A non-radial DEA approach. Technological Forecasting and Social Change, 112, 254–261. https://doi.org/10.1016/j.techfore.2016.04.019
- Wang, X., & Wang, H. (2008). Pattern selection and structural equation modeling of regional science and technology innovation resource allocation system. Technology Economics, 27(12), 36–42. https://doi.org/10.3969/j.issn.1002-980X.2008.12.007
- Wang, Z., Wang, Q., Zhao, X., Lyles, M. A., & Zhu, G. (2016). Interactive effects of external knowledge sources and internal resources on the innovation capability of Chinese manufacturers. Industrial Management & Data Systems, 116(8), 1617–1635. https://doi.org/10.1108/IMDS-10-2015-0412
- Xiang, X. D., & Chen, L. F. (2016). Research on technology innovation efficiency evaluation model of manufacturing industries and its application. Operations Research and Management Science, 25(1), 215–223.
- Xiao, R. Q., Qian, L., & Chen, Z. W. (2012). Research on the innovation efficiency and its affecting factors in China’s high-tech industries. Journal of Management Science, 25(5), 85–98.
- Yin, X., Bao, X., & Meng, J. (2020). Evaluation and optimization path of scientific and technological resources allocation efficiency of advanced precise-top industries. Science & Technology for Development, 15(10), 1075–1085. https://doi.org/10.11842/chips.20190603001
- Yu, M., Guo, P., & Zhang, G. (2013). Impact of the regional innovation network structure on regional innovation efficiency. Science of Science and Management of S. & T, 3(8), 56–63.
- Zhang, X. M., Wang, Y. M., & Shi, H. L. (2018). A study of the optimal allocation of key resources in innovative enterprises from the perspective of efficiency. Science Research Management, 1(5), 103–111. https://doi.org/10.19571/j.cnki.1000-2995.2018.05.012
- Zhang, L. (2019). Research on efficiency of science and technology resources allocation in regional business incubation networks [Ph.D. Dissertation]. Shanxi University of Finance & Economics. https://tra.oversea.cnki.net/KCMS/detail/detail.aspx?dbname=CDFDLAST2019&filename=1019120985.nh
- Zhao, W., & Wang, N. (2017). Research on performance improvement path of Chinese returnees enterprises considering ambidextrous network: The fuzzy-set qualitative comparative analysis. Science of Science and Management of S. & T., 38(5), 128–139.
- Zhou, J. Z., Hu, Z. J., & Zhou, Y. (2002). Allocating S&T resources in national systems of innovation. Journal of Management Sciences in China, 5(3), 40–49.
- Zhu, P., & Xu, W. (2003). On the impact of government's S&T incentive policy on the R&D input and its patent output of large and medium-sized industrial enterprises in shanghai. Economic Research Journal, 1(6), 45–53.