
 ?Mathematical formulae have been encoded as MathML and are displayed in this HTML version using MathJax in order to improve their display. Uncheck the box to turn MathJax off. This feature requires Javascript. Click on a formula to zoom.
Abstract
This study took online lending as the main research object to quantitatively measure FinTech risk in China. A theoretical model was built to analyse the relationship between the assets and liabilities of peer-to-peer platforms and the risk of the entire online lending industry. The conditional value at risk method was used to measure the risk spillover effect of the online lending industry and the different types of platforms. Index smoothing and moving average were used to examine risk contagion. When the risk rate of the portfolio of the platform generally increases, the systemic risk of the whole industry also increases, and if the systemic risk of the industry spreads to the portfolio of the platform, it could affect the stability of the capital flow of the platform, and then affect the risk expectation of the platform itself. Most platforms with risk concerns were private. Banking platforms and public platforms were greatly affected by market risk; however, their own risks had relatively little impact on the overall market. The greater the market risk, the more platforms become risk platforms, and the smaller the impact on transition platforms. Regulatory sandboxes may be an effective means of preventing and controlling Fintech risks.
1. Introduction
The wide application of digital technology has brought about fundamental changes in economic activities (Saura, Citation2021; Skare & Soriano, Citation2021). Technological innovation has also created a new financial model, which has an important impact on the economy and finance (David-West et al., Citation2020; Rauter et al., Citation2019). Digital networks not only improve the transaction efficiency of economic activities, but also have constructed a new informational economy system among enterprises, consumers, and governments. In the era of the digital economy, FinTech, represented by peer-to-peer (P2P) platforms, crowdfunding, and digital currency, plays an important role in the construction of the digital economy system. FinTech promotes the development of inclusive finance to stimulate sustainable economic growth (Ginevičius et al., Citation2019; Nizam et al., Citation2020). However, the rapid development of FinTech also brings risks.
P2P online lending, which has been developing for more than 10 years in China, has three main characteristics: large volume, high risks, and extensive personnel involvement. In 2012, the total amount of online lending was 21.2 billion yuan. In 2014, it reached 252.8 billion yuan, exceeding the United States (10.4 billion US dollars) and the United Kingdom (2.4 billion US dollars) in the same period, becoming the country with the highest volume of online lending in the world. In 2017, the online lending transaction volume reached 2,805 billion yuan. Although it dropped to 1,794.8 billion yuan by the end of 2018, its volume is still the world’s largest. The proportion of cumulative risk platforms increased from 33% in 2015 to 85% at the end of 2018. At the end of 2014, the total number of investors and borrowers was less than 2 million. However, by the end of 2016, the total number exceeded 20 million. In 2017, the number of investors and borrowers were about 17.13 million and 22.43 million, respectively, an increase of 24.58% and 156.05%, compared with 2016, far exceeding other countries (Shen & Li, Citation2018).
At present, there is high risk in the field of FinTech, and the online lending industry is facing a transformation. As the largest and most representative market of FinTech, the risk prevention and control experience of the online lending industry over the past 10 years of its development has great importance for the transformation of FinTech. In-depth research has been carried out in the field of traditional financial risk, but there is still room for further exploration. There has been relatively little systematic and comprehensive analysis of risk of the FinTech industry.
This study focused on the quantitative measurement and analysis of FinTech risk. The paper is outlined as follows: The literature is reviewed in Section 2. Section 3 describes the theoretical model developed to assess the risks of FinTech from a new perspective on assets and liabilities. Section 4 describes the analysis of the risks of FinTech from an empirical perspective and the measurement of the spillover effect of FinTech risk using the VaR and conditional VaR (CoVaR) methods. Section 5 describes the study’s measurement of risk contagion in the FinTech industry. In Section 6, the findings are discussed and summarized.
2. Literature review
2.1. The identification and measurement of financial risk
The identification and measurement of financial risk has always been the focus of academic attention, and related research includes assessment of the early warning of financial crises and the measurement of financial pressure. Drehmann and Juselius (Citation2014) proposed that effective early warning indicators have the characteristics of timeliness, stability, and interpretability. Effective early warning risk indicators can be important tools for identifying financial risks and designing crisis response strategies. Hollo et al. (Citation2012) constructed the composite indicator of systemic stress to measure the pressure of financial systems based on 15 financial indicators of the stock market, banking system, foreign exchange market, and bond market. The weight of the index is affected by the correlation between the subindexes of each market; that is, the greater the pressure on multiple submarkets, the higher the weight in the index. Elsinger et al. (Citation2006) constructed a model to evaluate the financial stability of the banking system based on the relationship between interbank loans. Based on the data obtained from the Austrian banking industry, the authors found that the relationship between bank portfolios is the main cause of systemic risk.
In the financial system, the effect of each financial institution on the stability of the entire system is different. Therefore, the key to preventing and controlling financial risk is to accurately identify systemically important financial institutions. The identification of systemically important institutions needs to be based on the data of business transactions between financial institutions. Using data obtained from the Brazilian banking industry, Cont et al. (Citation2010) found that banks with relatively weak counterparties are more systemically important and institutions with greater inter-bank exposure are more systemically important. In addition to the direct characterization of financial infrastructure through payment and transaction data between financial institutions, some studies have also used indirect methods to identify systemically important institutions. Diebold and Yılmaz (Citation2014) used variance decomposition to analyse the stock price volatility of financial institutions and evaluate the degree of mutual influence between the stock prices of financial institutions in the system, in order to identify the institutions of systematic importance and analyse the path and channel of risk.
Some scholars have also carried out useful explorations of the issue of risk contagion among financial institutions. Allen and Gale (Citation2000) studied the relationship between risk contagion and liquidity of financial institutions and found that liquidity preference shocks are not fully correlated among regions. Banks usually hedge liquidity risk through capital allocation between banks in different regions. In a theoretical study of interagency risk contagion, Lagunoff and Schreft (Citation2001) used a stochastic dynamic game model to simulate the risk contagion process. In terms of empirical research, Van Rijckeghem and Weder (Citation2003) studied the impact of inter-bank lending on risk contagion between financial markets in emerging economies in recent financial crises. When a country’s banks are in crisis, the risk may spread to other foreign banks that maintain financial contact with them. Some researchers, such as Friedman and Schwartz (Citation1963), Gorton (Citation1988), Calomiris and Gorton (Citation1991), and Donaldson (1992), have studied the impact of risk contagion and information effects from the perspective of total capital.
2.2. The development of FinTech in China
China’s digital economy has developed rapidly in recent years, and currently ranks second worldwide in scale. According to the Group of Twenty’s broad definition, the digital economy includes digital industrialization and industrial digitization. With the wide application of artificial intelligence, blockchain technology, cloud computing, big data, and other digital technologies, industrial digitization makes it possible for enterprises, consumers, and the government to build a new information-based economic system and to improve transactional efficiency. However, it also brings new risks to China’s economic activities.
On the one hand, China has been at the forefront of the development of FinTech, and the development of new financial formats has great significance for the promotion of China’s high-quality economic growth. Alipay’s online launch in 2004 was regarded by many as the beginning of China’s new FinTech (Xie & Zou, Citation2012). Peer-to-peer online lending (P2P) began in 2007, and Internet funds appeared in 2013. Since 2013, various new financial formats based on FinTech have entered a period of accelerated development. Digital payment, Internet insurance, Internet consumer finance, Internet monetary funds, online lending, and digital currency have made great progress. According to an International Monetary Fund report, the valuation of China’s FinTech companies exceeded 70% of the global total valuation. In 2016, the total amount of individual mobile payments in China reached $790 billion, 11 times that of the United States (Zhang & Chen, Citation2019). The emergence and growth of digital financial models such as online lending (P2P), crowdfunding, digital currency, and third-party payment plays an important role in accelerating economic transformation, upgrading financial systems, promoting digital inclusive finance, and sustainable economic development. First, it is conducive to the transformation of economic growth from factor-driven to innovation-driven. High-quality economic growth is driven by innovation, and the emergence and growth of new financial formats promote business model innovation (Huang et al., Citation2019). Second, it helps reduce the imbalance in economic growth. The promotion effect of FinTech’s development on innovation and entrepreneurship and residents’ consumption is more prominent in backward and rural areas (Xie et al., Citation2018). Third, the competitive effect of FinTech’s development promotes the reform of the financial industry, improving the efficiency of financial operations, and providing better financial guarantee for high-quality economic growth (Frost et al., Citation2019).
2.3. FinTech risk in China
Due to the lack of digital financial infrastructure, public risk awareness, and enterprise risk control ability, in recent years, the risk events of FinTech have occurred frequently, and new financial formats have also brought new risks and hidden dangers. For example, by the end of 2018, there were 6622 online lending platforms (P2P) in China, but more than 85% of them had withdrawn from the market. If the relevant risks are not properly handled and resolved, they may spread to the formal financial system, increasing the difficulty of preventing systemic financial risks.
To prevent and control FinTech’s risks, it is necessary to identify and measure the risks. Some achievements have been made in the identification, measurement, and prevention of risks in China’s FinTech industry. In the research on early warning and identification of risks, Zhu et al. (Citation2018) constructed an online lending investment interest rate model and described the basic characteristics of the online lending industry from the perspective of examining whether the interest rate was affected by the liquidity tightness of the formal financial market, and established an early warning mechanism based on the operation behaviour of the risky platforms before default. Shen and Li (Citation2018) summarized the evolution of China’s P2P industry and evaluated the effectiveness of existing risk prevention and control mechanisms. Ba et al. (Citation2019) studied online lending risk from the perspective of debt transfer. Lu and Li (Citation2015) identified the types of risks faced by the online lending industry from the perspective of P2P operations and risk control modes. Gong and Wang (Citation2018) built a theoretical model from the perspective of whether P2P platforms are information intermediaries or credit intermediaries and put forward risk prevention measures. In the research on risk contagion, Li and Shen (Citation2018) studied the Ezubao event at the end of 2015 and the risk event in June 2018. They found that the main risk events were the results of clearing up the risk platforms, which were originally quite different from normal operation platforms. There was no evidence to show that many normal platforms were affected by risk platforms. In addition, Frost et al. (Citation2019) studied the impact of Big Tech on financial development. They found that the efficiency of big technology companies in providing financing for enterprises may be higher than that of traditional ones, and it is conducive for enterprises to expand their product lines. However, the impact of Big Tech on financial stability still needs further research, which is also a gap that needs to be addressed.
The above literature mainly starts from a certain type of business risk, discusses the early warning mechanism, or evaluates the prevention and contagion of a certain type of specific risk. These studies are helpful for academia to understand the early warning and prevention of the risks related of a specific new financial business. However, in the quantitative measurement of FinTech risk in the digital economy era, there are at least three perspectives worth further exploration. First, the characteristics of FinTech require that the analysis of the risks should start from China’s national conditions, clarify the actual positioning of new financial formats, and then select appropriate theoretical and empirical models, but this has not received enough attention in the existing literature. Second, the measurement of FinTech risks also needs to deduce the way of risk formation and contagion according to the actual business model of a certain type of new financial business in China. However, the existing empirical analysis often ignores the part of FinTech business, which is contrary to the classical theory, and because of this, the measurement of risk may also have a large deviation. Third, there is still a lack of quantitative research on the interaction of risk between a single platform and the whole industry.
3. Theoretical analysis
In the FinTech system, the online lending industry is the largest sector and has a relatively comprehensive statistical system and data sources. Therefore, in the analysis and measurement of FinTech risk. This study used the online lending industry as the main research object, and examined the risk of the industry from the perspective of capital flow. First, a theoretical model was developed to analyse the relationship between the balance sheet of P2P platforms and the risk of the entire industry.
The most serious problem of online lending platforms is the phenomenon of ‘repaying the old by borrowing the new’, which is also the most important factor inducing risk. However, in the process of the development of online lending in China, the severity of ‘borrowing the new to repay the old’ and its relationship with triggering industry risk has not been deeply studied. At the same time, according to the analysis of the risk conditions, the risk factors of platforms include assets, liabilities, and net capital inflow. In addition, the risk spillover effect is related to the public’s confidence in the platform; therefore, ownership is also an important factor that affects the public’s confidence in a platform, and then affects whether the risk spreads. Therefore, this study combined the existing theory and practical business model and explored the measurement of FinTech risk from three aspects: the net capital flow of platforms, the type of platform ownership, and risk contagion.
Suppose there are N platforms, X lenders, and Z borrowers in the FinTech system. The liabilities of platform i to lender x are recorded as and borrower z ’s assets are recorded as
iz. The entire industry’s liabilities L and assets A are defined as follows:
(1)
(1)
(2)
(2)
In addition, note that the cash flow of platform i is the risk reserve is
and the asset risk to borrower z is
Similarly, the entire industry’s asset risk is recorded as a
matrix
Therefore, the bankruptcy of platform can be divided into two types, and one case can be called fundamental bankruptcy, namely,
(3)
(3)
In this case, other platforms have no impact on the assets and liabilities of risk platform and the financial risk of platform
comes from itself. The other case is bankruptcy caused by risk contagion. In this case,
(4)
(4)
meanwhile,
(5)
(5)
Platform can realize all liabilities, but the bankruptcy of other platforms leads to risk transmission to platform
The assets and liabilities of the entire system under safety conditions can be expressed as follows:
(6)
(6)
For a single platform, if the survival function of a platform at time t is and the risk density function is
then the platform’s risk rate
can be expressed as the ratio of the risk density function and the survival function,
From
to
the risk rate can also be expressed as
(7)
(7)
From the above formula, it can be found that the risk rate can be regarded as the conditional probability of the risk density function under the condition that the platform risk does not erupt at time t. Further, when the time interval
from
to
approaches 0,
(8)
(8)
If T is used to represent the time of risk occurrence of the platform, and the risk distribution function is used to represent the cumulative distribution of the probability of risk occurrence of the platform up to time t:
(9)
(9)
Then the relationship between the risk function and cumulative distribution function
can be expressed as
(10)
(10)
is also an integral form of the risk density function
(11)
(11)
If the risk density function is an exponential distribution and represents the risk rate of the platform’s assets, then
(12)
(12)
Based on the exponential density function, the platform’s risk function can be expressed as:
(13)
(13)
Therefore, if the risk density function of the platform is an exponential form, the risk probability of the platform is the same as the risk rate of the platform’s portfolio. If the risk rate of the platform’s portfolio is generally improved, the systemic risk of the entire industry will increase. If the industry’s systemic risk spreads to the asset portfolio of the platform, it may affect the stability of the platform’s cash flow, thereby affecting the risk expectation of the platform itself.
4. Measurement of the risk spillover effect
4.1. Assessment of changes in overall market Capital risk
This study measured overall capital change in the online lending industry and evaluated its systematic risk. Generally speaking, the VaR method is used for measuring the risk of the financial system (i.e. the maximum loss that the financial system may produce in a certain period at a certain level of probability). The VaR method can be used to measure not only the maximum expected loss of the securities market under a certain degree of confidence, but also the risk of the banking system. Therefore, this study used the VaR method to calculate the overall risk of the online lending industry and the historical simulation method to evaluate the overall capital risk change of the online lending industry from January 2014 to January 2019. The data in this study were collected from the Wangdaizhijia, which is the most authoritative statistical platform for online loan data in China (). The probability of monthly net capital inflow loss caused by risk change in the online lending industry exceeding RMB 21.382 billion was 10%, and the proportion of this part of the loss to the total outstanding balance in the market would not exceed 2.6% with a probability of 90% (). Under normal circumstances, the average value of net capital inflow was 11.782 billion yuan, and the proportion of net capital inflow to the total outstanding balance of the market was 4.34%. Similarly, in terms of trading volume, the average monthly trading volume of the market as a whole increased to RMB 1.532 billion. With a 90% probability, the trading volume loss of the system would not exceed RMB 17.385 billion, accounting for approximately 2.44% of the total outstanding balance of the market.
Table 1. Assessment of changes in overall market capital risk.
The simulation results show that, under normal circumstances, the proportion of changes in trading volume and net capital inflow to the whole market system is not high, which suggests that the risk of new capital entering the market is controllable as a whole, and the current main task is to resolve the stock risk. In terms of investment profit and loss, the change in the average rate of return was −0.16%, which suggests that the overall rate of return of the whole industry is declining. From the perspective of investors, the monthly investment income caused by the change in rate of return decreases by an average of 108 million yuan, and with the 90% probability, the decrease in the rate of return will not exceed 0.6, and the decrease in investment income will not exceed 373 million yuan. Compared with the changes in net capital inflow and trading volume, only the average value of investment profit and loss was negative, which shows that under the background of the business model gradually complying with regulations and increasingly strict supervision, the income of the online lending industry will gradually return to normality. Therefore, on the basis of strictly implementing the ‘double reduction’ of the number of institutions and business scale, the overall risk of the online lending industry is controllable.
4.2. Measurement of the risk spillover effect by CoVaR
After measuring the overall VaR of the online lending industry, the conditional value at risk (CoVaR) model can be used to measure the risk spillover effect of different types of platforms. The CoVaR model was proposed by Adrian and Brunnermeier in 2016. Compared with the VaR model, the CoVaR model considers the risk linkage between financial institutions and the contribution of financial institutions to the systemic risk of the industry. The CoVaR model can be used to calculate the conditional extreme loss value that other financial institutions or markets may face when a financial institution or market has risk, or to measure the risk spillover effect of the financial system.
Generally speaking, is defined as the value at risk of a financial institution or system
under the quantile
that is, the maximum possible loss under the probability of
(14)
(14)
is defined as the VaR of a financial institution or system
with the risk event
of a financial institution or system
as the condition, or the risk level
faces when
is at a certain risk value. Therefore,
includes not only
’s own value at risk, but also the value of the risk spillover of
to
Specifically,
can be represented by the q-quantile of the conditional probability distribution as follows:
(15)
(15)
Further, the risk contribution of financial institutions or system to financial institutions or system
is expressed as
(16)
(16)
is the conditional risk event, and
is the difference between the value at risk of the financial system under the condition of the plight of a particular financial institution and the value at risk of the financial system under the condition of the median state of a particular institution, that is, the degree of risk spillover from
to
measures the risk spillover effect that a single institution may impose on the entire system. However, there is a large gap between the unconditional risk values of different financial institutions. To reflect the degree of risk spillover effect among financial institutions more accurately,
can be standardized as follows:
(17)
(17)
By removing the dimension effect, can more accurately reflect the risk spillover effect of financial institution
on
At present, the methods of calculating usually include quantile regression and the generalized autoregressive conditional heteroskedasticity model. The generalized autoregressive conditional heteroskedasticity model can be applied to different forms of data, especially non-linear structural data; however, if the error distribution is not properly assumed, the accuracy of the results will be affected. Quantile regression is not suitable for the characterization of nonlinear structural data, but it will not be limited to specific models, and it does not require specific assumptions regarding the error distribution. Based on the features of the selected data, a quantile regression was applied in the estimation model.
represents the entire online loan industry, and
represents platforms with different backgrounds. Thus, the industry’s q-quantile regression to
-type platforms can be expressed as follows:
(18)
(18)
Among them, represents the quantile estimation of the entire online loan industry under confidence level
when a risk event occurs on the type
platform. According to the definition of the value at risk,
(19)
(19)
Therefore, the predicted value obtained from the quantile regression gives the insured value of the online loan system based on condition and
represents the conditional quantile. For the conditional event
the measurement of the system
is based on the specific predicted value of
In the quantile regression framework, the measurement of system
can be expressed as
(20)
(20)
The risk spillover value of the type
platform to the online loan system can be expressed as
(21)
(21)
The platforms were divided into five types: the private sector, banking sector, public sector, state-owned sector, and venture capital sector. The trading volume and yield change of the five types of platforms from January 2015 to February 2019 were determined, and the product of monthly trading volume and yield change were calculated to represent the platform’s value at risk. Before calculating the it was necessary to test the normality and stability of the value at risk data of the platform because of the use of quantile regression and time series models. The Jarque-Bera test can be used to test the normality of distribution, and the Dickey-Fuller unit root test can be used to test the stationarity of the time series. shows the descriptive statistics of the value at risk of the different types of platforms.According to the results of the Jarque-Bera normal test, the null hypothesis that ‘the value at risk of each system platform obeys normal distribution’ could be rejected with 99% degree of confidence; that is, the value at risk of each system platform did not obey a normal distribution. According to the results of the Dickey-Fuller unit root test, the ADF statistics of all platforms were less than the critical value, and the series of values at risk were considered stationary at the 99% confidence level.
Table 2. Descriptive statistics of value at risk of different types of platforms.
The risk spillover effect between different types of platforms and the entire online lending industry is bidirectional. Therefore, the risk faced by a certain type of platform can be measured when the entire online lending industry is in crisis, and the risk faced by the whole industry can be measured when a certain type of platform is in crisis. A quantile regression model was used with the results of EquationEquation (18)(18)
(18) to calculate the risk spillover effect with a confidence level of 95%. shows the measurement of the VaR and the risk spillover effects of various platforms.
Table 3. The measurement of VaR and risk spillover effects of platforms.
The private platform had the highest value at risk among all the platforms, regardless of whether the spillover effect of market risk was considered (). This finding indicated that private platforms had the most concentrated risk in the online lending industry. When the risk spillover effect was considered, venture capital platforms were found to have the next highest value at risk, followed by public platforms, banking platforms, and state-owned platforms, in that order. Further, after calculating the △CoVaR of each platform type, it was found that online lending industry risk has the greatest impact on private platforms, followed by public platforms, banking platforms, and venture capital platforms, with the smallest impact on state-owned platforms.
Due to the large difference between the VaR of each platform type and the whole online lending industry, the risk spillover degree reflected by △CoVaR needed to be standardized. Therefore, the risk spillover rate of %CoVaR for each platform type was calculated to compare them from the perspective of relative value. When there was a risk event in the online lending industry, the risk spillover rate to private platforms was 67.42%; however, when there was a risk event on private platforms, the risk spillover rate to the entire online lending industry was 73.7% (). These findings indicate that special focus should be placed on the private sector in the supervision of the entire online lending industry system. If the risk cannot be effectively controlled, it will quickly spread to the entire market system, causing a greater negative impact. Results of the comparison also indicated that the risk spillover rate of the online lending industry to the banking and public sectors was relatively large, and the risk spillover rates of the state-owned and venture capital sectors were relatively small, indicating that the state-owned and venture capital sectors have strong ability to resist the overall risk of the market.
However, in turn, the risk spillover rate of the venture capital sector to the overall market was 46.56%, second only to the private sector. The risk spillover rates of the public and banking sectors were 29.89% and 24.91%, respectively. The risk spillover rate of the state-owned sector to the market was the smallest at 10.03%. By contrast, the banking and public sectors were greatly affected by market risk, while their own risks had relatively little impact on the overall market. The venture capital sector had a greater impact on the overall risk of the market, but was less affected by market risk. The bidirectional risk spillover rate of the state-owned sector was maintained at a low level.
5. Measurement of risk contagion
An important aspect of FinTech risk is contagion. A major risk event in the market can lead to the spread of negative sentiment and affect investor confidence. If public opinion is further fermented, irrational behaviour in the market intensifies. On the liability side, investors may reduce their investment in the platforms without difference and increase the pressure on the platform’s capital chain. On the investment side, borrowers may deliberately delay payments to prevent the platform from recovering funds as expected, and the platform that would not have failed will also have risks. These delays can prevent a platform from recovering funds as expected, and cause a platform that would not have failed to also have risks. Therefore, it is necessary to measure risk contagion in the FinTech industry for effective prevention and control.
5.1. Risk contagion in china’s FinTech industry
Online lending platforms with risk concerns can be categorized into two types: risk platforms and transition platforms. Risk platforms are platforms that cannot operate normally. They may have difficult cash withdrawals or their website may close. They may even be involved in a financial investigation. Transition platforms are platforms with potential risks, but they do not cause substantial losses to investors. Platforms in active liquidation due to poor management are likely to undergo business suspension, transformation, and other similar changes. Because these two types of platforms are different in nature, this study examined them separately in its analysis of risk contagion in the online lending industry.
shows the changes in the number of online lending platforms with risk concerns from July 2011 to January 2019. It can be seen that the changes in the risk platforms and the transition platforms were not exactly the same, but the numbers of both types of platforms rose rapidly during the same periods of time: December 2015, August 2016, and July 2018. The high coincidence of the risk and transition platforms indicates that significant risk events had taken place at these three points, and the risk was highly contagious, leading to the platforms actively or passively exiting the market in large quantities. In December 2015, a famous ‘Ezubao event’ occurred. After investigation, Ezubao illegally absorbed more than 76.2 billion yuan of public funds, involving more than 900,000 investors, which had great negative impact on the reputation of the FinTech industry as a whole. In August 2016, various ministries and commissions jointly issued the Interim Measures for the Management of Business Activities of Online Lending Information Intermediary Agencies, which is the first important regulatory document to systematically regulate the business activities of online lending, and also shows the determination of the government to rectify industry chaos. Because the issuance of this document did not necessarily have a negative impact on the market, the number of risk platforms in that month was not high, while the number of transition platforms reached 165, which was the highest for the entire industry since its beginnings.
Figure 1. Changes in the number of risk platforms and transition platforms in China’s FinTech market from July 2011 to January 2019.
Source: Wangdaizhijia.
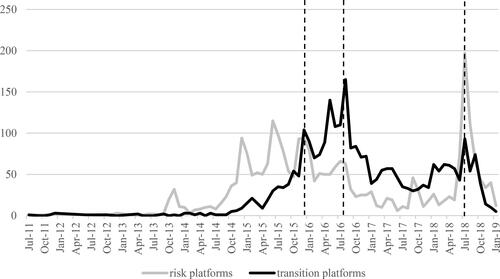
In July 2018, there was a ‘Platform Thunderbolt’ event caused by a delay in registration. According to the Notice on completing the special rectification and acceptance of P2P online lending risk issued by the China Banking Regulatory Commission, the filing and registration of P2P institutions originally scheduled to be completed by the end of June 2018 was delayed. The scale and speed of P2P platforms were significantly affected. All of the platforms were under the pressure of increased operational costs. Therefore, in July 2018, the number of risk platforms and the number of transition platforms both reached their peak. This study determined that December 2015, August 2016, and July 2018 were the three time periods with typical risk contagion characteristics of the online lending industry. It then measured the risk contagion of the FinTech industry and simulated the number of platforms closed due to risk contagion in those time periods.
5.2. Measurement of systemic risk contagion
There are two main types of platforms that exit the market. One is a platform that exits naturally. The online lending industry has reached a stage of maturity, and because of the large number of platforms in the market, there are bankrupt platforms almost every month. This situtation reflects the self-regulation laws of the industry and is a normal phenomenon. Another type of platform is one that exits due to risk contagion. This type of platform may have operational risks but will not close down immediately. The platform exposes the risk in advance or voluntarily exits because of the influence of the overall market environment. Estimating the proportion of these platforms enabled an analysis of the impact of the FinTech risk contagion.
Specifically, stands for the total number of platforms exiting at time t,
stands for the number of platforms exiting naturally, and
stands for the number of platforms exiting due to risk contagion. Then the three types of platforms have the following relations:
(22)
(22)
Further, can be estimated by combining exponential smoothing and moving average methods, and the expression is as follows:
(23)
(23)
In EquationEquation (23)(23)
(23) , k represents the window span of the platform. According to the simulation results, when k is taken as 3, it is an ideal window period; that is, the total number of existing platforms in 3 months before and after the event is used to estimate the number of natural exiting platforms in that month. According to Equationequation (23)
(23)
(23) , the number of naturally exited platforms from November 2011 to October 2018 was predicted and compared with the actual number of exited platforms ().
Table 4. Difference between actual quantity and predicted quantity of exited platforms.
shows the difference between the predicted and actual values of the number of risk platforms and the number of transition platforms. According to the statistical results, both the predicted and actual values of the number of exited platforms are very close, and there is no significant difference between the two types of platforms, indicating that the prediction method selected in this study is accurate. By inputting the risk contagion data from December 2015, August 2016, and July 2018 into Equationequation (23)(23)
(23) , we were able to estimate the number of risk and transition platforms. The relationship between the number of platforms exiting due to risk contagion and the total number of exited platforms could be simulated by an exponential function, in which the goodness of fit of the risk platforms was 0.9933, and that of the transition platforms was 0.9515. The risk probabilities of different risk and transition platforms were calculated according to the number of exited platforms from July 2011 to January 2019. Combined with the results of the index simulation, the contagion of systemic risk of Fintech can be measured.
shows that the larger the risk scale, the smaller the probability of occurrence, and that the risk structure of the risk platforms was very similar to that of the transition platforms. It can be seen from that the fluctuation trends of these two types of platforms are not exactly the same. If the correlation coefficient of the number of the two types of platforms from July 2011 to January 2019 is calculated, the result is 0.4684, which is not a strong correlation. However, from the perspective of risk structure, there is a high degree of similarity between the risk platforms and the transition platforms, that is, whether it is an active transition or the condition that cannot be operated normally, the number of platforms exiting the market follows certain rules.
Figure 2. Comparison of risk contagion between risk platforms and transition platforms.
Source: Wangdaizhijia.
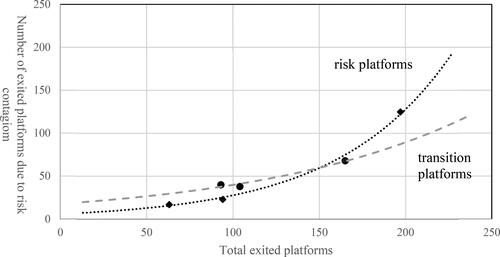
Table 5. Measurement of FinTech systemic risk contagion.
Generally speaking, it is a normal market clearing state in which the number of existing platforms is less than 50 in the current month, and the possibility of large-scale market risk is not high. To more intuitively reflect the different degrees of risk contagion between the risk platforms and transition platforms, presents a comparison of the two types of platforms.
It was found that when the systemic risk scale was smaller, its impact on the transition platforms was higher than that of the risk platforms (). In other words, the smaller the total number of exited platforms, the lower the proportion of exited platforms due to risk contagion and the higher the proportion of naturally exited platforms, and the higher the proportion of exited platforms due to risk contagion, the lower the proportion of naturally exited platforms. However, when the total number of exited platforms exceeds 150, the relative relationship between the two types of platforms changes. Since then, risk platforms have been increasingly affected by risk contagion, among which the proportion of exited platforms due to risk contagion has begun to exceed that of transition platforms. According to the simulation results, when the total number of exited platforms exceeds 175, the number of risk platforms that are affected by risk contagion will exceed the number of naturally exited risk platforms. For transition platforms, when the total number of exited platforms exceeds 55, the number of naturally exited transition platforms will exceed the number of platform exits due to risk contagion. In short, the greater the market risk of FinTech, the greater the impact on the risk platforms and the smaller the impact on the transition platforms. The smaller the market risk, the less the naturally exited transition platforms, and the more transition platforms exit due to risk contagion.
6. Conclusion and further discussion
This study analysed the risk of FinTech in the era of the digital economy based on a theoretical model, combined with CoVaR to measure the risk spillover effect of the online lending industry, and used index smoothing and moving average to identify and measure the risk contagion of the online lending industry, the primary FinTech-based industry. The private sector had the most concentrated market risk in the measurement of the risk spillover effect. Banking platforms and public platforms were greatly affected by market risks, while their own risks had relatively little impact on the overall market. Venture capital platforms had a greater impact on the overall risk of the market, but were less affected by market risk. The bidirectional risk spillover rate of state-owned platforms was maintained at a low level. The analysis of risk contagion revealed that the greater the market risk, the more platforms become risk platforms, and the smaller the impact on transition platforms. The main contribution of this study was its systematic and comprehensive measurement of the risk of online lending, which is of great significance to the overall risk assessment of FinTech.
This study revealed that in the current online lending industry, the risk is mainly concentrated in the private and state-owned sectors, while the venture capital and public sectors are relatively safe. The public and venture capital sectors have occupied most of the market share. This reflects the difference between new and traditional finance. At present, state-owned capital plays a leading role in both the securities market and the banking system, but in the new financial market, platforms with state-owned capital backgrounds may not perform better. The public platforms and venture capital platforms selected through the market mechanism not only have stronger capital absorption capacity, but also have better risk control. After guiding the risk platforms to withdraw from the market and properly handle market risks, the government should comprehensively promote the market-oriented construction of new financial formats, give full play to the regulatory mechanism of the market, and optimize the allocation of resources.
Financial risk has an important impact on the national economy. The government is responsible for regulating the financial market (Gulzar et al., Citation2019; Imran et al., Citation2020). The risk evolution of online lending in China has inspired regulators to strictly supervise all financial innovations as early in their development as possible; otherwise, higher costs are required to recover the losses caused by risks. The concept of the ‘regulatory sandbox,’ which is widely used in developed countries, should be introduced into China’s regulatory practices. The ‘regulatory sandbox’ aims to provide a pre-safety simulation test for financial innovation activities. Companies applying to engage in a new financial business can do so using the regulatory sandbox test to the regulatory authorities after making appropriate plans. After the sandbox supervision test, the company can further improve with the results of the test as a guide. This measure can facilitate prior guidance and bidirectional communication and reduce traditional post-event monitoring and passive response. It can also eliminate potential hazards, improve the flexibility and effectiveness of supervision, increase the identification of risk sources, and effectively reduce risk contagion.
Disclosure statement
No potential conflict of interest was reported by the author.
Additional information
Funding
References
- Adrian, T., & Brunnermeier, M. K. (2016). CoVaR. American Economic Review, 106(7), 1705–1741. https://doi.org/10.1257/aer.20120555
- Allen, F., & Gale, D. (2000). Financial contagion. Journal of Political Economy, 108(1), 1–33. https://doi.org/10.1086/262109
- Ba, S., Bai, H., & Li, Y. (2019). Risk of P2P online lending platform: From the perspective of creditor’s rights transfer. Research on Financial Issues, 1, 52–58. in Chinese).
- Calomiris, C. W., & Gorton, G. (1991). The origins of banking panics: Models, facts, and bank regulation. Financial Markets and Financial Crises. University of Chicago Press.
- Cont, R., Moussa, A., & Santos, E. B. (2010). Network Structure and Systemic Risk in Banking Systems, SSRN.
- David-West, O., Iheanachor, N., & Umukoro, I. (2020). Sustainable business models for the creation of mobile financial services in Nigeria. Journal of Innovation & Knowledge, 5(2), 105–116. https://doi.org/10.1016/j.jik.2019.03.001
- Diebold, F. X., & Yılmaz, K. (2014). On the network topology of variance decompositions: Measuring the connectedness of financial firms. Journal of Econometrics, 182(1), 119–134. https://doi.org/10.1016/j.jeconom.2014.04.012
- Donaldson, R. G. (1992). Sources of panics. Journal of Monetary Economics, 30(2), 277–305. https://doi.org/10.1016/0304-3932(92)90063-8
- Drehmann, M., & Juselius, M. (2014). Evaluating early warning indicators of banking crises: Satisfying policy requirements. International Journal of Forecasting, 30(3), 759–780. https://doi.org/10.1016/j.ijforecast.2013.10.002
- Elsinger, H., Lehar, A., & Summer, M. (2006). Risk assessment for banking systems. Management Science, 52((9)), 1301–1314. https://doi.org/10.1287/mnsc.1060.0531
- Friedman, M., & Schwartz, A. (1963). A monetary history of the United States, 1867–1960. Princeton University Press.
- Frost, J., Gambacorta, L., Huang, Y., Shin, H. S., & Zbinden, P. (2019). BigTech and the changing structure of financial intermediation, BIS Working Paper. Economic Policy, 34(100), 761–799. no. https://doi.org/10.1093/epolic/eiaa003
- Ginevičius, R., Dudzevičiūtė, G., Schieg, M., & Peleckis, K. (2019). The inter-linkages between financial and economic development in the European Union Countries. Economic Research-Ekonomska Istraživanja, 32(1), 3315–3332. https://doi.org/10.1080/1331677X.2019.1663436
- Gong, Q., & Wang, L. (2018). Inclusive finance, risk reserve and investor protection: Taking platform commitment guarantee as an example. China Economic Quarterly, 18(4), 1581–1598. in Chinese).
- Gorton, G. (1988). Banking panics and business cycles. Oxford Economic Papers, 40((4)), 751–781. https://doi.org/10.1093/oxfordjournals.oep.a041885
- Gulzar, S., Mujtaba Kayani, G., Xiaofeng, H., Ayub, U., & Rafique, A. (2019). Financial cointegration and spillover effect of global financial crisis: A study of emerging Asian financial markets. Economic Research-Ekonomska Istraživanja, 32(1), 187–218. https://doi.org/10.1080/1331677X.2018.1550001
- Hollo, D., Kremer, M., & Lo Duca, M. (2012). ‘CISS-a Composite Indicator of Systemic Stress in the Financial System’, SSRN.
- Huang, Z., Shen, Y., Guo, F., & Huang, Y. (2019). ‘Digital financial innovation supports high quality economic growth’, Jingshan Report (in Chinese).
- Imran, Z. A., Ejaz, A., Spulbar, C., Birau, R., & Nethravathi, P. S. R. (2020). Measuring the impact of governance quality on stock market performance in developed countries. Economic Research-Ekonomska Istraživanja, 33(1), 3406–3426. https://doi.org/10.1080/1331677X.2020.1774789
- Lagunoff, R., & Schreft, S. L. (2001). A model of financial fragility. Journal of Economic Theory, 99((1-2)), 220–264. https://doi.org/10.1006/jeth.2000.2733
- Li, C. S., & Shen, Y. (2018). Information identification of risk contagion: An empirical study based on P2P lending market. Journal of Financial Research, 11, 98–118. in Chinese).
- Lu, X., & Li, H. (2015). Operation mode and risk control of P2P online lending, Reform, no. 2 (pp. 60–68 (in Chinese).
- Nizam, R., Karim, Z. A., Rahman, A. A., & Sarmidi, T. (2020). Financial inclusiveness and economic growth: New evidence using a threshold regression analysis. Economic Research-Ekonomska Istraživanja, 33(1), 1465–1484. https://doi.org/10.1080/1331677X.2020.1748508
- Rauter, R., Globocnik, D., Perl-Vorbach, E., & Baumgartner, R. J. (2019). Open innovation and its effects on economic and sustainability innovation performance. Journal of Innovation & Knowledge, 4(4), 226–233. https://doi.org/10.1016/j.jik.2018.03.004
- Saura, J. R. (2021). Using Data Sciences in Digital Marketing: Framework, methods, and performance metrics. Journal of Innovation & Knowledge, 6(2), 92–102. https://doi.org/10.1016/j.jik.2020.08.001
- Shen, Y., & Li, C. S. (2018). A study on the mechanism of risk mitigation for online peer to peer lending in China. China Social Sciences Press. (in Chinese).
- Skare, M., & Soriano, D. R. (2021). How globalization is changing digital technology adoption: An international perspective. Journal of Innovation and Knowledge, Forthcoming.
- Van Rijckeghem, C. V., & Weder, B. (2003). Spillovers through banking centers: A panel data analysis of bank flows. Journal of International Money and Finance, 22(4), 483–509. https://doi.org/10.1016/S0261-5606(03)00017-2
- Xie, X., Shen, Y., Zhang, H., & Guo, F. (2018). Can digital finance promote entrepreneurship? Evidence from China. China Economic Quarterly, 18(4), 1557–1580. (in Chinese)
- Xie, P., & Zou, C. (2012). Research on Internet financial model. Journal of Financial Research, 12, 11–22. in Chinese).
- Zhang, L., & Chen, S. (2019). China’s digital economy: Opportunities and risks. IMF Working Papers 19/16. International Monetary Fund. https://doi.org/10.5089/9781484389706.001
- Zhu, J. X., Shen, Y., & Zou, X. (2018). P2P lending in China and the role of regulation technology: Inclusive financing or ponzi scheme? China Economic Quarterly, 18(4), 1599–1622. in Chinese).