
 ?Mathematical formulae have been encoded as MathML and are displayed in this HTML version using MathJax in order to improve their display. Uncheck the box to turn MathJax off. This feature requires Javascript. Click on a formula to zoom.
Abstract
This study aims to contribute to the empirical literature that evaluates the impact of the Science & Technology (S&T) Outline, a Chinese innovation policy implemented in 2006, measured by the scale of patent value. We first create a comprehensive patent valuation model (CPVM), derived from the extended patent renewal model and a variety of feature indices, to measure a firm’s patent value. From a database with over 700,000 Chinese patents from 1985 to 2013, we find that the patent value increases after the release of the S&T Outline, and the scale of patent value after 2006 is about 26.52 times more than that before 2006. Further, we use a quasi-difference in differences (DID) model to estimate the growth effect caused by the innovation policy. The results indicate that the S&T Outline had a significant effect on the promotion of patent value, in industries with high patent intensity. Considering the lag effect of the S&T Outline, we construct innovation correlation networks to visualise and compare its promotion effect. We find that regional networks have a gathering tendency after policy implementation, while industrial networks have a decentralising tendency.
JEL CODES:
1. Introduction
Technological innovation drives firm competitiveness and sustains the growth of an economy (Danguy, Citation2016; Mai et al., Citation2019; Yeo, Citation2019). In the United States (US) and European countries, a primary concern for long-term economic development is the nationwide technical performance (Negassi & Sattin, Citation2019; Tomasz & Arkadiusz, Citation2019). In recent years, China has gained a reputation of being the ‘world’s factory’, and has aspired to improve its innovation capacity from ‘made in China’ to ‘created in China’. Since the 1980s, it has initiated several programmes to reform its innovation system (Ma et al., Citation2009). In 2006, China announced a 15-year ‘Medium- to Long-Term Plan for the Development of Science and Technology (2006–2020)’ or the S&T Outline, which emphasises the strategic role of technological innovation at the national level.
With its shift from the ‘processing factory’ to the ‘innovation base’, China has experienced explosive growth in domestic patent applications (Hu & Jefferson, Citation2009; Li, Citation2012), surpassing all other economies to become the world’s biggest filer of patent applications since 2011 (World Intellectual Property Organization, Citation2012). The information implicit in the number of patents issued at different times, in different industries, and to different types of inventors also contains essential information that supports techno-economic analysis (Griliches, Citation1998; Watanabe et al., Citation2001). However, several studies have pointed out discrepancies in the quantity versus the actual quality of patents in China (Dang & Motohashi, Citation2015; Ma et al., Citation2009), given the incentives to produce several low-value patents (Ernst, Citation2011). The total value added by patent-intensive industries amounted to only 11.6% of China’s gross domestic product (GDP) in 2018Footnote1, far below 38.2% of the US’ GDP in 2014Footnote2.
The lack of heterogeneity in patents also poses a challenge to technological innovation at the firm level in China (Hu et al., Citation2020; Schankerman & Pakes, Citation1986; Zeebroeck, Citation2011). Some scholars have studied the value of patents as a sophisticated and reliable proxy of firm innovation, a signal of quality (Gambardella, Citation2013; Ribeiro & Shapira, Citation2020; Tukoff-Guimares et al., 2021). A patent has no value unless commercialised, and the patent value can remove the ‘noise’Footnote3 in patent counts, as an accurate measure of the innovative output of firms (Schankerman & Pakes, Citation1986). However, given the difficulty of assessing patent value (Hsieh, Citation2013; Hwang et al., Citation2021; Layne-Farrar & Lerner, Citation2011), many studies have considered patent counts as an indicator of innovation (Bronzini & Piselli, Citation2016; Cappelen et al., Citation2012). Moreover, few studies have provided empirical evidence on the economic value of these patents. It remains unclear whether innovation policy has resulted in the promotion of the value of Chinese patents.
This study shifts the perspective from the number to the value of patents, which helps evaluate China’s efforts in boosting its innovation system and progress. The value of the patent is measured at the firm level and reveals the extent to which policy incentives can stimulate patent value. Since the S&T Outline is the most strategic innovation policy in China (Cao et al., Citation2006), we set 2006 as the baseline for the S&T Outline to start exerting its effects.
This study contributes to the literature on innovation in developing countries, such as China, in the post-innovation stage. First, a comprehensive patent valuation model (CPVM) was proposed based on an extended patent renewal model and a variety of feature indices for different patents including three essential procedures, namely, estimating the average patent value, fitting, and predicting the patent renewal pattern, and constructing a feature index for an individual patent. Thereafter, we used CPVM to calculate the economic value of each patent. Second, by matching the patent value of firms with industrial and regional economic data, we empirically demonstrated the effects of the S&T Outline, with findings that provide useful policy insights. Third, we constructed innovation correlation networks linking industries and regions to visualise and compare the promotion effect before and after the release of the S&T Outline.
The remainder of this paper is as follows. Section 2 presents the literature review, while section 3 provides an extended model of patent valuation, introducing the study’s empirical methodology. Section 4 reports the econometric results and section 5 presents the discussion and conclusion.
2. Literature review
2.1. Measurement of firm innovation performance
Public policy focuses on stimulating economic growth while emphasising the advancement of firm innovation (Lee & Trimi, 2018; Skm & Ab, Citation2020). There is a growing demand to assess firm innovation and technological change to increase our knowledge about innovation drivers (Kleinknecht et al., Citation2002; Seddighi & Mathew, Citation2020).
Firm innovation performance can be measured in terms of innovative inputs such as research and development (R&D) expenditures, staff qualifications (Blanco et al., Citation2020; Forsman, Citation2011; Nilsson & Ritzen, Citation2014), and intensity (Chen et al., Citation2019), or innovation outputs, such as patent applications (De Rassenfosse et al., Citation2013; Huang et al., Citation2015; Mairesse & Mohnen, Citation2004), holdings (Mairesse & Mohnen, Citation2004), citations (Beneito, Citation2006; Chen et al., Citation2012; Lahiri, Citation2010; Verhoeven et al., Citation2016), frequency (Ahuja & Katila, Citation2001), and quantity (Bellamy et al., Citation2014). Among these, the patent count indicators, such as applications, holdings, and the number of patents, are widely used to measure firms’ innovation activity. Patent counts are frequently used to measure innovation performance first, because patents are the most extensively used output indicators of innovation given the easy accessibility of data and representativeness of technological novelty (Hsu et al., Citation2015), and second, because the number of patents has a significantly positive correlation with new product introduction (Brouwer & Kleinknecht, Citation1999) and technical capabilities of firms (Hoetker, Citation2005).
However, the number of patents is not the best indicator of the innovation level of firms. Prior studies have highlighted that simple patent counts are incapable of accurately capturing the value of underlying innovations (Chen et al., Citation2012; Griliches, Citation1990) because the technological quality and economic value of patents differ greatly (Griliches, Citation1990). Thus, patent value is a relatively more accurate measure of innovation performance than patent counts because it involves the quality and economic gains of various patents. Many scholars have attempted to overcome the disadvantages of patent counts to measure a firm’s innovation capability by estimating patent value (Gambardella, Citation2013; Lawryshyn et al., Citation2017; Park & Park, Citation2006; Schankerman & Pakes, Citation1986; Yang et al., Citation2015). Therefore, we consider that patent value data can reflect the heterogeneity and authenticity of technological creativity, and employ this data to investigate the technological innovation performance of firms.
2.2. Methods of patent valuation
Existing research on estimating patent value can be roughly divided into estimating the value of a single patent from a micro perspective, or the average value of a cohort of patents from a macro perspective. The former methods include the comprehensive evaluation, cost, discounted cash flow, market, and option pricing methods. The latter includes the survey method and patent renewal model. The patent renewal model is widely used by scholars because of its objectivity, reliability, and easy access to basic data (Zhang et al., Citation2014).
Proposed by Pakes and Schankerman (Citation1984), this model is based on the patentee’s expected return maximisation decision theory, and estimates the average value of a cohort of patents based on the discounted value of expected net return by setting the initial return distribution function and expected return decay mode of a cohort of invalid patents. Setting the expected return decay mode is important for the model. Many scholars, such as Bessen (Citation2009) and Danish et al. (Citation2020) used the exponential expected return decay mode proposed by Pakes and Schankerman (Citation1984) and Schankerman and Pakes (Citation1986) to study patent value in the United Kingdom (UK), US, Germany, France, Finland, India, and other countries. Given the uncertainty of successful realisation of a patent’s economic value after it is granted, some researchers have improved the expected return decay mode. Pakes (Citation1986), Lanjouw (Citation1998), Deng (Citation2011), Zhang et al. (Citation2014) and other scholars believe that the patentee’s learning ability, commercial strategy, and responses when the patent is infringed will have an impact on the expected return of the patent. The random expected return decay mode is then introduced into the model to estimate the patent value.
However, the patent renewal model has some limitations. First, the setting of the expected return decay mode needs improvement. It takes a long time for an invention patent to be authorised, commercialised, and put on the market because of the high complexity of technical knowledge. During this time, imitation, replacement, and the speed of elimination is slow. Paradoxically, the exponential expected return decay mode assumes that the expected return of the invention patent decays rapidly from the beginning. Furthermore, the operation procedure of the random expected return decay mode is complicated and lacks practicality due to various assumptions or parameters, although it considers the uncertainty of return. Second, limiting the application object of the model to expired patents leads to a failure in estimating the value of several unexpired invention patents. Most invention patents are valid, and have a maximum protection period of 20 years. Third, the patent value estimated by the expected net return cannot reveal the real value of the patent. The expected net return is a conceptual return measured according to accounting principles and deviates from the actual return of patents. Thus, this study sets the expected return decay mode according to the actual characteristics of invention patents, establishes the renewal probability prediction model for unexpired patents, and constructs feature indices for different patents based on their characteristics. We also propose an extended model for comprehensively estimating the patent value considering the expected total return as the patent value.
2.3. Effects of innovation policy
Over the past few decades, innovation policy has emerged as a normal instrument to promote the commercial exploitation of new ideas (OECD., Citation2003). Policymakers and scholars have prioritised the role of innovation policy in economic development.
Studies in expanding numbers evaluate the effectiveness of two main innovation policies, namely tax incentives (indirect support policy) and direct subsidies (direct support policy). Tax incentives mainly refer to R&D tax credits and patent boxes, while R&D subsidies are part of the direct subsidy policy. They aim to encourage firms to enhance investment in the innovation process by reducing costs (Bronzini & Piselli, Citation2016).
There are three main types of empirical conclusions about the effectiveness of innovation policy. First, the effect of the R&D subsidy or tax credit policy is significantly positive (Czarnitzki et al., Citation2011; Foremanpeck, Citation2013; Radicic et al., 2016). Second, the incentive effect of tax incentives is heterogeneous in the industry. Castellacci and Lie (Citation2015) show that the effectiveness of R&D tax credits is, on an average, stronger for firms in the service and low-tech sectors. Third, direct subsidies have a crowding-out effect that negatively influence private investment (Dimos & Pugh, Citation2016; Montmartin & Herrera, Citation2015).
Recent attempts have examined the effects of innovation policies on patent activities, but the conclusions are inconsistent. Bronzini and Piselli (Citation2016) used a regression discontinuity design strategy to study the effect of R&D subsidies on the number of patents. They provided evidence of the effectiveness of R&D subsidies in smaller firms. However, Cappelen et al. (Citation2012) and Zanghelini and Andrade (Citation2015) illustrated that R&D tax credits or other tax incentive policies have failed to produce any noticeable effect on firms’ patent activities.
Thus, most existing studies have concentrated on the effects of various forms of innovation support policy at the micro level. Few studies have evaluated the impact of major innovation policies in a country or region at a macro level. As countries like China transform from traditional manufacturing countries to innovation hubs, they have launched several innovation incentive policies to promote technology upgradation. It is difficult to accurately reveal the impact of the overall innovation policy environment on innovation activity only by examining the effects of individual innovation policies at the micro level. There may be superposition or crowding-out effects among the various policies. Since the S&T Outline guides various innovation policies such as R&D subsidies and patent tax credits in China, this paper analyses the technological innovation effects that it induces.
2.4. Construction of innovation network
Scholars have realised the importance of innovation networks in gaining access to scarce resources, managing complex innovation processes, and enhancing technological capabilities (Pyka, Citation2002). Gradually, theoretical research on innovation has eliminated traditional innovation ideas, and shifted focus to the interaction and structural differences of individuals in the innovation relationship. This is divided into three aspects, namely, structural characteristics (Fujiwara & Aoyama, Citation2010; Rahmandad & Sterman, Citation2008; Schilling & Phelps, Citation2007), functionality (Asheim et al., Citation2011; Audretsch et al., Citation2008; Carlsson et al., Citation2002) and performance of innovation (Sandstrom & Carlsson, Citation2008; Straub et al., Citation2004). With the rapid development of theoretical systems and method tools, and the continuous changes in knowledge and innovative activities, the dynamic evolution process and the motivation of innovation networks are now receiving increased attention (Garcia, Citation2005; Savin & Egbetokun, Citation2016).
Of late, patents have been applied to innovation networks. In the extant literature, the links between individuals have been modelled in several ways (Beaudry & Schiffauerova, Citation2011). Yoon and Park (Citation2004) first proposed the patent network analysis method, constructing a patent network using co-occurring keywords in each patent specification, and researching the prediction of network evolution. Leydesdorff and Vaughan (Citation2006), Sternitzke et al. (Citation2008), and Breschi and Lissoni (Citation2009) constructed a patent cooperation network based on patent counts or citations. Von Wartburg et al. (Citation2005) further used bibliographic literature using bibliographic coupling as a similarity measure. However, they did not perform dynamic network analysis from the innovation network perspective.
Some scholars have begun to research the evolution of patent networks. Inoue et al. (Citation2010) used the names and addresses of organisations and the inventors of patents to create a network, and combined these with the preference connection mechanism and the geographical distance between nodes to propose a network evolution model. Choe and Lee (Citation2017) examined the structure, characteristics, and evolution of a research collaboration network using co-assignee information on joint patents in South Korea. Despite significant efforts to analyse patent networks, most research is still based on simple patent counts or citations, limiting the scope of analysis and the richness of potential information (Yoon & Park, Citation2004). This is especially true for increasingly complex patent information, where the challenges of patent data use remain.
While there are many limitations to the use of patent information included in patent counts and patent citations (Murray, Citation2002), we see that patent value is a better indicator of firms’ innovation capability. Therefore, this study attempts to construct innovation correlation networks from the perspective of patent value and observe dynamic changes through visualisation.
3. Method and materials
From the patent economic value perspective, we provide a framework based on the CPVM and difference-in-differences (DID) estimation. These establish a link between patents counted by pieces and their economic value, and further examine whether the innovation policy (S&T Outline) promotes the accumulation of patent value. Finally, we construct innovation correlation networks linking industries and regions to visualise and compare the promotion effect before and after the release of the S&T Outline.
3.1. Method for estimating patent value
Patent value is defined as the total economic return that a patent can generate during its life. Patents can provide their owners with a degree of market power that conveys a stream of profits that exceeds the profits they could earn without patents (Bessen, Citation2008). These additional profits embody the economic returns yielded by patents for patentees, and can be realised through licensing, sale, or production. Here, the patent value is estimated in terms of economic value and closer to its market value. Accordingly, patent evaluation is executed by estimating the patentee’s economic returns.
In our CPVM model, we follow three steps: measuring the average patent value, fitting and predicting the patent renewal pattern, and constructing the feature index for the value of an individual patent.
3.1.1. Average value of patents
Here, we propose an extended patent renewal model to measure the average value of patents at the aggregate level. The patentee must pay an annual renewal fee to maintain patent protection else the patent lapses permanently (Lanjouw, Citation1998). Thus, a patent renewal model was proposed to estimate the private returns of the patentee based on the rational decision-making mechanism, in which patentees choose an optimal age to stop paying the renewal fee. Let {Ctj} denote the sequence of renewal fees at different ages of a patent in cohort j, and {Rtj} denote the sequence of returns generated by a patent during the coming year. The decision problem of the patentee is choosing an optimal lifespan T* to maximise the discounted value of net returns where s is the discounted rate. The original patent renewal model endowed each cohort patentFootnote4 with an initial return Roj, and assumed {Rtj} decay with a fixed rate based on Roj. Thus,
where δaj is the decay rate of patent returns. Since {Ctj} is non-decreasing at t, {Rtj} does not increase at t, and the sequence of net returns {Rtj − Ctj} is non-increasing at t. The condition for renewal of the patent at age t is {Rtj − Ctj} ≥ 0. In other words, there exists a unique optimal lifespan T* such that for any t≤Tj*, {Rtj − Ctj} ≥ 0, and for any t≤Tj*, {Rtj − Ctj} < 0. Therefore, the renewal rate RWtj of patents in cohort j at age t can be calculated as follows.
(1)
(1)
where f (Roj;θj) and F (ztj;θj) denote the density and distribution functions of initial returns Roj, respectively, and
Given the functional form for the distribution of Roj, the parameter f (Roj;θj) and decay rate δaj can be estimated based on the proportion of patents calculated by the patent lifespan observed and the proportion of patents predicted by Equationequation (1)
(1)
(1) .
In the uncommercialised application stage, invention patents are eliminated gradually due to the high complexity of technical knowledge. The expected return of invention patents correspondingly decays slowly in the early stages. However, the exponential expected return decay mode of the original model which assumed that {Rtj} decays rapidly from the beginning, ignores this feature of invention patents. Thus, we measure the value of a patent more precisely using an extended patent renewal model. We assume that the patentee has an expected initial return from the patent in the application stage, and subsequent returns at each age t of the patent decay, based on its initial expected return REoj. The decay rate here is initially slow or zero. Thereafter, it experiences an increase due to technology upgradation and depreciation of present knowledge. The specific formula is as follows.
(2)
(2)
where kj is the variable parameter of the decay rate, estimated using the above-mentioned method. We also refer to pertinent studies and assume the functional form of the initial returns distribution as a log-normal distribution, with s = 0.1. Finally, the average value of a patent in cohort j can be calculated using the estimation results of the parameters. The specific calculated formulaFootnote5 is as follows.
(3)
(3)
where
and
denote the mean and variance of the log-normal distribution functions, respectively, and Tj* denotes the average optimal lifespan of patents in cohort j, calculated using the following formula.
(4)
(4)
where prtj denotes the proportion of patents whose lifespan is t in cohort j.
3.1.2. Patent renewal pattern fitting and prediction
The renewal-based approach relies on the fact that all patents in cohort j have lapsed. Since the Patent Law of the People’s Republic of China came into force on April 1, 1985, most invention patents have not expired. The patent renewal approach cannot estimate the value of these patents. Thus, we fit the patent renewal pattern of each cohort in which all the patents have lapsed. The results indicate that the renewal pattern of each cohort of patents fits well with the log-normal distribution function. Appendix A shows the detailed results. Therefore, we can use the theoretical distribution function of each cohort of patents whose lifespan cannot be observed so far, to predict their renewal probability at age t. The parameter of the distribution function can be estimated using the value of the parameter of the practical patent renewal distribution. We test the trend of mean and variance of patent renewal distribution from the 1985 to the 1999 cohort, finding a growing trend in the mean of patent renewal distribution, and no significant trend in the variance of distribution. Appendix B shows the detailed results. A tendency forecast helps estimate the mean of patent renewal distribution of each cohort including unexpired patents, and the average value of the variances of the 1985 to 1999 cohorts estimates the variance of the distribution.
Thus, the average value of patents in a particular cohort including unexpired patents can be estimated using the method proposed in section 3.1.
3.1.3. Measuring value of the individual patent
The value of an individual patent can be measured through a feature index constructed based on the lifespan information of each patent. We design three types of feature indices according to the characteristics of several patents, including lapsed patents, unexpired patents, and patents with short lifespans. We first convert the average optimal lifespan of patents from a yearly to a monthly basis,Footnote6 and then construct a feature index for the value of individual patents in each cohort according to the characteristics of each patent. Finally, we calculate the value of each patent based on different feature indices and the corresponding average value information.
Given that the lapsed patents’ lifespan information can be observed, the feature index of value for these patients can be constructed using the lifespan information of each patent directly. Let Inij denote the feature index of value for patent i in cohort j, Lij the lifespan of patent i in cohort j, and ALij the average optimal lifespan of patents in cohort j. The specific calculated formula of the feature index can be defined as follows.
(5)
(5)
The value of each patent in cohort j can be measured as below.
(6)
(6)
where Vij is the value of patent i in cohort j.
Since the lifespan information of unexpired patents cannot be observed, the construction of the feature index of value for these patents requires additional information, obtained from the IncoPat Global Patent Database (IGPD),Footnote7 with over 120 million pieces of patent information from 120 authorities, such as the patent offices of different countries and business vendors. Our patent data include the number of patent claims, simple patent families, extended patent families, international patent documentation families, the patent value degree (PVD) calculated by IGPD’s evaluation model, the mechanical stability of patent, the scope of patent (SOP) evaluated by IGPD, and so on. A correlation test examines the relevance between these factors and the lifespan of each lapsed patent. The results prove that PVD and SOP have a forward correlation with the lifespan of patents. Appendix C presents detailed results. We construct the feature index for the value of these patents based on their PVD and SOP information. First, the mean of the PVD and SOP are calculated to convert the data into a dimensionless form. Thereafter, the mean correlation coefficient of PVD, SOP, and lifespan of all patents is used to calculate the weight values of the two factors. Third, based on the weight value of the factors, the summary values of PVD and SOP of each patent are calculated as follows.
(7)
(7)
where Wij denotes the summary value of PVD and SOP of patent i in cohort j, wij* denotes the weight value of PVD or SOP of patent i, and Dij and Sij denote the dimensionless value of PVD or SOP of patent i. The feature index for the value of each patent is constructed through Wij and the value of the patents with the most extended life observed till now in cohort j. Since many patents have the same lifespan and there are multiple patents with the most extended lifespan in cohort j, we calculate the mean Waj of the value below the median of WmjFootnote8. Wmj denotes the sum weighted value of PVD and SOP of patents with the most extended lifespan observed in cohort j. The feature index for the value of the unexpired patents is found as follows.
(8)
(8)
where Vij* denotes the value of unexpired patents, and Vaj denotes the value of patents with the most observable lifespan in cohort j.
Patents with a relatively short lifespan have a relatively low economic valueFootnote9. To compensate for overestimating patent values, we adjust the value based on an additional feature index, illustrating the value of patents with a short lifespan more accurately. First, we calculate the average renewal rate and associated value of patents aged 1–6. Second, the values of patents aged 1–6 are adjusted. Third, we construct a feature index for each patent selected to calculate their value. The specific calculation formula is as follows.
(9)
(9)
where Vij° denotes the value of patents whose lifespan is below six in cohort j, Lij the lifespan of these patents on a monthly basis, Lstj the standard lifespan of patents at age t in cohort j on a monthly basis, and Vstj the value of patents whose lifespan is Lstj on a monthly basis.
3.2. Difference-in-differences estimation
The DID method estimates treatment effects, based on the data obtained from natural experiments, using modelling to effectively control prior differences between the research objects and effectively separate the accurate results of the treatment effects. Given its simplicity and its potential to circumvent endogeneity problems (Bertrand et al., Citation2004), we employ DID estimation to assess the impact of S&T Outline on patent value. Since the S&T Outline aims to improve the country’s overall innovation capability, we cannot define treatment and control groups with 0 and 1 only. Moreover, this policy affects different industries in varying degrees. F Non-patent-intensive industries are less dependent on patent innovation, and therefore less influenced by the S&T Outline (Kou & Liu, Citation2020). Here, patent intensity of an industry is a grouping variable. The quasi-DID model formula is as follows.
(10)
(10)
where Patentijt denotes the patent value of industry i from region j in 2012, Intensityi the intensity of patent value, and Policy06t the time dummy variable, if t ≥ 2006. Policy06 = 1, if t < 2006, Policy06 = 0. Intensityi*Policy06t is an interactive item for both variables. Intensityi divides the sample data into treatment (high patent intensity) and control (low patent intensity) groups. αi is the corresponding regression coefficient, and α1 is the DID estimator, indicating the net effect of the S&T Outline. ɛ is an error that accounts for the discrepancy between the predicted and observed data.
The DID model contains control variables and fixed effects. Industryi,t-1, and Regionj,t-1 are industrial and regional control variables, ηit is the industry-year fixed effect, and ηjt is the region-year fixed effect.
To confirm that all effects are caused by the S&T Outline implementation, we need to conduct the following robustness test.
Parallel trends test. In the absence of the S&T Outline, the difference between the treatment and control groups is constant over time. Here, we employ the event study introduced by Jacobson et al. (Citation1993) to conduct the parallel trends assumption. The test formula is as follows.
(11)
Placebo test. Even if the treatment and control groups have the same trend before S&T Outline is implemented, we need to identify whether other policies affect the simultaneously changing trend. A placebo test makes a regression estimate of the default treatment group or assumed policy time. According to Equationequation (10)
The influence factors are extracted from the statistics yearbook and listed in . The data are from China Statistical Yearbook 1990–2014, China Industry Statistical Yearbook 1990–2014, and China Statistical Yearbook on Science and Technology 1990–2014.
Table 1. Influence factors related to patent value.
3.3. Innovation correlation networks construction
This study constructs innovation correlation networks to describe the tendency of the policy to impact the patent value and compare the promotion effect before and after the release of the S&T Outline. The first step explores the relationship between the patent value of each region and the industry. Presently, different fields employ distance indicators to describe the relationship (Spelta & Araújo, Citation2012; Tola et al., Citation2008). Since the construction methods between regional and industrial innovation-related networks are similar, the formula for regional innovation correlation networks is as below.
(13)
(13)
where i and j represent different provinces, and Cij represents the correlation coefficients of two time series,
(i) and
(j) as follows.
(14)
(14)
Let patentpt represent the patent value of province p in year t and record it as The standardised patent value of each province is as follows.
(15)
(15)
where t represents the number of elements of the vector
which represents the number of years. p, q = 1, 2, …, N represent the sample provinces. Vectors
and
are standardised and substituted in Equationequation (14)
(14)
(14) . We obtain Cpq. This is substituted in Equationequation (13)
(13)
(13) , and we obtain the Euclidean distance between provinces p and q as follows.
(16)
(16)
The distance matrix D can be constructed based on Equationequation (16)(16)
(16) . Since the value of Cpq is [-1,1], the value range of dpq for each element in the distance matrix is [0,2]. The larger the Cpq value, the smaller is the corresponding dpq, indicating that the more consistent the changes in patent values between the two regions, the higher is the degree of correlation. When dpq=0, the patent values of the two places change in the same proportion and direction, and the degree of innovation connection between the two regions can be expressed by the reciprocal of distance (Spelta & Araújo, Citation2012).
(17)
(17)
where Qpq is the innovation correlation strength between provinces p and q. The strength matrix Q(p,q)=(Qpq)N×N comprising Qpq represents the spatial association network matrix of regional innovation. Each element of the network matrix determines the edge of the regional innovation-related network, and each region is the ‘point’ in the network. Together, these points and edges constitute the spatial association network of regional innovation in China. ForceAtlas2Footnote10 was used for network spatialisation.
4. Results
4.1. Estimation results of patent value
presents the final patent value estimates for the six cohorts. The estimates reveal that the distribution of patent values is severely skewed in each cohort. The median value is far below the mean value of firm patents from 1990 to 2013, and the value increases sharply with the quantile. For example, the mean value in 1990 was 102.6 thousand Yuan, approximately four times higher than the median value. This demonstrates a polarisation problem as few patents have a sharp competitive edge. The results indicate that patent counts are inadequate measures of technical creativity at firms because there is considerable heterogeneity among patents. Thus, it is challenging to employ number of patents to examine the causes and consequences of variation across groups while valuing innovation (Lanjouw et al., Citation1998). Hence, we use patent value as a measure of technical innovation performance to compensate for the deficiency of patent counts and investigate the trends and structure of patent development more accurately.
Table 2. Patent value distribution of firms, by quantile: 1990-2013.
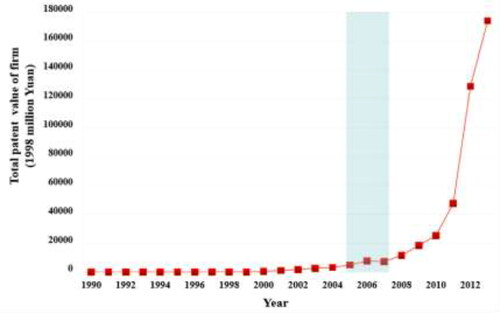
The scale of patent value is calculated for each application year to explore the trend of firm patent value at an aggregate level. The amount of patent value has increased and become steeper in recent times (). Estimated at 173930.1 million yuan in 2013, the total patent value is 4411.1 times higher than that in 1990. The average growth rate of the scale of patent value during 1990–2006 was 44.73%, and during 2006–2013 was 62.20%, reflecting the rapid progress of technical innovation during later periods. The growth rate of the amount of patent value witnessed a dramatic increase around 2007, a possible result of a one-year lag of stimulation by the 2006 innovative policy.
Figure 1. Trend of the scale of patent value for firms over time.
Source: Authors.
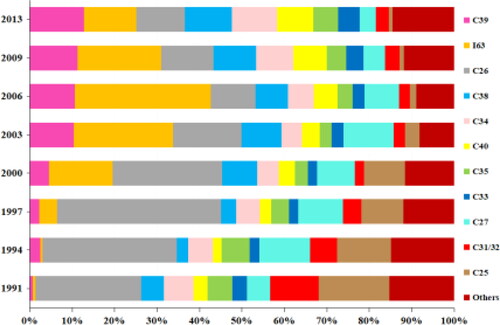
The industry-level patent value is calculated at an interval of three or four years to investigate their relative importance (). The share of Manufacture of Chemical Raw Material and Chemical Products (C26) and Processing of Petroleum, Coking, and Other Fuels (C25) have occupied leading positions during the years, followed by Mining of Ferrous Metal Ores or Non-ferrous Metal Ores (C31/32) and Manufacture of Medicines (C27), experiencing a gradual decrease. Other industries, such as the share of Service of Telecommunications, Radio, Television and Satellite Transmission (I63), Manufacture of Communication, Computer, Other Electronic Equipment (C39), Manufacture of Electrical Machinery and Equipment (C38), Manufacture of General Purpose Machinery (C34) show a continuous uptrend. By 2013, the Manufacture of Communication, Computer, and other Electronic Equipment (C39) became the largest industry with a share of 12.7%, followed by Services of Telecommunications, Radio, Television, and Satellite Transmission (I63) (12.4% share), and Manufacture of Chemical Raw Material and Chemical Products (C26), Manufacture of Electrical Machinery and Equipment (C38), and Manufacture of General Purpose Machinery (C34), with shares of 11.4%, 11.1%, and 10.8%, respectively. Although the share of Service of Telecommunications, Radio, Television, and Satellite Transmission (I63) decreases relative to other industries’ increase, the scale of patent value in this industry has burgeoned, with a fast-annual growth rate of 50.4% during 2006–2013. These reflect the change in the industrial structure of firms’ innovative activities.
Figure 2. Share of each industry in total patent value of firms (%).
Source: Authors.
From the regional distribution perspective, the scale of the patent value of 31 regions is estimated in , displaying a sharp unevenness. There is a dense concentration of the amount of patent value in the eastern coastal strip in 2000, especially in Beijing, Guangdong, Shanghai, Jiangsu, and Shandong, with average shares of 31.8%, 21.5%, 11.2%, 6.4%, and 5.7%, respectively. However, the total share in another region is less than 30%, and in Chongqing, Ningxia, Guizhou, and Qinghai, in the western region, it is less than 0.3%.
Figure 3. Share of regions in the total patent value of firms (unit: million yuan).
Source: Authors.
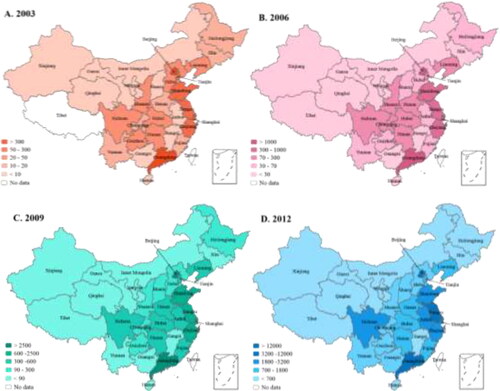
Thus, there is a substantial regional disparity in technical innovation capacity in China, and the economically developed provinces display intense patent creativity. This inequality is first, due to resource concentration at the state level, leading to higher patent values in developed areas and second, due to the presence of knowledge-based industries driven by patent resources facilitating demand.
4.2. DID Estimation and robustness analysis
summarises the results of the DID analysis for the S&T Outline effect. The mean variance inflation factors (VIF) for models 1–4 is all less than 10 (VIF exceeding 10 indicates a high possibility of severe multicollinearity and the necessity of correction and modification). We employ robust standard errors to control heteroscedasticity.
Table 3. Results of DID analysis for the S&T Outline effect.
In terms of ‘DID factors’, when the intensity of invention patents in the industry, dummy variable of S&T Outline, and the interaction term of the two–representative coefficients evaluate the implementation effect of S&T Outline, exerting a significant positive effect. This reflects the enhancement of the patent value of Chinese firms on an average, due to the S&T Outline. In Model 1, the two coefficients and their interaction terms obtained statistical significance at a confidence of 10%. However, after controlling for all kinds of industrial and regional variables, the significance of interaction items increases, reaching a 1% significance level in Model 4. This proves that the development of the intensity of invention patents in the industry is due to the implementation of the S&T Outline. A series of cases illustrate the promotion effect symbolised by the intensity of invention patents, for example, the average absolute value of growing 1% for the patent value of I63 in 2006 and later is 63173.3 thousand Yuan, while in industries like A02 with lower intensity of invention patents, the average absolute value of growing 1% is only 26.8 thousand yuanFootnote11.
From the industry characteristics perspective, the level of industry assets and the allocation of R&D resources are the key factors that affect patent value in China. Assets provide a simplified view of the economic resources, laying the corporate-level foundation of patent development. R&D resources give companies a simple to measure expenditure and personnel input, and they generally compromise the knowledge basis of patent development. Industries’ good assets and strong R&D support play a dominant role in patent value enhancement.
Besides, the regional economic level, structure, and allocation of R&D resources provide insights into patent value in China. The parameter estimation results in Model 4 illustrate that the proportion of industrial added value in a region is significantly higher than that of regional GDP. From a statistical point of view, the catalytic effect of the economic development structure on patent value enhancement is higher than that of overall economic growth because in Model 4, two aggregate indicators weaken the significance of regional GDP to a certain extent at the same time. These are the assets at the industry level and the economy at the regional level. Furthermore, the effect of regional R&D resource allocation on patent value and related mechanisms is like that at the industry level.
Models 1–4 support the above conclusion, verifying the study’s robustness.
From Models 1–4 in , the S&T Outline adds more favourable momentum to the promotion of the invention patent value of firms in high patent-intensive industries than in low patent-intensive industries. This may only be because it captures the industry differences that existed before the implementation of this policy. Before 2006, the growth rate of patent applications in high-patent-intensive industries was considerably higher than that in low patent-intensive industries.
The parallel trend test in Equationequation (11)(11)
(11) examines the applicability of DID. Using 1990 as the base period for the sample and the patent value as the explained variable, we conduct a regression analysis, and find that the coefficient of αk before 2006 is not significant at 5% confidence. It only becomes significantly positive post 2006. Further, the coefficient increases year after year, indicating that the parallel trend test passes and that the effect of the S&T Outline on innovation promotion in China is increasing.
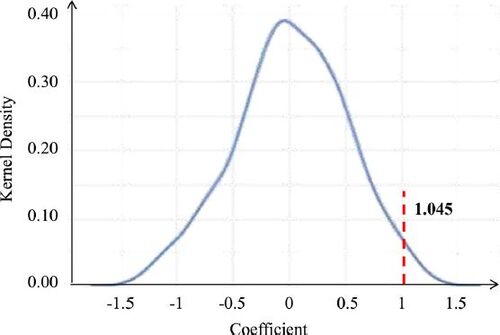
Further, we cannot control some unobservable and time-variant industrial or regional characteristics in the present model. Thus, the placebo test was carried out as per Li et al. (Citation2016) to indirectly evaluate the existence and effect of omitted variables. Bootstrap sampling is employed to repeat 1000 times, and the figure of kernel density illustrates the ‘wrong’ estimation coefficient As shown in , the coefficient obeys the normal distribution, and the mean value is close to 0 (far less than the real value 1.045). Thus, β = 0 is supported, and the omitted variables of the industry and regions do not affect the conclusions.
Figure 4. Placebo test for the DID model. It shows the distribution of ‘wrong’ estimation coefficients after 1000 placebo tests; the vertical dashed line indicates the ‘correct’ estimation coefficients.
Source: Authors.
4.3. Innovation networks before and after the publication of S&T outline
Here, we measure the innovation output based on the patent value at both the region and industry levels, and the innovation networks from 2001–2005 and 2006–2010 are visualised in view of ForceAtlas2. From 2001–2005, the publication of the S&T Outline was still in progress, and from 2006–2010, it had been implemented.
4.3.1. Regional innovation networks
The regional innovation network is divided into four parts (, corresponding to different colours), and the overall pattern shows a development trend of ‘gathering’.
Figure 5. The regional innovation networks from 2001–2005 and 2006–2010. The circle size indicates the scale of patent value.
2001–2005: before the publication of S&T Outline
2006-–2010: after the publication of S&T Outline.
Source: Authors.
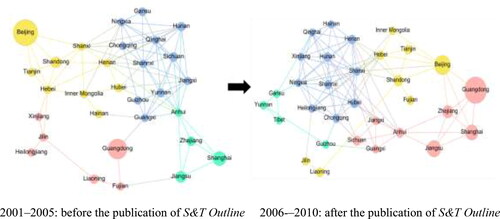
Before the publication of the S&T Outline, the patent value of Beijing and Guangdong was superior to other provinces due to landslides, and each promoted the innovation development of neighbouring provinces (, left). Beijing, as a representative region of the innovation network, expanded its radiation scope to the west and north of China. As a hub, it facilitates business transactions in Tianjin, Shandong, Shanxi, and other geographically adjacent regions, and connects the innovation network of the western region through Shanxi and the northeast region through Hebei. Similarly, the Guangdong Innovation Center plays a central role in the development of a wide radiation range in the eastern coastal areas of China. Guangdong establishes an innovation network across Fujian, Guangxi, and the delta region along the Pearl River Delta, connecting the network of the Yangtze River Delta.
After the publication of the S&T Outline, the patent value of Guangdong and Beijing continue at the forefront nationwide, and the consolidation of the relationship chain with other provinces improves with increased coordination degrees of innovative development (, right). Beijing has broken through geographical limits and constructed a new relationship chain integrated with Guangdong, Shanghai, and Zhejiang. Thus, Beijing has expanded its geographical reach from the northern innovation network to the Yangtze River Delta, Pearl River Delta, and other economically developed regions. The patent value of Shanghai, Jiangsu, Zhejiang, and other regions also increases rapidly, and the gap between their patent values and those of Guangdong and Beijing narrows.
Furthermore, the total patent value of Beijing and Guangdong is very high, but their degree centrality is lower than those of Shanxi, Henan, and Shaanxi, with lower patent values from 2001–2005. After the publication of the S&T Outline, the degree centrality of provinces with high patent value increases, but with a significant disparity with provinces with low patent value indicating that the S&T Outline has effectively promoted innovation levels and the degree of coordination of innovation in each province. However, for provinces with high innovation levels, such as Guangdong and Beijing, the roles and values in the innovation network have not been fully stimulated and released.
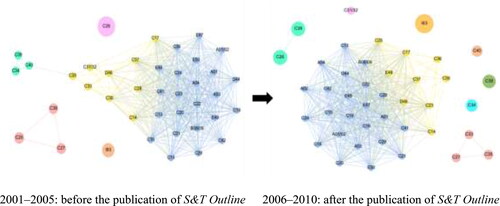
4.3.2. Industrial innovation correlation networks
The industrial innovation correlation network is different from the regional one because the overall pattern of the network presents a development trend of ‘decentralisation’ (), possibly due to the guidance of the policy. The S&T Outline stipulates that the key areas and priority themes for S&T development in China focus on the information, modern service, and manufacturing industries, all highly patent-intensive. This policy promotes patent value levels in some industries. However, it ignores the innovation development of industries with low patent density, leading to an ever-widening gap in innovation levels among industries. Before the publication of S&T Outline, the two industries, C26 and I63, were independent of the innovation network; C25, C27, and C38 formed innovation correlations by themselves; the remaining industries formed an innovation correlation network. After the publication of the S&T Outline, the number of industries independent of the innovation correlation network increased from two to five. These include C31/32, C34, C38, C40, and I63. C27, C35, and C33 formed innovation correlations; C26 and C39 formed a relationship chain; the remaining industries formed an innovation correlation network.
Figure 6. Industrial innovation networks from 2001–2005 and 2006-–2010. The circle size indicates the scale of patent value. The detailed explanation of specific industry codes is presented in Appendix D.
2001–2005: before the publication of S&T Outline
2006–2010: after the publication of S&T Outline.
Source: Authors.
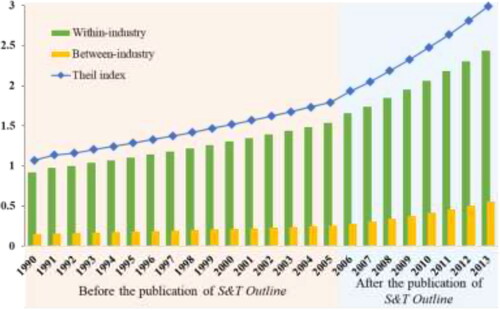
The trend of the Theil index of firm-level patent values from 1990–2013 illustrates that the disparity in innovation level among firms is expanding. The increase in disparity after the publication of the S&T Outline shows an upward trend (). Before its publication, the annual growth rate of the Theil index was 3.28%, while after, it grew to 5.86%. After the Theil index decomposition, innovation inequality within industry takes the central part, accounting for more than 80% while innovation inequality among industries accounts for less than 20%. We note that innovation inequality among industries has increased significantly since the publication of the S&T Outline, and its inequality proportion increased rapidly from 14.27% in 2005 to 18.60% in 2010.
Figure 7. Theil indexes and its decomposition-indexes (within-industry and between-industry) from 1990–2013.
Source: Authors.
5. Conclusion
This study evaluates the effect of innovation policy in China and innovation catching-up on the technological innovation performance of firms. Unlike most literature, we focus on patent value as a measure of innovation output, instead of patent counts. Based on the IGPD data, the firm-level analysis comprises more than 700,000 patents, from 1985–2013.
After the proposal of CPVM, which is extended by the traditional patent renewal model and several feature indexes, we estimate the economic value of each patent more precisely and find that the value is skewed and distributed among patents. This suggests that the indicator of patent counts alone does not fully explain the uneven distribution of technological innovation output. Besides, the amount of firm patent value is found to multiply, estimated at 173930.1 million yuan in 2013, appropriately 4411 times higher than in 1990. Accordingly, the scale of patent value of high-tech industries experienced significant development, such as I63 and C39, with an average annual growth of 47.4% and 49.2%, respectively. Moreover, there is a wide disparity in regional technological innovation in China. The scale of patent value of Beijing, Guangdong, Shanghai, and Jiangsu, the top four, jointly contribute more than 65% of the total patent value in 2013.
Considering that the S&T Outline, promulgated and implemented in 2006, is one of the most critical innovation policies introduced in the past decades, this study uses the quasi-DID model to identify its impact on the patent value of China. The well-designed operation of S&T Outline promotion significantly improved the innovation performance of firms concerning patent value and was more conducive to the promotion of patent value in invention-patent-intensive industries. Thus, there were different policy effects for industries with various patent densities. From the patent quality standpoint, the S&T Outline does not fully strengthen the country’s innovation capacity in industries, especially for industries with low patent intensity. We need to understand and grasp the organic balance between the growth in the quantity of patents and the improvement of the patent quality.
We construct innovation correlation networks to visualise and compare the significant promotion effect before and after the release of the S&T Outline. There is a significant disparity in the development trends between regional and industrial networks. Regional networks have a gathering tendency after the operation of the S&T Outline, while industrial networks have a decentralising tendency.
At the regional level, Beijing and Guangdong both have high patent values, while their ties with other provinces are less than some areas with low patent value. There is an imbalance between the accumulation of patent value and the coordination of the regions, and the collection of patent quality among regions lacks mutual coordination. Therefore, the maximum use of the cooperation mechanism, the efficient sharing of innovation resources, and the effective implementation of patent activities within and between areas are encouraged.
At the industrial level, the worsening inequality in patent value has been ongoing and becoming more severe after the release of the S&T Outline. Industries that are growing substantially have a higher patent value. The patent values of I63, C26, and C39 account for about 47.50% from 2006–2010. Thus, top-level policy design is essential to balance the development of innovation capacity between high and low-patent-intensity industries. Policymakers should provide favourable patent subsidy industries with lower patent values.
Disclosure statement
No potential conflict of interest was reported by the authors.
Additional information
Funding
Notes
1 Data source: China National Intellectual Property Administration. http://www.sipo.gov.cn/zscqgz/1146679.htm.
2 Data source: Intellectual Property and U.S. Economy: 2016 Update. https://www.uspto.gov/sites/default/files/documents/IPandtheUSEconomySept2016.pdf.
3 ‘Noise’ is defined as the unexplained variation found within the number of patents.
4 We define each application year as a cohort.
5 The principle of derivation is similar to that in Schankerman and Pakes (Citation1986).
6 Since the range of lifespan on a monthly basis is from 12 to 240 and the range of lifespan on a yearly basis is from 1 to 24, using lifespan on a monthly basis to reveal the characteristic of patents can capture their differences more accurately.
8 Since renewal-based approach assumes that patents with long lifespan are more valuable than those with short lifespan, we must ensure that the Wij of unexpired patents is greater than lapsed patents.
9 Since the max lifespan of invention patents in China is 20 years, and for most invention patents, it takes a long time to grant, we define the range of short lifespan is from 1 to 6 years.
10 ForceAtlas2 is a force-directed layout close to other algorithms used for network spatialization.
11 Absolute value of growing 1% = The value of base period/100.
References
- Ahuja, G., & Katila, R. (2001). Technological acquisitions and the innovation performance of acquiring firms: A longitudinal study. Strategic Management Journal, 22(3), 197–220. https://doi.org/10.1002/smj.157
- Asheim, B., Boschma, R., & Cooke, P. (2011). Constructing regional advantage: Platform policies based on related variety and differentiated knowledge bases. Regional Studies, 45(7), 893–904. https://doi.org/10.1080/00343404.2010.543126
- Audretsch, D. B., Bonte, W., & Keilbach, M. (2008). Entrepreneurship capital and its impact on knowledge diffusion and economic performance. Journal of Business Venturing, 23(6), 687–698. https://doi.org/10.1016/j.jbusvent.2008.01.006
- Beaudry, C., & Schiffauerova, A. (2011). Impacts of collaboration and network indicators on patent quality: The case of Canadian nanotechnology innovation. European Management Journal, 29(5), 362–376. https://doi.org/10.1016/j.emj.2011.03.001
- Bellamy, M. A., Ghosh, S., & Hora, M. (2014). The influence of supply network structure on firm innovation. Journal of Operations Management, 32(6), 357–373. https://doi.org/10.1016/j.jom.2014.06.004
- Beneito, P. (2006). The innovative performance of in-house and contracted R&D in terms of patents and utility models. Research Policy, 35(4), 502–517. https://doi.org/10.1016/j.respol.2006.01.007
- Bertrand, M., Duflo, E., & Mullainathan, S. (2004). How much should we trust differences-in-differences estimates? The Quarterly Journal of Economics, 119(1), 249–275. https://doi.org/10.1162/003355304772839588
- Bessen, J. (2008). The value of U.S. patents by owner and patent characteristics. Research Policy, 37(5), 932–945. https://doi.org/10.1016/j.respol.2008.02.005
- Bessen, J. (2009). Estimates of patent rents from firm market value - ScienceDirect. Research Policy, 38(10), 1604–1616. https://doi.org/10.1016/j.respol.2009.09.014
- Blanco, F. A., Delgado, F. J., & Presno, M. J. (2020). R&D expenditure in the EU: Convergence or divergence? Economic research-Ekonomska Istraživanja, 33(1), 1685–1710. https://doi.org/10.1080/1331677X.2020.1756371
- Breschi, S., & Lissoni, F. (2009). Mobility of skilled workers and co-invention networks: An anatomy of localized knowledge flows. Journal of Economic Geography, 9(4), 439–468. https://doi.org/10.1093/jeg/lbp008
- Bronzini, R., & Piselli, P. (2016). The impact of R&D subsidies on firm innovation. Research Policy, 45(2), 442–457. https://doi.org/10.1016/j.respol.2015.10.008
- Brouwer, E., & Kleinknecht, A. (1999). Innovative output, and a firm’s propensity to patent: An exploration of CIS micro data. Research Policy, 28(6), 615–624. https://doi.org/10.1016/S0048-7333(99)00003-7
- Cao, C., Suttmeier, R. P., & Simon, D. F. (2006). China’s 15-year science and technology plan. Physics Today, 59(12), 38–43. https://doi.org/10.1063/1.2435680
- Cappelen, A., Raknerud, A., & Rybalka, M. (2012). The effects of R&D tax credits on patenting and innovations. Research Policy, 41(2), 334–345. https://doi.org/10.1016/j.respol.2011.10.001
- Carlsson, B., Jacobsson, S., Holmen, M., & Rickne, A. (2002). Innovation systems: Analytical and methodological issues. Research Policy, 31(2), 233–245. https://doi.org/10.1016/S0048-7333(01)00138-X
- Castellacci, F., & Lie, C. M. (2015). Do the effects of R&D tax credits vary across industries? A meta-regression analysis. Research Policy, 44(4), 819–832. https://doi.org/10.1016/j.respol.2015.01.010
- Chen, T. C., Guo, D. Q., Chen, H. M., & Wei, T. T. (2019). Effects of R&D intensity on firm performance in Taiwan's semiconductor industry. Economic research-Ekonomska Istraživanja, 32(1), 2377–2392. https://doi.org/10.1080/1331677X.2019.1642776
- Chen, C., Huang, Y., & Lin, B. (2012). How firms innovate through R&D internationalization? An S-curve hypothesis. Research Policy, 41(9), 1544–1554. https://doi.org/10.1016/j.respol.2012.06.008
- Choe, H., & Lee, D. H. (2017). The structure and change of the research collaboration network in Korea (2000-2011): Network analysis of joint patents. Scientometrics, 111(2), 917–939. https://doi.org/10.1007/s11192-017-2321-2
- Czarnitzki, D., Hanel, P., & Rosa, J. M. (2011). Evaluating the impact of R&D tax credits on innovation: A microeconometric study on Canadian firms. Research Policy, 40(2), 217–229. https://doi.org/10.1016/j.respol.2010.09.017
- Dang, J., & Motohashi, K. (2015). Patent statistics: A good indicator for innovation in China? Patent subsidy program impacts on patent quality. China Economic Review, 35, 137–155. https://doi.org/10.1016/j.chieco.2015.03.012
- Danguy, J. (2016). Globalization of innovation production: A patent-based industry analysis. Science and Public Policy, 44(1), 75–94. https://doi.org/10.1093/scipol/scw025
- Danish, M. S., Ranjan, P., & Sharma, R. (2020). Valuation of patents in emerging economies: A renewal model-based study of Indian patents. Technology Analysis & Strategic Management, 32(4), 457–473. https://doi.org/10.1080/09537325.2019.1668552
- De Rassenfosse, G., Dernis, H., Guellec, D., Picci, L., & La Potterie, B. V. P. D. (2013). The Worldwide count of priority patents: A new indicator of inventive activity. Research Policy, 42(3), 720–737. https://doi.org/10.1016/j.respol.2012.11.002
- Deng, Y. (2011). A dynamic stochastic analysis of international patent application and renewal processes. International Journal of Industrial Organization, 29(6), 766–777. https://doi.org/10.1016/j.ijindorg.2011.04.004
- Dimos, C., & Pugh, G. (2016). The effectiveness of R&D subsidies: A meta-regression analysis of the evaluation literature. Research Policy, 45(4), 797–815. https://doi.org/10.1016/j.respol.2016.01.002
- Ernst, D. (2011). China’s innovation policy is a wake-up call for America. Asia Pacific Issues, 100(5), 1–12.
- Foremanpeck, J. (2013). Effectiveness and efficiency of SME innovation policy. Small Business Economics, 41(1), 55–70.
- Forsman, H. (2011). Innovation capacity and innovation development in small enterprises. A comparison between the manufacturing and service sectors. Research Policy, 40(5), 739–750. https://doi.org/10.1016/j.respol.2011.02.003
- Fujiwara, Y., & Aoyama, H. (2010). Large-scale structure of a nation-wide production network. European Physical Journal B – Condensed Matter, 77(4), 565–580.
- Gambardella, A. (2013). The economic value of patented inventions: Thoughts and some open questions. International Journal of Industrial Organization, 31(5), 626–633. https://doi.org/10.1016/j.ijindorg.2013.02.007
- Garcia, R. (2005). Uses of agent-based modeling in innovation/new product development research†. Journal of Product Innovation Management, 22(5), 380–398. https://doi.org/10.1111/j.1540-5885.2005.00136.x
- Griliches, Z. (1990). Patent statistics as economic indicators: A survey. Journal of Economic Literature, 28(4), 287–343.
- Griliches, Z. (1998). R&D and productivity — The econometric evidence. University of Chicago Press.
- Hoetker, G. (2005). How much you know versus how well I know you: Selecting a supplier for a technically innovative componen. Strategic Management Journal, 26(1), 75–96. https://doi.org/10.1002/smj.453
- Hsieh, C. (2013). Patent value assessment and commercialization strategy. Technological Forecasting and Social Change, 80(2), 307–319. https://doi.org/10.1016/j.techfore.2012.09.014
- Hsu, C., Lien, Y., & Chen, H. (2015). R&D internationalization and innovation performance. International Business Review, 24(2), 187–195. https://doi.org/10.1016/j.ibusrev.2014.07.007
- Huang, K.-F., Lin, K.-H., Wu, L.-Y., & Yu, P.-H. (2015). Absorptive capacity and autonomous R&D climate roles in firm innovation. Journal of Business Research, 68(1), 87–94. https://doi.org/10.1016/j.jbusres.2014.05.002
- Hu, J., Huang, Q., & Chen, X. (2020). Environmental regulation, innovation quality and firms’ competitivity-Quasi-natural experiment based on China’s carbon emissions trading pilot. Economic research-Ekonomska Istraživanja, 33(1), 3307–3333. https://doi.org/10.1080/1331677X.2020.1771745
- Hu, A. G., & Jefferson, G. H. (2009). A great wall of patents: What is behind China's recent patent explosion? Journal of Development Economics, 90(1), 57–68. https://doi.org/10.1016/j.jdeveco.2008.11.004
- Hwang, J. T., Kim, B. K., & Jeong, E. S. (2021). Patent value and survival of patents. Journal of Open Innovation: Technology, Market, and Complexity, 7(2), 119. https://doi.org/10.3390/joitmc7020119
- Inoue, H., Souma, W., & Tamada, S. (2010). Analysis of cooperative research and development networks on Japanese patents. Journal of Informetrics, 4(1), 89–96. https://doi.org/10.1016/j.joi.2009.09.002
- Jacobson, L. S., Lalonde, R. J., & Sullivan, D. (1993). Earnings losses of displaced workers. American Economic Review, 83(4), 685–709.
- Kleinknecht, A., Montfort, K. v., & Brouwer, E. (2002). The non-trivial choice between innovation indicators. Economics of Innovation and New Technology, 11(2), 109–121. https://doi.org/10.1080/10438590210899
- Kou, Z., & Liu, X. (2020). On patenting behavior of chinese firms: stylized facts and effects of innovation policy. Economic Research Journal, 55(3), 83–99.
- Lahiri, N. (2010). Geographic distribution of R&D activity: How does it affect innovation quality? Academy of Management Journal, 53(5), 1194–1209. https://doi.org/10.5465/amj.2010.54533233
- Lanjouw, J. O. (1998). Patent protection in the shadow of infringement: Simulation estimations of patent value. The Review of Economic Studies, 65(4), 671–710.
- Lanjouw, J. O., Pakes, A., & Putnam, J. (1998). How to count patents and value intellectual property: The uses of patent renewal and application data. Journal of Industrial Economics, 46(4), 405–432. https://doi.org/10.1111/1467-6451.00081
- Lawryshyn, Y., Collan, M., Luukka, P., & Fedrizzi, M. (2017). New procedure for valuing patents under imprecise information with a consensual dynamics model and a real options framework. Expert Systems with Applications, 86, 155–164. https://doi.org/10.1016/j.eswa.2017.05.056
- Layne-Farrar, A., & Lerner, J. (2011). To join or not to join: Examining patent pool participation and rent sharing rules. International Journal of Industrial Organization, 29(2), 294–303. https://doi.org/10.1016/j.ijindorg.2010.08.006
- Lee, S. M., & Trimi, S. (2018). Innovation for creating a smart future. Journal of Innovation & Knowledge, 3(1), 1–8. https://doi.org/10.1016/j.jik.2016.11.001
- Leydesdorff, L., & Vaughan, L. (2006). Co-occurrence matrices and their applications in information science: Extending ACA to the Web environment. Journal of the Association for Information Science and Technology, 57(12), 1616–1628.
- Li, X. (2012). Behind the recent surge of Chinese patenting: An institutional view. Research Policy, 41(1), 236–249. https://doi.org/10.1016/j.respol.2011.07.003
- Li, P., Lu, Y., & Wang, J. (2016). Does flattening government improve economic performance? Evidence from China. Journal of Development Economics, 123(123), 18–37. https://doi.org/10.1016/j.jdeveco.2016.07.002
- Ma, Z., Lee, Y., & Chen, C. P. (2009). Booming or emerging? China’s technological capability and international collaboration in patent activities. Technological Forecasting and Social Change, 76(6), 787–796. https://doi.org/10.1016/j.techfore.2008.11.003
- Mai, A. N., Vu, H. V., Bui, B. X., & Tran, T. Q. (2019). The lasting effects of innovation on firm profitability: Panel evidence from a transitional economy. Economic research-Ekonomska Istraživanja, 32(1), 3417–3430. https://doi.org/10.1080/1331677X.2019.1660199
- Mairesse, J., & Mohnen, P. (2004). The importance of R&D for innovation: A reassessment using french survey data. The Journal of Technology Transfer, 30(1–2), 183–197. https://doi.org/10.1007/s10961-004-4365-8
- Montmartin, B., & Herrera, M. (2015). Internal and external effects of R&D subsidies and fiscal incentives: Empirical evidence using spatial dynamic panel models. Research Policy, 44(5), 1065–1079. https://doi.org/10.1016/j.respol.2014.11.013
- Murray, F. (2002). Innovation as co-evolution of scientific and technological networks: Exploring tissue engineering. Research Policy, 31(8–9), 1389–1403. https://doi.org/10.1016/S0048-7333(02)00070-7
- Negassi, S., & Sattin, J. (2019). Evaluation of Public R&D Policy: A Meta-Regression Analysis. Technology and Investment, 10(01), 1–29. https://doi.org/10.4236/ti.2019.101001
- Nilsson, S., & Ritzen, S. (2014). Exploring the use of innovation performance measurement to build innovation capability in a medical device company. Creativity and Innovation Management, 23(2), 183–198. https://doi.org/10.1111/caim.12054
- OECD. (2003). Tax incentives for research and development: Trends and issues. OECD.
- Pakes, A. (1986). Patents as options: Some estimates of the value of holding European patent stocks. Econometrica, 54(4), 755–784. https://doi.org/10.2307/1912835
- Pakes, A., & Schankerman, M. (1984). The rate of obsolescence of patents, research gestation lags, and the private rate of return to research resources (R&D, Patents, and Productivity) (pp. 73–88). National Bureau of Economic Research. https://EconPapers.repec.org/RePEc:nbr:nberch:10045
- Park, G., & Park, Y. (2006). On the measurement of patent stock as knowledge indicators. Technological Forecasting and Social Change, 73(7), 793–812. https://doi.org/10.1016/j.techfore.2005.09.006
- Pyka, A. (2002). Innovation networks in economics: From the incentive‐based to the knowledge‐based approaches. European Journal of Innovation Management, 5(3), 152–163. https://doi.org/10.1108/14601060210436727
- Radicic, D., Pugh, G., Hollanders, H., Wintjes, R., & Fairburn, J. (2016). The impact of innovation support programmes on SME innovation in traditional manufacturing industries: An evaluation for seven EU regions. Environment and Planning C: Government and Policy, 34(8), 1425–1452. https://doi.org/10.1177/0263774X15621759
- Rahmandad, H., & Sterman, J. D. (2008). Heterogeneity and network structure in the dynamics of diffusion: Comparing agent-based and differential equation models. Management Science, 54(5), 998–1014. https://doi.org/10.1287/mnsc.1070.0787
- Ribeiro, B., & Shapira, P. (2020). Private and public values of innovation: A patent analysis of synthetic biology. Research Policy, 49(1), 103875. https://doi.org/10.1016/j.respol.2019.103875
- Sandstrom, A., & Carlsson, L. (2008). The performance of policy networks: The relation between network structure and network performance. Policy Studies Journal, 36(4), 497–524. https://doi.org/10.1111/j.1541-0072.2008.00281.x
- Savin, I., & Egbetokun, A. (2016). Emergence of innovation networks from R&D cooperation with endogenous absorptive capacity. Journal of Economic Dynamics and Control, 64, 82–103. https://doi.org/10.1016/j.jedc.2015.12.005
- Schankerman, M., & Pakes, A. (1986). Estimates of the value of patent rights in European countries during the post-1950 period. The Economic Journal, 96(384), 1052–1076. https://doi.org/10.2307/2233173
- Schilling, M. A., & Phelps, C. (2007). Interfirm collaboration networks: The impact of large-scale network structure on firm innovation. Management Science, 53(7), 1113–1126. https://doi.org/10.1287/mnsc.1060.0624
- Seddighi, H. R., & Mathew, S. (2020). Innovation and regional development via the firm’s core competence: Some recent evidence from North East England. Journal of Innovation & Knowledge, 5(4), 219–227. https://doi.org/10.1016/j.jik.2019.12.005
- Skm, A., & Ab, B. (2020). External knowledge modes and firm-level innovation performance: Empirical evidence from sub-Saharan Africa. Journal of Innovation & Knowledge, 5(2), 81–95.
- Spelta, A., & Araújo, T. (2012). The topology of cross-border exposures: Beyond the minimal spanning tree approach. Physica A: Statistical Mechanics and Its Applications, 391(22), 5572–5583. https://doi.org/10.1016/j.physa.2012.05.071
- Sternitzke, C., Bartkowski, A., & Schramm, R. (2008). Visualizing patent statistics by means of social network analysis tools. World Patent Information, 30(2), 115–131. https://doi.org/10.1016/j.wpi.2007.08.003
- Straub, D. W., Rai, A., & Klein, R. G. (2004). Measuring firm performance at the network level: A nomology of the business impact of digital supply networks. Journal of Management Information Systems, 21(1), 83–114. https://doi.org/10.1080/07421222.2004.11045790
- Tola, V., Lillo, F., Gallegati, M., & Mantegna, R. N. (2008). Cluster analysis for portfolio optimization. Journal of Economic Dynamics and Control, 32(1), 235–258. https://doi.org/10.1016/j.jedc.2007.01.034
- Tomasz, K., & Arkadiusz, K. (2019). Is innovation the key to solving the productivity paradox? Journal of Innovation & Knowledge, 4(4), 219–225.
- Tukoff-Guimarães, Y. B., Kniess, C. T., Penha, R., & Ruiz, M. S. (2021). Patents valuation in core innovation: Case study of a Brazilian public university Patents valuation in core innovation. Innovation & Management Review, 18(1), 34–50. https://doi.org/10.1108/INMR-03-2019-0027
- Verhoeven, D., Bakker, J., & Veugelers, R. (2016). Measuring technological novelty with patent-based indicators. Research Policy, 45(3), 707–723. https://doi.org/10.1016/j.respol.2015.11.010
- Von Wartburg, I., Teichert, T., & Rost, K. (2005). Inventive progress measured by multi-stage patent citation analysis. Research Policy, 34(10), 1591–1607. https://doi.org/10.1016/j.respol.2005.08.001
- Watanabe, C., Tsuji, Y. S., & Griffy-Brown, C. (2001). Patent statistics: Deciphering a ‘real’ versus a ‘pseudo’ proxy of innovation. Technovation, 21(12), 783–790. https://doi.org/10.1016/S0166-4972(01)00025-6
- World Intellectual Property Organization. (2012). World Intellectual Property Indicator 2012. https://www.wipo.int/publications/en/series/index.jsp?id=37#:∼:text=WIPO%27s%20World%20Intellectual%20Property%20Indicators%202012%20provides%20a,IP%20offices%2C%20WIPO%2C%20the%20World%20Bank%20and%20UNESCO.
- Yang, G., Li, G., Li, C., Zhao, Y., Zhang, J., Liu, T., Chen, D., & Huang, M. (2015). Using the comprehensive patent citation network (CPC) to evaluate patent value. Scientometrics, 105(3), 1319–1346. https://doi.org/10.1007/s11192-015-1763-7
- Yeo, B. (2019). What drives university technological innovation outcomes? A re-vitalised investigation. Journal of Information & Knowledge Management, 18(03), 1950035–1950028. https://doi.org/10.1142/S0219649219500357
- Yoon, B., & Park, Y. (2004). A text-mining-based patent network: Analytical tool for high-technology trend. The Journal of High Technology Management Research, 15(1), 37–50. https://doi.org/10.1016/j.hitech.2003.09.003
- Zanghelini, F., & Andrade, C. (2015). Effectiveness evaluation of public policy incentive R&D in technological innovation in Brazil: A focus on law of the well. Revista de Ciencias Farmaceuticas Basica e Aplicada, 36(3), 349–358.
- Zeebroeck, N. V. (2011). The puzzle of patent value indicators. Economics of Innovation and New Technology, 20(1), 33–62.
- Zhang, G., Lv, X., & Zhou, J. (2014). Private value of patent right and patent infringement: An empirical study based on patent renewal data of China. China Economic Review, 28, 37–54. https://doi.org/10.1016/j.chieco.2013.11.004
Appendix A
Table A K-S test of patent renewal pattern fitting effects.
Appendix B
Table B1. Trend test of patent renewal distribution’ mean.
Table B2. Trend test of patent renewal distribution’ variance.
Appendix C
Table C. Pearson's correlation coefficient between lifespan and PVD, SOP of patent.
Appendix D
Table D1. Provinces in China.
Table D2. Industrial Sectors in China.