
 ?Mathematical formulae have been encoded as MathML and are displayed in this HTML version using MathJax in order to improve their display. Uncheck the box to turn MathJax off. This feature requires Javascript. Click on a formula to zoom.
Abstract
This article examines institutional investors' investment activities and the impact of their trading styles on market volatility amidst COVID-19 in India. Specifically, it seeks to offer a comprehensive analysis of foreign portfolio investors’ (FPIs) and domestic mutual fund managers’ (MFs) investment on equity and debt securities. It examines whether their trading activities drive market volatility during the pandemic period. Also, it explores the impact of COVID-19 on the Indian equity market. This study finds that the growth of COVID-19 does not significantly affect the stock market volatility during the study period. Precisely, the findings reveal that the FPI's net selling of equity and their overall trading activities in the debt instruments positively impact the market volatility. Findings also show that the FPI's momentum buys and contrarian sales induce market volatility, whereas the MF's trading style does not significantly influence the volatility. The Granger causality tests indicate that the FPI's net sales of equity instruments cause the return volatility and that the market volatility does not drive the equity net sales. Findings also reveal that mutual-fund managers' trading behavior does not Granger cause market volatility; instead, volatility causes MF's net selling of debt instruments.
1. Introduction
Institutional investment activities often influence the financial markets and real economic activities. Needless to mention that evaluating the role of institutional investors in influencing stock market volatility receives considerable attention amongst the finance scholars as well as the policymakers. The institutional investors can be broadly divided into domestic institutional investors (DII) and foreign institutional investors (FII).
While there is a consensus that both FIIs and the DII, such as mutual fund managers, are highly qualified, sophisticated professional investors, their differed trading behavior may significantly affect the market movement. Researchers group these institutional investors as informed versus uninformed traders. It is argued that while the informed investors can move price closer to their intrinsic values, the uninformed investors usually moves price away from the fundamentals (e.g., Grinblatt & Titman, Citation1989; De Long et al., Citation1990; Lakonishok et al., Citation1992; Wang, Citation1993; Sias, Citation1996; Gutierrez & Kelley, Citation2007; Bohl et al., Citation2009, Umutlu & Shackleton, Citation2015; and Ikizlerli, Citation2020). Comparing to the FPIs with the MFs managers, the latter arguably believed to be more informed about the domestic securities than the former since they can have the home advantages (e.g., Kang & Stulz, Citation1997; Kim & Yoo, Citation2009; Pool et al., Citation2012). Therefore, it follows that while the uninformed foreign investors' trading is expected to destabilize the market, the informed domestic mutual fund managers' trading behavior is argued to stabilize the market. If the informed investors act as the rational speculators, as Freidman (Citation1953) concludes, the rational speculator must stabilize the prices. However, as De Long et al. (Citation1990) point out, rational speculation may also destabilize the market if the positive feedback traders are present. Thus, if the mutual fund managers (rational speculators) activate the positive feedback strategy of other investors, it destabilizes the market.
Additionally, as Ikizlerli (Citation2020) pointed out, there is no consensus about the institutional trading style and that their trade can be both stabilizing and destabilizing. Thus an increasing number of researchers examine the impact of institutional investment activities on the stock markets, and their conclusions are varied. For example, Chhimwal and Bapat (Citation2020) recently conducted an empirical analysis using Indian data and report that domestic institutional investors mitigate the risk of unexpected FPI flow and stabilize the market.
The world has been looking towards the emerging market for a better return on investment for the last three decades, allowing the opening up of the asset markets of the developing market economies. India has witnessed one of the modern and vastly developing financial markets in the world. Post-1991, India witnessed increasing institutional investment participation as the economy opens up for foreign institutional investors. It is understood that the FII investments are the critical component of the Indian economy and that domestic institutional investors such as mutual funds, insurance companies, hedge funds, local pension funds, etc., channelize the domestic savings into the financial market. These institutional investors hold a significant chunk of financial assets such as equities and bonds (e.g., Naik & Padhi, Citation2015). The FII is also known as foreign portfolio investors (FPI), and mutual fund managers are considered the major player in the Indian equity market. However, their trading pattern is not necessarily similar (e.g., Mukherjee & Roy, Citation2011).
Secondly, the novel coronavirus pandemic COVID-19 created havoc amongst the investors. In this pandemic environment, the empirical investigations on the volatility effects of the institutional trading activities during the pandemic time laid special attention across the globe. The COVID-19 Outbreak continues to cause human losses and economic distress around the world. During July 2020, the significant rises in new confirmed cases of COVID-19 were seen in the major emerging market economies such as Brazil, India, South Africa, and Russia alongside the USA. By July 2020, India became the 3rd country to report the new confirmed cases of about 1.1 million. The first and second were the USA said about 2.0 million new patients, and Brazil reported 1.3 million new cases, respectively. With the spread of COVID-19 news, the financial markets worldwide started responding dramatically to the pandemic. Recent studies indicate that the major stock markets witnessed a decline. The risk level was increased significantly across the globe in March 2020, spreading to more than 200 destinations (e.g., Ali et al., Citation2020; Zhang et al., Citation2020).
The Indian financial market also started nose-diving (Mishra et al., Citation2020). In India, the first confirmed case of COVID-19 was detected on January 30, 2020. It increased rapidly during and post-March 2020. At the end of March 2020, the SensexFootnote1 decreased by 8,829 points, and the Nifty 50Footnote2 also reported a decline of 2,604 points. According to the Securities and Exchange Board of India (SEBI) monthly bulletins 2020, during January 2020, the FPIs withdraw INR 11,119 crores (approx. $155 crores) from debt securities; again, they withdraw INR 61,972 crores (approx. $818 crores) from equity segments and INR 56,211 crores (approx. $742 crores) from the debt securities in March 2020. The mutual fund industry also observed a net outflow of INR 1,986 crores ((approx. $27.6 crores) in February 2020. The net investment of mutual funds decreased sharply by INR 5,688 crores ((approx. $80 crores) in February 2020 compared to January 2020; MF's net investments further reduced by INR 15,724 crores (approx. $207.5 crores) in March 2020. India's government's immediate response to this pandemic had to declare a nationwide lockdown restricting social and business activities. In addition, the RBI had to cut down the interest rates. However, the Indian financial market, especially the equity market, bounced back, recovering post-March 2020.
During July 2020, the net FPI investment dropped to INR 3,301 crores (around $44 crores). The FPI has withdrawn INR 4,262 crore ($57.11 crores) from debt securities. On the contrary, the mutual fund industry saw a net inflow of INR 89,812 crores ($1203.4 crores) in July 2020 (SEBI Monthly Bulletin August 2020). With this backdrop, one natural question arises: how far the trading pattern of these major institutional investors and the COVID-19 pandemic affects the Indian equity market and whether they induce market volatility during this period? Since the market movement is thought to be driven by the institutional investors' trading styles, the present study aims to explore whether and how institutional trading influences market volatility in the presence of COVID-19.
The present study contributes and extends the existing literature at least in two distinct ways. First, this study examines the contemporaneous effects of the FPI's and the MF's net purchase and sales on the return volatility comprehensively. The analysis has been performed for these institutional investors –investment in equity and debt instruments amid COVID-19. The findings reveal that while the FPIs net sales on equity, net purchase, and net sales on debt are significantly and positively associated with volatility, the MF's net buying on equity share and net selling on debt instruments positively influence the return volatility. The growth rate of COVID-19 is insignificant in controlling market volatility. Second, unlike the previous studies considering Indian data, the present study examines whether the trading styles of FPIs and MFs affect market volatility by classifying each trade of institutional investors as either a momentum trade or a contrarian trade rather than categorizing the whole investor's group as momentum traders or contrarian traders. To classify each trading as either momentum or contrarian, we follow the methodology adopted by Umutlu and Shackleton (Citation2015) and Ikizlerli (Citation2020). This sort of analysis has not yet been undertaken in the Indian case. Again, the investigation has been done with and without augmenting the growth of COVID-19. We find that the FPIs' momentum buying and contrarian selling of equity minimize the market volatility while their contrarian selling on debt instruments induced the volatility. However, the trading styles of MFs are insignificant in influencing the market. This study also conducts the causality tests and finds that FPIs net sales on equity cause the return volatility; the return volatility does not cause equity sales. Still, it drives the net sales on debt instruments by both types of institutional investors.
The paper has been organized as follows. The following section outlines the theoretical underpinning and reviews the related empirical literature. The data and methodology used in the study are presented in section 3. The empirical findings are reported and discussed in section 4. Finally, section 5 concludes the study.
2. Review of related literature
The effect of institutional investments on the stock market has been extensively studied in several different forms. The research on mutual funds' performance and whether they successfully anticipate the stock market is not new and dates back to the mid-1960s. The pioneers were Treynor (Citation1965), Treynor and Mazuy (Citation1966), Sharpe (Citation1966), and Jensen (1968). The stabilizing or destabilizing role of institutional investors is also vastly studied (e.g., Bohl et al., Citation2009, among others; Grinblatt & Titman, Citation1989; Gutierrez & Kelley, Citation2007; Lakonishok et al., Citation1992; Sias, Citation1996). Gabaix et al. (Citation2006) theoretically show that the market movement is due to large investor group trading.
The theories that try to explain the Interaction between institutional investment activities and the stock market behavior are the feedback trading hypothesis (e.g., Davidson & Dutia, Citation1989; De Long et al., Citation1990), the price pressure hypothesis (e.g., Harris & Gurel, Citation1986; Shleifer, Citation1986), and the information revelation hypothesis (Lee et al., Citation1991). The feedback trading hypothesis is further classified into positive feedback trading (or the momentum trading strategy) and negative feedback trading (or the contrarian trading strategy). Under the momentum strategy, investors usually buy securities when their price rises and sell securities when the prices fall (De Long et al., Citation1990). On the contrary, under the contrarian strategy, investors go against the market movement and buy stocks when the market is on a downward trend and then sell them when the market takes an upward trend. The feedback trading hypothesis also explains whether institutional investors stabilize or destabilize the stock market. The institutional investors destabilize the stock market when they buy (sell) over-priced (under-priced) stock, contributing to divergence in prices. However, when the adverse feedback traders offset the positive feedback traders, they stabilize the market. Finally, the price pressure hypothesis postulates the stock return is positively associated with the contemporaneous institutional fund flows. It believes that price changes are caused by a shift in the combined demand of a group of investors and that the increased inflows of funds stimulate the institution to hold more stocks causing the stock price to rise. The information revelation hypothesis posits that if some investors own certain private information and increase their inflow, the uninformed or less-informed investors also follow them, assuming that the current price is below the fundamental level. As a result, the overall stock price will increase with the increase in the aggregate purchase.
A strand of literature turns its attention to examine whether the intuitional trading behavior induces market volatility empirically. The findings are, at large, mixed. Sias (Citation1996) uses 15 years of data from the US and documents a positive and contemporaneous relationship between institutional holdings and stock return volatility. Wang (Citation2007) documents that foreign investors have the dominant effect on market volatility over investor groups in Thailand. Cao et al. (Citation2008) examine the dynamic relationship between the mutual fund flows and stock return volatility and report that market volatility is negatively related to contemporaneous and lagged flows. Oh and Parwada (Citation2007) analyze the relationship of mutual fund flows and stock returns for Korea and document that return volatility is positively related to disaggregated fund flows, i.e., stock purchases and sales flow. Still, the aggregate flow does not show a significant association with volatility or risk. Li and Wang (Citation2010) report a significantly negative relationship between institutional net trading and China's market volatility. Han et al. (Citation2015) document that the FIIs reduce market volatility and stabilize the market, whereas the domestic institutional investors induce market volatility in China.
Umutlu and Shackleton (Citation2015) examine different Korean market investors' stock return volatility and trading styles. They conclude that informed institutional investors' trading against the uninformed individual investors drives the market volatility and adverse effects. Their findings also show that net foreign trading has an increasing impact on volatility, although not always significant. Che (Citation2018) examines how different types of investors affect Norway's stock market volatility and document that the momentum traders who have the shortest investment horizon induce the market volatility, whereas the contrarian traders reduce the volatility. Ikizlerli (Citation2020) uses an asymmetric generalized autoregressive conditional heteroskedasticity model to examine the impact of institutional trading. The author considers the trading styles of different investor groups on conditional volatility and documents that institutions' net purchases increased the market volatility but found no evidence that institutional investors' trades have a destabilizing effect in the Korean stock market.
For India, although several studies empirically examined the effect of institutional investors on the stock market, they mostly paid attention either to the FIIs trading behaviors and stock returns (e.g., Chakrabarti, Citation2002; Mukherjee et al., Citation2002; Thenmozhi & Kumar, Citation2009; Thiripalraju & Acharya, Citation2011) or between mutual funds and stock returns or volatility (e.g., Sehgal & Tripathi, Citation2009; Thenmozhi & Kumar, Citation2009; Thiripalraju & Acharya, Citation2011). Also, the direct analysis volatility effects of the FIIs and the domestic institutional investors are scant. Thenmozhi and Kumar (Citation2009) analyze the Interaction between mutual fund flows and stock return and its volatility and document a positive concurrent relationship between market return/volatility and mutual fund flows measured by stock purchase and sales. Naik and Padhi (Citation2015) conducted a VAR and Granger causality test and report bidirectional causation between FIIs' net investment and market volatility. Still, the mutual fund flows and the market volatility are independent. Further, we find no study that examines the impact of different investors' trading styles on the stock return volatility.
A strand of literature came forward to examine the impact of the COVID-19 pandemic on the overall stock market performances across the globe. Although the list is increasing, some studies prompted to analyze it are as follows: Ali et al. (Citation2020) conclude that the COVID-19 creates more panic among most countries' stock markets as it moves from epidemic to pandemic. Zhang et al. (Citation2020) analyze the stock market risk in the COVID-19 Outbreak for 15 countries and conclude that the global financial risk has increased substantially in response to the pandemic. Albulescu (Citation2021) examines the impact of new cases of COVID-19 on stock market volatility in the US and concludes that the continuation of the pandemic is an essential source of volatility. Topcu and Gulal (Citation2020) examine the impact of COVID-19 on emerging markets and conclude that the pandemic's negative impact has gradually fallen. They also document that the effects of the pandemic were highest in the Asian markets. Baek et al. (Citation2020) conduct an industry-level analysis in the US and conclude that volatility is sensitive to both the positive and negative news of the COVID-19 pandemic. Mishra et al. (Citation2020) examine the impact of COVID-19 in the Indian stock market and find that most stock indices reported negative growth during the pandemic period. The pandemic's impact is severe in the context of the stock liquidity index.
3. Data, sample timeline, and methodology
The study uses daily data of Nifty 50 total return indexes, daily purchase and sales details of foreign portfolio investors and mutual fund investors, and confirmed cases of COVID-19 in India. The sample period starts from January 30, 2020, to July 30, 2020. As the first case of COVID-19 (confirmed) was observed in India on January 30, 2020, the sample period is worth considering. The sample period is not too early and not too late to examine the pandemic's impact on the Indian stock market. We extracted the daily data of Nifty 50 and mutual fund flows from the Securities and Exchange Board of India (SEBI). The daily data of foreign portfolio investors have been extracted from India's Reserve Bank (RBI). The daily data of confirmed cases of COVID-19 has been extracted from ‘our world in' data.
First, we transformed the daily total return index into log returns. Second, we ran an EGARCH (1, 1) model, extracted the variance series, and considered its square root to measure the volatility accurately. Third, similar to Umutlu and Shackleton (Citation2015) and Ikizlerli (Citation2020), we employ net purchase and net sales of institutional investors normalized by the total trading value as the trading imbalance variables. Finally, the growth of the confirmed case of COVID-19 has been considered instead of the absolute number.
Specifically, we employ the following measure to reflect the fund flow of foreign portfolio investors and mutual fund managers:
(1)
(1)
(2)
(2)
where NPjt and NSjt represent the net purchase and net sales respectively of the institutional investor's group j on day t and are the minimum and maximum of zeros, respectively. NP and NS are defined for the two investor groups viz, foreign portfolio investor and mutual fund managers. Pjt and Sjt denote the values of equity shares purchased and sold by the institutional investor group j in a given day t. A similar definition is used for the purchase and sales of debt instruments. According to Ikizlerli (Citation2020), this measure provides the effect of investor trading on volatility better than the usual buy-sell imbalance measure.
To examine the contemporaneous relationship, we start the analysis by regressing the stock return volatility on net trading (purchase and sales as defined above) of institutional investors. The same model is re-run, considering institutional trading on debt securities. The model applied for both institutional investors,' i.e., foreign portfolio investors and domestic mutual fund managers. The regression model is as follows.
(3)
(3)
where, σt denotes the conditional volatility on day t and is estimated by the square root of the EGARCH(1,1) variance series. To obtain the conditional variance series, we estimated the following EGARCH (1, 1) model to capture non-linearity and asymmetric patterns.
(4)
(4)
(5)
(5)
In Equationequation (3)(3)
(3) , we include the five lagged daily volatility to wipe out any serial correlation in the residual. Previous studies adopted a similar procedure to control volatility persistency (e.g., Avramov et al., Citation2006; Haron & Ayojimi, Citation2019; Li & Wang, Citation2010; Nguyen et al., Citation2019; Umutlu & Shackleton, Citation2015). It is also argued that there might be a correlation between lagged return (rt-1) and volatility (e.g., Avramov et al., Citation2006; Umutlu & Shackleton, Citation2015). Thus we also include the lagged return as an explanatory variable. NPjt and NSjt denote net purchase and net sell for investor group j, i.e., they are defined for foreign portfolio investors and mutual fund managers. Therefore, the impact of institutional trading on the stock return volatility is measured by βjNP and βjNS. EquationEquation (3)
(3)
(3) is most similar in spirit to that of Umutlu and Shackleton (Citation2015). Still, it differs from the fact that we employ the EGARCH (1, 1) model to extracted conditional variance series rather than the GARCH (1, 1) model. Since the non-negative constraint imposed on the GARCH model cannot capture most stock markets' asymmetric volatility pattern, the EGARCH model is applied. The advantage of using the EGARCH model to measure return volatility is well acknowledged in the finance literature. It captures the asymmetric pattern as well as the non-linearity of the conditional variance. Also, it is argued to free from possible misspecifications of the volatility process since it imposes no positive constraint in the estimated parameters.
It is also expected that the Indian stock market might affect by the COVID-19 pandemic. To test its impact, we re-estimate Equationequation (3)(3)
(3) , augmenting the growth of COVID-19 confirmed cases daily. Accordingly, we run the following model for both the investor's groups and incorporating their equity trading and debt trading.
(6)
(6)
where, GCOVID19 stands for growth of confirmed cases due to the pandemic. Other variables are as defined earlier.
It is also argued that the trading style of a particular investor group can influence volatility. However, there is no consensus regarding it. Previous studies classify the specific investor group as the momentum and the contrarian traders and show whether they destabilize the market. We have gone for one modification in the present study and classify each trade of investor groups as a contrarian or a momentum. According to Umutlu and Shackleton (Citation2015), this modification enables us to track the trading pattern changes over time. The effect of trading style on the volatility is measured in the following modified equations in the spirit of Umutlu and Shackleton (Citation2015).
(7)
(7)
where, D1 is the dummy variable that takes the value 1 when the average stock return for the previous five days is positive [i.e., D1 = 1 when
] on day t, and 0 otherwise. All the other variables are as defined earlier. A sale is a momentum (contrarian) sale when the mean return of the past five days is negative (positive) before the sale trade. Similarly, a purchase is a momentum (contrarian) when the mean return of the past five days is positive (negative). It implies that when D1 = 1, the mean return of the past five days is positive on the day, and the net sale (purchase) is a contrarian (momentum). On the other hand, when D1 = 0, the net sale (purchase) is momentum (contrarian). More clearly, when D1 = 1, the net sale is a contrarian sale. Thus the effect of contrarian sale can be obtained as
Similarly, when D1 = 1, the net purchase is the momentum buy, and the momentum buy effect can be obtained as
EquationEquation (7)(7)
(7) has been run for both institutional investor groups to trade in equity and debt separately. We also re-run the above equation augmenting the growth of COVID-19 confirmed cases. Thus we run the following model.
(8)
(8)
We further examine the dynamic relationship between institutional fund flow and volatility by employing a vector autoregressive (VAR) model incorporating the growth of COVID19 confirmed cases for the sample period. Then, we test whether the institutional fund flow causes volatility or the volatility causes the institutional fund flows. Our estimated VAR Granger causality model is of the following form.
(9)
(9)
(10)
(10)
where, σt denotes the daily volatility measured from Equationequation (5)
(5)
(5) ; FLOW represents the daily trading (Net sales and buys) of the institutional investors considered in this study and are as defined in Equationequations (1)
(1)
(1) and Equation(2)
(2)
(2) above. EquationEquations (9)
(9)
(9) and Equation(10)
(10)
(10) have been run for foreign portfolio investors and the mutual fund managers and their equity trading and debt trading separately.
In Equationequation (9)(9)
(9) , the institutional investors' net flow Granger causes stock market volatility if either ϕ1i are jointly significant by testing the null hypothesis of H0: ϕ11 = ϕ12 =……. = ϕ1p. Likewise, in Equationequation (10)
(10)
(10) , the Market volatility Granger causes the institutional investors net flow if either θ2i are jointly significant by testing the null hypothesis of H0: θ21 = θ22=……. = θ2p.
4. Results and discussion
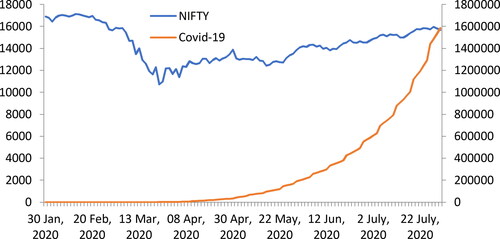
This section presents the empirical findings starting from the preliminary analysis of all the key variables. shows the time-series plot of the benchmark index of the Indian stock market (NSE Nifty) and the number of confirmed cases due to the COVID-19 pandemic during the study period. It can be observed that the number of confirmed cases of COVID-19 has been increased exponentially in post-March 2020. Notice that the Nifty index decreased in the wake-up of the pandemic news worldwide and continued to decline till March 24, 2020. On this date, the government of India announced a complete lockdown. It is followed by several policy changes by the central bank. It seems that while the COVID-19 confirmed case increased terrifically, the benchmark index started recovering post in March 2020 and then increased steadily, although at a slower pace with mild fluctuations. The reason might be that the Reserve Bank of India had reduced the repo rate and the reverse repo rate by 75bps and 90 bps, respectively, on March 27, 2020. This rate cut might induce investors to switch their investment towards equity shares instead of debt instruments.
Figure 1. Time series plot of NIFTY and the COVID-19 confirmed cases in India.
Source: Author’s calculation.
presents the descriptive statistics of the level variables, such as the Nifty index, COVID-19, investment (in monetary value) of foreign intuitional investors (FII), and the mutual fund managers (MF). It can be observed from this table that the average Nifty index for the 119 days sample is 14,328.5, and the standard deviation is 1,613.19, indicating substantial variation from its mean value. The average number of confirmed cases of COVID19 is 2,67,845. also shows a large differential of investment activities of the two investors groups. The difference in the investment activity in the equity and debt within the FII and MF is also observed. It can be seen that the FII sold more than they purchased. On average, the FII sold their equity share, on an average Rs 7285 crores and their debt instruments worth Rs 2109 crores; whereas their mean purchase on equity is Rs 7073 crores versus their mean purchase on debt only Rs 1298 crores. On the other hand, the trading behavior of domestic institutional investors (mutual fund managers) quite the opposite of FII's trading behavior. It can be seen that the mean values of trading in debt instruments are significantly higher than the mean values of equity fund flows.
Table 1. Summary statistics of level variables.
An essential property of time-series is that the underlying variable must be stationary. We employ the augmented Dickey-Fuller (ADF) test and the Kwiatkowski-Phillips-Schmidt-Shin (KPSS) tests to confirm the stationary properties. The ADF test takes the null hypothesis that H0: the variable has unit root implying the series's non-stationarity against the alternative hypothesis that the variable does not have the unit root. One criticism of the ADF test is that it cannot distinguish between the unit root and near unit root process. Thus, we perform the KPSS test where the null hypothesis is that the data series is stationary against the alternative of the non-stationarity. The results are shown in . The results confirm that all the variables satisfy the stationary property, and thus further analyses have been done using such variables.
Table 2. Results of the unit root tests.
The analysis of the contemporaneous relationship between the institutional fund flows and the stock return volatility is based on Equationequation (3)(3)
(3) . For this purpose, we first run an EGARCH model specified in Equationequation (5)
(5)
(5) and retrieve the variance series. The square root of the variance series is then used to represent the dependent variable for the regression model. The results are reported in . The estimated results are based on the heteroscedasticity and autocorrelation standard errors and covariance. This table shows the results of four different models independently for foreign institutional investors (panel a) and the mutual fund managers (panel b). Several exciting findings can be observed from this table. It can be seen that Vol(-5) is positive and statistically significant across the regression models implies that volatility is consistent. The lagged return is negative and statistically significant across the regression models indicating a negative return-volatility relationship consistent with the finance literature. Concerning the institutional fund flows, from model 1 (panel a), FII's net equity sales are positive and significantly influence the return volatility. This finding is consistent with Chhimwal and Bapat (Citation2020) findings for the Indian Stock market. A similar finding is obtained from model 2 when the GCOVID19 is augmented in the regression model. However, the results show that the coefficient of GCOVID19 is positive but statistically insignificant. This variable is statistically insignificant (albeit positive) at the usual 0.05 level across the regression models for both investor groups. The findings from models 3 and 4 - where we re-estimate the regression model considering the FII's investment activities on debt instruments - show that both the net sales and the net purchase are positive and significantly affect the usual return volatility level of significance. We can observe from model 4 that the coefficient of the GCOVID19 is significant at the 10 percent level, and it is positive.
Table 3. Contemporaneous relationship between institutional fund flows and stock return volatility.
The results of the contemporaneous effect of domestic institutional investors,' i.e., mutual fund managers' fund flow on the return volatility, is also reported in (panel b). It can be seen that the impact of the trading activities of these domestic institutional investors is quite different. Firstly, both the results from model 1 and model 2 indicate that the MF's net purchase on equity share is positive and statistically significant. Secondly, when the regression is reconsidered to understand the impact of the MF's trading activities on return volatility, it is evident from models 3 and 4 that their selling activities on debt instruments are positive and statistically significant at the 10 per cent level. On the other hand, their buying activities on the debt instrument are found to be insignificant in influencing the return volatility. The GCOVID19 is insignificant in model 2 but significant at the 10 percent level in model 4. Thus, it is clear from the analysis that while the MF's buying on equity share positively influences the return volatility, the FII's selling on equity induces the return volatility. On the other hand, while MF's only selling activities on debt instruments positively influence the return volatility, FII's trading on debt influences return volatility. These findings are more or less in line with the previous findings of Naik and Padhi (Citation2015) and Chhimwal and Bapat (Citation2020).
From the first stage of the analysis, the institutional investors' trading behaviors significantly affect market volatility. FII's net sales of equity and debt instruments are a positive function of market volatility. In contrast, the MF's net purchase of equity and the net sales on a debt instrument is a positive function of volatility. The findings suggest that the foreign investor is less informed, and thus they sold more than they purchase both on equity and debt, leading to increased market volatility. On the other hand, mutual fund managers purchase more equity shares from foreign institutional investors or domestic individual investors during the study period. The debt instrument's investment seems rapid because, during the study period, the Reserve Bank of India cuts the interest rates significantly in the Outbreak of COVID-19. This RBI policy led the portfolio investor to switch their investment to the equity share from the debt instruments. The increased sale of the debt instrument and the increased purchase of equity share might create the turbulence market overall. It might also explain the positive but insignificant impact of the COVID-19 pandemic on the Indian stock market.
To examine the trading styles, i.e., whether the institutional investors' momentum and contrarian trading pattern impacts the market volatility, Equationequation (7)(7)
(7) is estimated, and the results are reported in . This equation is re-estimated again, augmenting the GCOVID19. We label the contrarian trade and momentum trade with the help of the dummy variable defined in the previous section. Panel (a) of reports the volatility effects of the trading style of FII, and Panel (b) says the same for mutual fund managers. It can be seen from (both Panel a and b) that the coefficient of dummy variable D1 is negative and statistically highly significant across the models. It implies that positive returns have a more negligible effect on volatility than negative returns. The coefficients of interaction terms D1*NETEP and D1*NETES are significantly negative. The momentum buys slope coefficient in the case for model 1 in Panel (a) is (0.0054 − 0.0139) = − 0.0085, implying that the momentum buying activities on equity minimize the market volatility.
Table 4. Contemporaneous relationship between institutional fund flows and stock return volatility with interactive dummies.
Similarly, the contrarian sales' slope coefficient in the same model can be obtained as (0.0243 − 0.0367) = − 0.0124, implying that the contrarian sale of FII also reduces the market volatility. The result is very similar when the equation is re-estimated, augmenting the GCOVID19. However, we can observe that GCOVID19 is positive but insignificant.
When considering the FII's investment activities on debt instruments, it can be observed from model 3 of Panel (a) that interaction terms D1*NETDP coefficients are negative but insignificant. In contrast, the D1*NETES is negative and significant at a 1 percent level. In this case, the slope coefficient of the momentum buy is insignificantly negative. However, the contrarian sales' slope coefficient can be obtained as (0.0144 − 0.0141) = 0.0003, implying that the contrarian sale on the debt instrument of FII induces market volatility. Again, we find very similar results when estimated model 4.
When a similar analysis is performed for MF, findings reveal that none of the interaction terms is statistically significant across the regression models. The results are reported in Panel (b) of the same . Thus, the analysis provides evidence that while foreign institutional investors' trading style induces market volatility, the trading style of mutual fund managers does not have a significant role in market volatility. These findings loosely align with Umutlu and Shackleton (Citation2015) and Ikizlerli (Citation2020) findings for the Korean stock market. Umutlu and Shackleton (Citation2015) also documented that foreign investors' contrarian and momentum trading styles induce volatility. However, the trading style of both individual and institutional investors decreases volatility, concluding that the trading style of investors does not consistently drive volatility. Nevertheless, in particular, both the studies empirically found that foreign investors' trading drives market volatility. Further, it is evident from the present study that the COVID19 pandemic could not significantly induce market volatility.
reports the dynamic Interaction between the FII's fund flows and the return volatility using the VAR model with two lags. Since we find evidence that only the FII's net sales statistically significantly influence the volatility, as indicated by , we have considered only Net Sales (both equity and debt) of FIIs and the return volatility in the VAR model. When the analysis is being done considering the equity investment, it can be seen that the lagged net sales significantly and positively determine the return volatility. Its lags also influence the return volatility. However, the volatility is insignificant in influencing net sales. When considering the FII's debt investment, it is evident that volatility positively impacts net sales at a 1 percent level; net sales are also significant in influencing the volatility but only at a 10 percent level.
Table 5. Dynamics of Interaction between fund flow and volatility (FII's sales on Equity and Debt).
These findings indicate that the arrival of any potentially bad news may prompt foreign institutional investors to sell more, which may induce volatility. When the market becomes more volatile, the FIIs net sales on debt instruments increase during the first phase of our sample period. This is supported by the results of the Granger causality tests reported in . The Granger causality test results clearly show that FII's net equity sales Granger causes volatility. The volatility fails to Granger causes net equity sales; instead, it Granger causes net debt sales. We also included the GCOVID19 as an exogenous variable to the system, but the results show that this variable is statistically insignificant.
Table 6. Granger causality test.
presents VAR analysis results considering mutual funds manager's fund flows and the return volatility in the system. The GCOVID19 is also included as an exogenous variable to the system. The results reveal that neither the lagged net sales nor the lagged net purchase significantly influences the return volatility. This is applied to both MF's equity investment and debt investment. On the other hand, the market volatility is statistically significant in explaining the MF's net sales on debt instruments. This result is supported by the findings from the Granger causality tests reported in . Specifically, shows that the FII's net sales on equity instruments Granger cause market volatility. A similar finding was reported by Naik and Padhi (Citation2015). Second, the null hypothesis that "volatility does not Granger causes MF's net debt sales" is rejected at the usual five per cent level. Also, the null hypothesis that "volatility does not Granger causes FII's net debt sales" is rejected. Thus it can be inferred that volatility causes the net sales of debt instruments of both the investors' groups.
Table 7. Dynamics of Interaction between fund flow and volatility (MF's investment on Equity and Debt).
5. Conclusion
In the COVID-19 backdrop, the economic conditions of many countries deteriorated, and the financial markets plummeted. Large withdrawals of institutional investments were observed with the panic that the pandemic would worsen the markets. Thus, the natural question is: 'has the institutional investment primarily affected, and thus, their investment behavior induced the market volatility? Whether the COVID-19 exacerbated the stock market volatility? The present study tried to answer these questions by examining foreign portfolio investors' investment activities and the domestic mutual fund managers in India using daily data from January 30, 2020, to July 30, 2020. The study's main findings are summarized as follows. (i) The analysis reveals that the return volatility is consistent over time and that a negative relationship between stock return and volatility is evident. (ii) The FII's net sales of equity and debt instruments positively influence market volatility. The MF's net purchase of equity and the net sales on debt instruments are positively associated with return volatility. (iii) We also find that while the trading style of foreign portfolio investors induces market volatility, mutual fund managers' trading style does not have a significant role in market volatility. Specifically, findings show that the FPI's momentum buys and contrarian sales induce market volatility, whereas the MF's trading style does not significantly influence the volatility. Thus it may be suggested to the policymakers to strengthen the domestic investment by encouraging and promoting local participation in the mutual fund investment. (iv) The findings from Granger causality tests show that the FPIs net sales on equity cause return volatility. However, that volatility does not cause net sales on equity; instead, it causes the FPIs net sales on debt securities. The analysis also reveals that the return volatility causes mutual funds net sales on the debt securities. The investment activities of mutual fund managers do not cause return volatility. (v) The growth of COVID-19 is insignificant in influencing the market volatility during the study period.
While these findings may provide important implications, the limitations should not be overlooked. The study is limited to only one type of domestic institutional investors, i.e., mutual fund managers, due to the data availability and competitive nature.
Disclosure statement
No potential conflict of interest was reported by the authors.
Additional information
Funding
Notes
1 The SENSEX was calculated based on a market capitalization-weighted methodology comprising 30 stocks of well-established and financially sounds companies across the key sectors in the country which listed in Bombay Stock Exchange. The SENSEX has become a free-float methodology with effect from September 1, 2003. It is a benchmark stock market index in India.
2 Nifty 50 is another benchmark stock market index of India that represents the weighted average of 50 largest and well established companies listed on the National stock exchange of India.
References
- Albulescu, C. T. (2021). COVID-19 and the United States financial markets' volatility. Finance Research Letters, 38, 101699. https://doi.org/10.1016/j.frl.2020.101699
- Ali, M., Alam, N., & Rizvi, S. A. R. (2020). Coronavirus (COVID-19) - An epidemic or pandemic for financial markets. Journal of Behavioral and Experimental Finance, 27, 100341. https://doi.org/10.1016/j.jbef.2020.100341
- Avramov, D., Chordia, T., & Goyal, A. (2006). The impact of trades on daily volatility. Review of Financial Studies, 19(4), 1241–1277. https://doi.org/10.1093/rfs/hhj027
- Baek, S., Mohanty, S. K., & Glambosky, M. (2020). COVID-19 and stock market volatility: An industry level analysis. Finance Research Letters, 37, 101748. https://doi.org/10.1016/j.frl.2020.101748
- Bohl, M. T., Brzeszczyński, J., & Wilfling, B. (2009). Instituional investors and stock returns volatility: Empirical evidence from a natural experiment. Journal of Financial Stability, 5(2), 170–182. https://doi.org/10.1016/j.jfs.2008.02.003
- Cao, C., Chang, E. C., & Wang, Y. (2008). An empirical analysis of the dynamic relationship between mutual fund flow and market return volatility. Journal of Banking & Finance, 32(10), 2111–2123. https://doi.org/10.1016/j.jbankfin.2007.12.035
- Chakrabarti, R. (2002). FII flows to India: Nature and causes. Money and Finance, 2(7), 61–81.
- Che, L. (2018). Investors types and stock return volatility. Journal of Empirical Finance, 47, 139–161. https://doi.org/10.1016/j.jempfin.2018.03.005
- Chhimwal, B., & Bapat, V. (2020). Impact of foreign and domestic investment in stock market volatility: Empirical Evidence from India. Cogent Economics & Finance, 8(1), 1754321. https://doi.org/10.1080/23322039.2020.1754321
- Davidson, W. N., & Dutia, D. (1989). A note on the behavior of securities returns: A test of stock market overreaction and efficiencies. Journal of Financial Research, 12(3), 245–252. https://doi.org/10.1111/j.1475-6803.1989.tb00517.x
- De Long, B. J., Shleifer, A., Summers, L. H., & Waldmann, R. J. (1990). Positive feedback investment strategies and destabilizing rational speculation. The Journal of Finance, 45(2), 379–395. https://doi.org/10.1111/j.1540-6261.1990.tb03695.x
- Freidman, M. (1953). The case for Flexible exchange rates. In Essays in positive economics. University of Chicago Press.
- Gabaix, X., Gopikrishnan, P., Plerou, V., & Stanley, H. E. (2006). Institutional investors and stock market volatility. The Quarterly Journal of Economics, 121(2), 461–504. https://doi.org/10.1162/qjec.2006.121.2.461
- Grinblatt, M., & Titman, S. (1989). Mutual fund performance: An analysis of quarterly portfolio holdings. The Journal of Business, 62(3), 393–416. https://doi.org/10.1086/296468
- Gutierrez Jr, R. C., & Kelley, E. K. (2007). Pacific Northwest Finance Conference Paper, Institutional Investors and Stock prices: Destabilizing and Stabilizing Herds., October 2007. Retrieved October 2007, from https://citeseerx.ist.psu.edu/viewdoc/download?doi=10.1.1.383.9480&rep=rep1&type=pdf
- Han, L., Zheng, Q., Li, L., & Yin, L. (2015). Do foreign institutional investors stabilize the capital market? Economics Letters, 136, 73–75. https://doi.org/10.1016/j.econlet.2015.09.008
- Haron, R., & Ayojimi, S. M. (2019). The impact of GST implementation on the Malaysian stock market index volatility: An empirical approach. Journal of Asian Business and Economic Studies, 26(1), 17–33. https://doi.org/10.1108/JABES-06-2018-0027
- Harris, L., & Gurel, E. (1986). Price and Volume effects associated with changes in the S&P 500: New evidence for the existence of price pressures. The Journal of Finance, 41(4), 815–829. https://doi.org/10.1111/j.1540-6261.1986.tb04550.x
- Ikizlerli, D. (2020). Institutional investor and stock market volatility: evidence from Korea. Applied Economics Letters, 27(6), 473–476. https://doi.org/10.1080/13504851.2019.1632413
- Jensen, M. C. (1968). The performance of mutual funds in the period 1945-1964. The Journal of Finance, 23(2), 389–416. https://doi.org/10.1111/j.1540-6261.1968.tb00815.x
- Kang, J. K., & Stulz, R. (1997). Why is there a home bias? An analysis of foreign portfolio equity ownership in Japan. Journal of Financial Economics, 46(1), 3–28. https://doi.org/10.1016/S0304-405X(97)00023-8
- Kim, J., & Yoo, S. S. (2009). Market liberalization and foreign equity portfolio selection in Korea. Journal of Multinational Financial Management, 19(3), 206–220. https://doi.org/10.1016/j.mulfin.2008.11.003
- Lakonishok, J., Shleifer, A., & Vishny, R. W. (1992). The impact of institutional trading on stock prices. Journal of Financial Economics, 32(1), 23–43. https://doi.org/10.1016/0304-405X(92)90023-Q
- Lee, C. M. C., Shleifer, A., & Thaler, R. H. (1991). Investor sentiment and the closed-end fund puzzle. The Journal of Finance, 46(1), 75–109. https://doi.org/10.1111/j.1540-6261.1991.tb03746.x
- Li, W., & Wang, S. S. (2010). Daily institutional trades and stock price volatility in a retail investor dominated emerging market. Journal of Financial Markets, 13(4), 448–474. https://doi.org/10.1016/j.finmar.2010.07.003
- Mishra, A. K., Rath, B. N., & Dash, A. K. (2020). Does the Indian financial market nosedive because of the COVID-19 outbreak, in comparison to after demonetization and the GST? Emerging Markets Finance and Trade, 56(10), 2162–2180. https://doi.org/10.1080/1540496X.2020.1785425
- Mukherjee, P., Bose, S., & Coondoo, D. (2002). Foreign institutional investment in the Indian equity market- An analysis of daily flows during January 1999- May. Money and Finance, 2(2002), 9–10.
- Mukherjee, P., & Roy, M. (2011). The nature and determinants of investments by institutional investors in the Indian stock market. Journal of Emerging Market Finance, 10(3), 253–283. https://doi.org/10.1177/097265271101000301
- Naik, P. K., & Padhi, P. (2015). Interaction of institutional investment activity and stock market volatility. Asia-Pacific Journal of Management Research and Innovation, 11(3), 219–229. https://doi.org/10.1177/2319510X15588385
- Nguyen, T., Chaiechi, T., Eagle, L., & Low, D. (2019). Growth enterprise market in Hong Kong: Efficiency evolution and long memory in return and volatility. Journal of Asian Business and Economic Studies, 27(1), 19–34. https://doi.org/10.1108/JABES-01-2019-0009
- Oh, N. Y., & Parwada, J. T. (2007). Relations between mutual fund flows and stock market returns in Korea. Journal of International Financial Markets, Institutions and Money, 17(2), 140–151. https://doi.org/10.1016/j.intfin.2005.10.001
- Pool, V. K., Stoffman, N., & Yonker, S. E. (2012). No Place like home: familiarity in mutual fund manager portfolio choice. The Review of Financial Studies, 25(8), 2563–2599. https://doi.org/10.1093/rfs/hhs075
- Sehgal, S., & Tripathi, N. (2009). An examination of home advantage (Bias) argument in the Indian financial markets: Domestic Financial Institutional Investors (DFIIs) vis-a-vis Foreign Institutional Investors (FIIs). Asian Journal of Finance and Accounting, 1(2), 163–174.
- Sharpe, W. F. (1966). Mutual fund performance. The Journal of Business, 39(S1), 119–138. https://doi.org/10.1086/294846
- Shleifer, A. (1986). Do demand curves for stock slope down? The Journal of Finance, 41(3), 579–590. https://doi.org/10.1111/j.1540-6261.1986.tb04518.x
- Sias, R. W. (1996). Volatility and the Institutional Investors. Financial Analysts Journal, 52(2), 13–20. https://doi.org/10.2469/faj.v52.n2.1976
- Thenmozhi, M., & Kumar, M. (2009). Dynamic interaction among mutual fund flows, stock market return and volatility. NSE Working Papers, 50, 1–30.
- Thiripalraju, M., & Acharya, R. (2011). Dynamic interaction between institutional investment and stock returns in India: A case of FIIs and MFs. Indian Institute of Capital Markets.
- Topcu, M., & Gulal, O. S. (2020). The impact of COVID-19 on emerging stock markets. Finance Research Letters, 36, 101691. https://doi.org/10.1016/j.frl.2020.101691
- Treynor, J. L. (1965). How to rate management of investment funds. Harvard Business Review, 43(1), 63–75.
- Treynor, J. L., & Mazuy, K. K. (1966). Can Mutual funds outguess the market? Harvard Busuness Review, 44(4), 131–136.
- Umutlu, M., & Shackleton, M. (2015). Stock return volatility and daily equity trading by investor groups in Korea. Pacific-Basin Finance Journal, 34, 43–70. https://doi.org/10.1016/j.pacfin.2015.05.003
- Wang, J. (1993). A model of intertemporal asset prices under asymmetric information. The Review of Economic Studies, 60(2), 249–282. https://doi.org/10.2307/2298057
- Wang, J. (2007). Foreign equity trading and emerging market volatility: Evidence from Indonesia and Thailand. Journal of Development Economics, 84(2), 798–811. https://doi.org/10.1016/j.jdeveco.2006.05.001
- Zhang, D., Hu, M., & Ji, Q. (2020). Financial markets under the global pandemic of COVID-19. Finance Research Letters, 36, 101528. https://doi.org/10.1016/j.frl.2020.101528