?Mathematical formulae have been encoded as MathML and are displayed in this HTML version using MathJax in order to improve their display. Uncheck the box to turn MathJax off. This feature requires Javascript. Click on a formula to zoom.
Abstract
Accelerated by the COVID-19 pandemic, the long-anticipated digital transformation of traditional retail has become the new reality. Retailers are responding to changes in consumers’ shopping behaviours and their demand for new interaction channels and touchpoints to shop at their convenience, regardless of time and location. Consequently, retailers are experiencing a change from single-channel models to multi-channel and omnichannel models. Omnichannel retailing demands integrated channel management and operation to improve customers’ shopping experiences. This study uses measures of channel integration levels from previous research to analyse channel integration among leading vendors in three top retailing sectors (clothing and apparel, home furniture and grocery) and expands the analysis by including indicators of digital transformation. The model includes 27 indicators related to channel integration and 9 indicators of digital transformation, and compares the results across sectors. By so doing, the study also aims to help establish values that may be used as target or reference values of channel integration and digitalization of retailers across sectors, irrespective of their size. The research methodology uses the 'mystery shopper' technique and includes the collection of data about the 165 leading companies in these sectors in Spain.
1. Introduction
Nearly three-quarters of consumers have used multiple channels to start and complete a transaction, and two-thirds have used multiple devices (Salesforce, Citation2020). Customers now expect retailers and brands to provide omnichannel services but retailers are finding it difficult to articulate omnichannel strategies: only a small fraction (14%) of retailers are truly providing an omnichannel strategy (Weinswig, Citation2019). The expectations of consumers range from flexible shipping and fulfilment options to consistent and personalized interactions delivered via context-based channel selection.
Omnichannel retailing can be seen as a holistic bundling of channel mix and operational resources (Rusanen, Citation2019), which requires integration of the activities performed in the different channels. While some resources may be apparent to consumers – such as digital interfaces and physical and virtual stores – other operational resources, such as the reconfiguration of supply chain and back-office information technologies and systems, are not visible but are required to effectively ensure performance of each channel (Rusanen, Citation2019). From a consumer perspective, operational resources act as the necessary support, but omnichannel operation refers to a seamless shopping experience in which customers may shop across a variety of online and offline channels anywhere and at any time (Beck & Rygl, Citation2015; Bell et al., Citation2014; Rigby, Citation2011). From the above definition, omnichannel operation requires that the operation of each channel is not independent, but rather the different channels must be managed in an integrated way. Therefore, integrated channel management combines the objectives, design and implementation of sales channels to enhance the customers’ shopping experience, and the degree of channel integration may be considered a proxy to measure a company’s level of omnichannel operation (Acquila-Natale & Chaparro-Peláez, Citation2020).
Companies implement omnichannel strategies to generate greater value for customers (Gómez et al., Citation2017), and omnichannel will become the new normal over the next decade (von Briel, Citation2018). In recent years, retailers have become increasingly aware of the high importance of adopting omnichannel strategies and have started taking steps to embrace the new paradigm, but the transition is proving slower than expected (Weinswig, Citation2019). However, the COVID-19 pandemic and effective lockdown of the population in many countries has led to an unforeseen growth of digital channels. Pure players and omnichannel retailers have adapted to this ‘new normal’ more easily than brick-and-mortar retailers (Briedis et al., Citation2020), but the pandemic has been a catalyst for the latter to acknowledge the need to expand their activities to the digital space (Salesforce, Citation2020), making omnichannel retailing one of the top priorities for retailers that are aiming to survive and thrive in a highly competitive landscape. As a consequence, retailers need to evaluate their current omnichannel offerings and align them with customer needs but also to integrate them with existing channels to support a consistent customer experience (Briedis et al., Citation2020).
This evaluation requires an analysis of channel integration because retailers will have to balance the integration of digital commerce with brick-and-mortar retailing (von Briel, Citation2018). Previous literature has addressed the specific omnichannel configuration of companies from a logistics approach (Buldeo Rai et al., Citation2019; Marchet et al., Citation2018; Piotrowicz & Cuthbertson, Citation2019) or from the retailers’ perspective using qualitative analysis (Peltola et al., Citation2015; Ye et al., Citation2018). However, studies offering a customer view of how brands and companies operate their omnichannel strategies are scant and are often circumscribed to a single sector; for example, Acquila-Natale and Chaparro-Peláez (Citation2020) in the fashion and apparel sector, or Chaparro-Peláez et al. (Citation2020) in the electricity retailing sector. Further, empirical research on omnichannel retailing generally considers only brick-and-mortar and online stores as the two primary channels (von Briel, Citation2018), leaving aside the emerging sales and marketing mobile channel.
The present study aims to address these gaps by providing a consumer view of channel integration across companies in different sectors, including three different channels – physical stores, online (web) stores, and mobile – in the context of a single country (Spain). The study aims to answer two main questions:
RQ1. What is the current state of channel integration among leading companies in Spain across different sectors?
RQ2. Are there differences in the implementation of the elements of channel integration across industries?
Note that RQ1 includes the term ‘leading companies’ in the formulation of the question. The reason for this choice is that large companies are leading the transition to omnichannel operation because, unlike SMEs, most of them are already developing their omnichannel operation strategies or can easily broaden their distribution channels (Ryu et al., Citation2019; Ulas, Citation2019).
In order to answer these two research questions, the present study builds on Acquila-Natale and Chaparro-Peláez (Citation2020) framework for the measurement of channel integration and applies it to a sample of all major brands in the furniture (N = 37), grocery (supermarkets) (N = 17), and clothing (N = 59) retailing subsectors, using the mystery shopper technique for data collection and one-way ANOVA for the statistical analysis. The results show that most retailers are still lagging in implementing complete omnichannel strategies and that top retailers are leading the channel integration and digitalization process. The study also shows that there are differences across retailing sectors, with clothing brands being faster to adapt to the new omnichannel landscape.
Before proceeding to the presentation of the conceptual framework, we provide an overview of the sectors under analysis in the study: clothing and apparel, groceries, and home furniture. Clothing and apparel is one of the leading sectors in the implementation of omnichannel strategies, with top retailers being frequently highlighted as examples of omnichannel operation. Groceries and home furniture have been heavily affected by the COVID-19 outbreak – groceries by increased demand for online services and restructuring of the configuration of their supply chains, and home furniture by increased demand due to the shift to remote working and the creation of workspaces at home – which has made managers acknowledge the importance of digital readiness in their industry to remain competitive. The degree of online adoption among consumers varies among the three sectors, being much more prevalent in clothing than in furniture and groceries (Eurostat, Citation2020). For example, it is estimated that the percentage of e-commerce sales varies from around 2% for grocery to more than 20% for apparel (Dennis, Citation2018).
The global market value of furniture was estimated to be worth US$509.8B in 2020 and is forecast to reach approximately $650.7B by 2027 (van Gelder, Citation2020). Despite e-commerce only representing around 10% of total sales, it is projected that one-quarter of all retail sales will be done online by 2025 (Danzinger, Citation2020). The integration of internet of things into furniture products might further boost market growth (Allied Market Research, Citation2019) and brands effectively implementing omnichannel operation, such as using physical locations as hubs of distribution, will have a competitive edge (Danzinger, Citation2020). Home furnishing retailers have witnessed a huge shift in consumer behaviour: consumers spend more time at home due to the COVID-19 outbreak and lead traffic from multiple sources – e-mail, telephone, social media, as well as text, chat, video and websites – has risen, with close rates from well-managed non-physical leads doubling those from physical stores (McMahon, Citation2020a). Omnichannel-ready brands have managed to generate sales volumes approaching normal levels through appointment selling, increasingly relying on social media platforms, most notably Facebook (McMahon, Citation2020b). In an omnichannel operation landscape, the main challenges for home furnishing companies are the costs of shipping bulky and heavy items, especially when competing with free or low-cost shipping from giants such as Wayfair and Amazon (Danzinger, Citation2020), as well as compromised human resources and outdated processes in the adaptation process (McMahon, Citation2020a).
The global food and grocery retail market size was valued at $11.7 trillion in 2019 and is expected to grow at a compound annual growth rate (CAGR) of 5.0% from 2020 to 2027, while revenue of vendors jumped up remarkably in the first quarter of 2020 (Grand View Research, Citation2020). However, the global online grocery market was valued at a very small fraction of the total ($98.4 M) in 2019 (Azoth Analytics, Citation2020). The entry of Amazon in the market (through Amazon Fresh) has been a wake-up call to other players, and leading companies such as Walmart and Kroger Co. in the United States have entered e-grocery and improved their delivery options and services. Further, the COVID-19 pandemic and the subsequent lockdowns in many countries have increased the online demand for food and grocery products, with disrupted supply chains (Grand View Research, Citation2020), which has presented a major challenge to grocery chains and stores, as a large number of customers seem to be convinced to continue purchasing online (Bazaarvoice, Citation2020).
The global fashion industry has been valued at over $3 trillion (FashionUnited, Citation2020), around half of which corresponds to the clothing and apparel sector (MarketLine, Citation2020). The global apparel market is anticipated to grow at a CAGR of 5.5% from 2020–2025 (Mordor Intelligence, Citation2020). Fashion, clothing, and apparel are the most demanded products, regardless of the channel considered (Acquila-Natale & Chaparro-Peláez, Citation2020). Aware that omnichannel shoppers spend more – and more often – than offline shoppers (Bain & Company, Citation2020), clothing and apparel industries are generally ahead of most other industries in the adoption of digital marketing and omnichannel operation (Briedis et al., 2019). For instance, the adoption of social media marketing in fashion is ubiquitous (Ananda et al., Citation2015) and apparel brands currently have the largest median audience size across all industries in social media (Ananda et al., Citation2019). Omnichannel is becoming the new norm, with omnichannel shoppers representing one in three shopping journeys (Briedis et al., 2019). Furthermore, despite the huge impact in sales caused by the COVID-19 pandemic, the fashion industry has embraced digitalization and customer-centred business models, with about 90% of fashion companies stating that they will invest in their own digitalization (Lorenzo-Romero et al., Citation2020).
The remainder of this study is structured as follows. Section 2 presents the framework for the assessment of channel integration. Section 3 describes the research design and methods. Section 4 draws the main results from the analysis. Section 5 discusses the main findings of the study, and Section 6 highlights the main contributions of the study for theory and practice, as well as the limitations of the research.
2. Conceptual background
2.1. Channel integration and omnichannel measurement
Recent literature shows an increasing interest in the development of omnichannel measurement and evaluation instruments (Domański, Citation2021). For instance, Ailawadi and Farris (Citation2017) took a distribution-centred view that focuses on retailer-supplier relationships and considers advocacy, cross-channel conversions, cross-channel delivery or returns, and own-channel and cross-channel support. Liu et al. (Citation2018) developed a logistics-based measure for service integration levels that evaluates logistics service consistency and integrity; Patti et al. (Citation2020) examined customer service experience by integrating customer service metrics, but without an omnichannel perspective. Adivar et al. (Citation2019) measured performance metrics of omnichannel retail supply chains based on sustainability, efficiency and effectiveness, responsiveness, and flexibility. However, none of the measures from these studies provide insights regarding whether the company or brand has successfully integrated their channels as part of its omnichannel strategy.
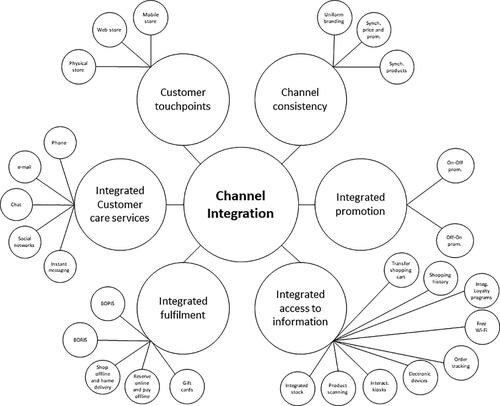
Acquila-Natale and Chaparro-Peláez (Citation2020) provided a comprehensive framework, built from prior knowledge on omnichannel retailing, to study and analyse channel integration in clothing and apparel retailing from a customer’s perspective. Their initial proposal has also been successfully adapted to service-based sectors, such as electricity retailing (Chaparro-Peláez et al., Citation2020). The channel integration framework identifies six different dimensions covering aspects that have mostly focused on the pre-purchase stage but also extend to subsequent phases of the shopping process. The six dimensions are as follows:
Customer touchpoints, or the channels available for company-consumer one-directional and bi-directional interaction, which in this study include physical stores, web stores and mobile applications.
Channel consistency, which refers to whether the image of the brand (name, logo, slogan, and visual appearance), as well as its products and prices, are consistent across the different available channels.
Integrated promotion, which refers to the existence or absence of cross-channel promotion, such as promotion from the physical channel to online channels, and vice versa.
Integrated access to information, which refers to whether consumers can access data and information offered or generated in one channel through the other channels in a consistent way.
Integrated fulfilment, which comprises aspects related to the elements of the outbound logistics process, such as delivery and returns options. The present study adds one indicator in this dimension – shopping offline and home delivery – to the original four indicators in Acquila-Natale and Chaparro-Peláez (Citation2020), based on the delivery modes found in Hübner et al. (Citation2016).
Integrated customer care services, or the different channels available for communication at any stage of the purchasing process. In addition to most traditional channels (telephone, e-mail and online chat), we also include two emerging channels of communication for customer service purposes (social networks and instant messaging, focused on the prevalent instant messaging app in Spain: WhatsApp).
2.2. Digital transformation of business
The digital transformation of business is associated with changes caused by the incorporation of digital technologies, which allow more effective engagement with customers (Reis et al., Citation2018) and support of customer-centric strategies (Fitzgerald et al., Citation2014). Digital technologies, such as smartphones, social media, big data and data analytics, and cloud computing, are the basis for the generation of competitive advantages in the digital era, regardless of company size or business model, and the main challenge is now how to effectively combine digital and physical resources to maximize value creation for consumers (McDonald & Rowsell-Jones, Citation2012), by improving customer experience, optimizing commercial and logistics processes, and even generating new business models (Fitzgerald et al., Citation2014). More particularly, integrated marketing communications play an important role in cross-channel synchronization by bringing together multiple consumer touchpoints, media and messages to tailor how companies communicate with consumers while ensuring information consistency across platforms (Manser Payne et al., Citation2017). Based on this, considering the degree of implementation of digital services, such as website, mobile app, integrated communication services and customer care management, or online billing, can complement the analysis of omnichannel operation of companies and provide a more comprehensive view of their process of digital transformation (Chaparro-Peláez et al., Citation2020), regardless of the number of channels implemented by the brand.
3. Materials and methods
provides a graphic representation of the research methodology.
Figure 1. Summary of the research design.
Source: Authors.
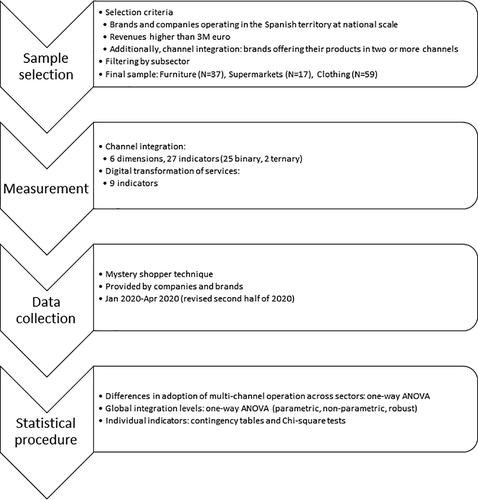
3.1. Sample
The sample of this study includes all of the major brands – some groups own more than one brand, each of which may have a different integration strategy – in the furniture, grocery (supermarkets) and clothing retailing subsectors. The selection criteria required that brands and companies operate in the Spanish territory on a national scale and have revenues higher than 3 million euro. Additionally, and because channel integration requires operating in more than one channel, only brands and companies that offer their products through two or more channels (for example, physical, web, mobile) were considered in the analysis of channel integration. The elaboration of the list was carried out in a systematic way according to the following procedure.
Step 1: Retrieval of the initial list of brands and companies from the information found at the ranking of Spanish companies by revenue (eInforma, Citation2020). The subsectors included had the following official National Classification of Economic Activity codes: (a) furniture: code 4759 (‘Retailing of furniture, lighting and other household products in specialized stores’, 168 brands and companies); (b) groceries: code 4711 (‘Retailing in non-specialized stores with predominance of food, beverage and tobacco’, 423 brands and companies); and (c) clothing: code 4771 (‘Retailing of clothing and apparel in specialized stores’, 210 companies).
Step 2: Conditional filtering. This step involves the inspection of each brand and company in the list from the previous step to confirm that their activity corresponded to either furniture, supermarket or clothing by inspecting their subcode of activity. For example, the list of companies in the furniture sector excluded retailing of mattresses, lighting, or kitchen and bathroom, while the list of companies in the clothing sector excluded shoes, accessories, sportswear, specialized child clothing and luxury brands. At this point, the list included 76 furniture companies, 63 supermarket brands and 82 clothing companies. After excluding companies that did not serve the entire Spanish territory, the list comprised 43, 63 and 59 companies for the three categories, respectively, for which all the digital transformation indicators were collected.
Step 3: Only brands and companies operating in two or more channels were considered for the analysis of indicators of channel integration. The final list comprises 37 furniture companies, 17 supermarket brands and 59 clothing companies and brands (see Appendix A).
The final dataset has some differences from those previously studied in this area, by including a comprehensive list of brands directly obtained through financial records of all large (revenues higher than 3 million euro) companies. Prior studies only included information about selected companies that the authors characterized as omnichannel (Buldeo Rai et al., Citation2019) or merged information from different sources (Acquila-Natale & Chaparro-Peláez, Citation2020) as company selection criteria.
3.2. Measurement instrument
As stated in Section 2, the measurement instrument of channel integration adapts the six dimensions proposed by Acquila-Natale and Chaparro-Peláez (Citation2020), including one new indicator in the ‘Integrated fulfilment’ dimension (‘shop in physical store and home delivery’, which is a typical delivery option in the home furnishing and grocery sectors), as well as the addition of two indicators in the ‘Integrated customer service’ dimension (‘social networks’ and ‘instant messaging’) (). This methodology has been partially used in industry reports, such as Total Retail’s Top 100 Omnichannel Retailers (Citation2020) and Weinswig’s (Citation2019) overview of the state of omnichannel retailing in Europe.
Figure 2. Dimensions and indicators used to measure channel integration.
Source: Authors.
The measurement instrument of digital transformation indicators () removes service-related indicators in Chaparro-Peláez et al. (Citation2020) proposal of indicators for the retail electricity market, but adds a more granular view of the availability of communication/customer care services and digital marketing channels across both single-channel and multi-channel operating retailers, including: availability of mobile app and webpage; contact e-via mail, chat or instant messaging (WhatsApp); presence in social networks (Facebook, Twitter, Instagram, YouTube and Pinterest); customer data management; and online billing. It is worth noting that indicators related to customer touchpoints or integrated customer services and indicators of digital transformation are not redundant; for example, a brand might have a website but not sell its products via a webstore (a value of zero in indicator 1.2 and a value of one in D.1.2), or a brand might have a profile in a social network for purposes other than customer care services, or simply not attend issues that originated in a different channel (value of one in the digital transformation indicator and zero in channel integration). summarizes the items of the measurement instrument of channel integration and digital transformation.
Figure 3. Indicators used to measure digital transformation (implemented digital services).
Source: Authors.
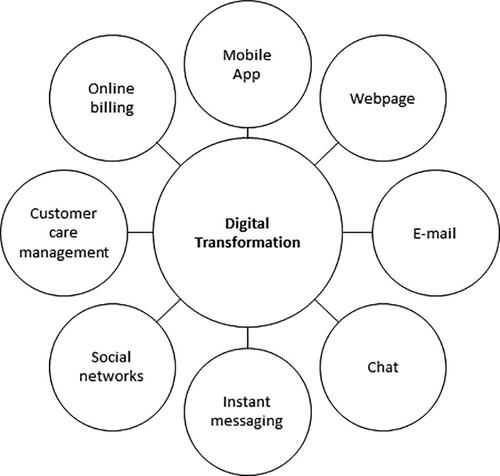
Table 1. Indicators included in the measurement instrument for channel integration and digital transformation in this study.
3.3. Data collection
Because this study takes a consumer-oriented perspective, the research design study uses the mystery shopper technique (Wilson, Citation1998) to capture data about channel integration and digitalization of the different retailing companies and brands, which makes it closer to the shopping experience that consumers undergo. As such, this technique helps identify the strengths and shortcomings of the individual services provided by a brand or company, and to establish comparisons between brands and sectors (Finn, Citation2001; Wilson, Citation1998). Mystery shopping, or pseudo-shopping, allows researchers to collect data directly from companies and brands with the objective of assessing specific aspects of the services provided by the company (Martínez Caraballo, Citation2008). Thus, researchers act as mystery shoppers by visiting the stores and collecting data using a pre-set script (de la Ballina Ballina, Citation1999) that reflects common shopping scenarios. In this research, the mystery shopper is limited to confirming whether the different brands offer the different services measured by the channel integration and digital transformation indicators. This procedure minimizes the subjectivity in the data collection process, which is one of the main weaknesses of this technique (Mckechnie et al., Citation2007).
Following Acquila-Natale and Chaparro-Peláez (Citation2020), each of the indicators was assigned a value of one when the company offered the service and a value of zero when it did not. In the case of Indicators 4.7 (Order tracking) and 4.9 (Shopping history), a value of 0.5 was assigned when the company offered the service, but the service was only partially integrated; that is, integrated only across two of the shopping channels. A final measurement of channel integration level, in percentage, was assigned by calculating the total sum of the values of each indicator divided by the total number of indicators (27); thus, a value of 27 would correspond to a total (100%) channel integration level.
Data collection was completed based on the information provided by each company in every available channel (physical and digital), which required complementary inquiring via telephone, chat, e-mail, social networks and instant messaging platforms. A first period of data collection extended from January 2020 to April 2020; the data were revised during the second half of 2020. Due to the strict lockdown established in Spain between March and May 2020 and the subsequent restrictions caused by the second and third waves of COVID-19, the research team was especially concerned that the data collection would not interfere with the normal operations of the company, which made the process slower than anticipated.
3.4. Analysis technique
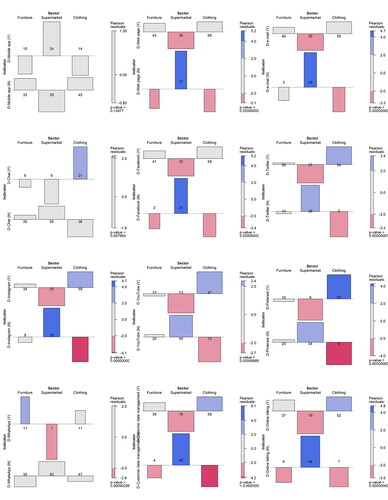
The comparison between integration levels was performed by means of a one-way ANOVA, performed in R using the ggbetweenstats function from the ggstatsplot package (Patil, Citation2018), which provides both numerical and graphical output of the results. The post-hoc analysis for pairwise comparisons did not assume equal variances, so the analysis uses the Games-Howell test with Bonferroni correction (Field, Citation2013). The test of differences between individual indicators was performed using Chi-square tests. Additional information was provided by a graphic representation of the contingency tables using association plots from the vcd package (Friendly, Citation1994; Meyer et al., Citation2006). The association plots are included in Appendix B. The heuristic for the choice of the cut-off values of 2 and 4 in the association plots aims to reflect that the highlighted cells are significant at α = 0.05 and α = 0.0001 levels, as well as at observing the pattern of deviation from independence (Zeileis et al., Citation2007).
4. Data analysis and results
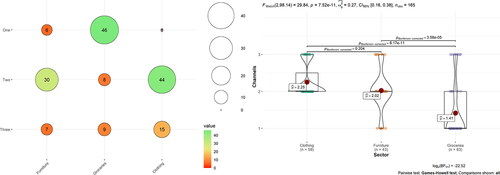
A general view of the data (, left) confirms the high rate of adoption of multi-channel operation in the clothing and apparel sector (all companies operate at least in two of the three channels), whereas most furniture brands operate in two channels and the majority of supermarkets still use brick-and-mortar-only business models. The ANOVA test (, right) shows a significant difference (p < 0.001) between the clothing and apparel sector on the one hand, and supermarket on the other hand, and evidences a general lack of multi-channel strategies in the grocery industry. The effect size (=0.27) can be considered large, as it is well over the 0.14 cut-off value (Kirk, Citation1996).
Figure 4. Distribution of operation channels across the three sectors (left) and results of the one-way ANOVA test (right).
Source: Authors.
The global analysis of channel integration levels, which only includes brands and companies operating in two or three channels, shows a different picture. The analysis finds that, in the clothing sector, nearly 60% of the services are implemented on average compared to less than half in the furniture and grocery sector, and an overall difference across the three sectors (p = 0.002; medium effect size =0.10). The results () show a significant difference between clothing and apparel brands and furniture brands, but no significant differences between supermarkets and furniture brands. Surprisingly, the results yield a non-significant difference between supermarkets and clothing brands. While the underlying cause of this result may lie in the difference in the sample size of each group, this finding merits further investigation.
Figure 5. Results of the one-way ANOVA test of channel integration levels across all sectors.
Source: Authors.
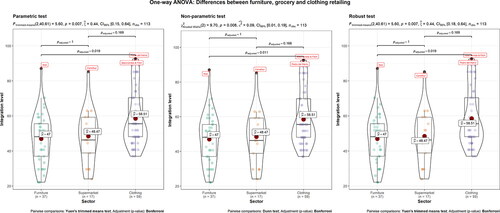
The leaders across each sector correspond to the largest companies – in the clothing and apparel industry, the largest companies are right behind the two leading brands – which seems to confirm the notion that companies with more financial resources are leading the adoption of omnichannel operation (Chaparro-Peláez et al., Citation2020; Ryu et al., Citation2019; Ulas, Citation2019).
Regarding the analysis of individual indicators of channel integration and digital transformation, summarizes the frequencies and resultant contingency tables for each indicator, while shows the results of the chi-square tests and post-hoc analysis.
Table 2. Frequencies and contingency tables for each indicator.
Table 3. Significance of the chi-square and post-hoc tests across all the indicators.
The results of these tests are further detailed in the following subsections.
4.1. Channel integration
4.1.1. Customer touchpoints
The analysis shows no differences across all three sectors in their physical and web footprint. This result was expected given that the analysis only includes brands and companies operating in two or more channels and all brands are originally brick-and-mortar stores, except for one pure player in the furniture sector (Westwing). However, the analysis finds significant differences in the implementation of mobile apps, which have been implemented by a majority of the supermarkets but not so by furniture and clothing brands.
4.1.2. Channel consistency
While no differences have been found across the three sectors – most brands show a consistent brand across the different channels – there are significant differences between all three sectors in their offering of synchronized prices and promotions, and products. Most clothing brands offer synchronized prices and promotions, whereas this statement holds true for just a few selected supermarkets. The situation is similar in the case of synchronization of products, even though clothing brands have not fully developed this element, with 12% of them still lacking this synchronization in their offering, but the results suggest that furniture brands and supermarkets are progressively adapting their channels to provide this synchronization.
4.1.3. Integrated promotions
In the case of cross-channel promotion, there are no significant differences in the way they promote the physical channel in the online channel, but there is a significant difference across all sectors in cross-promotion of the online channel in the physical channel; in the pairwise comparison, the differences are only significant between clothing brands and supermarkets. However, the results suggest that both types of cross-promotion are established practices in the three industries.
4.1.4. Integrated access to information
The analysis finds no differences in the existence of interactive kiosks and transferability of the shopping cart. Both indicators still have low degrees of implementation, with furniture brands being at the top in the provision of interactive kiosks, and supermarkets offering more often the possibility to transfer the shopping cart from one channel to another.
The main differences are found in the availability of integrated loyalty programs (well established in supermarkets but not across furniture and clothing brands), order tracking (a common practice in the clothing sector but only implemented partially in nearly half of furniture brands and supermarkets), shopping history (widely adopted either fully or partially by supermarkets, but lacking in the furniture and clothing sectors), and integrated stock (generally not implemented by furniture brands and supermarkets, and only in 36% of clothing brands).
Significant differences, albeit slightly less pronounced, are found in product scanning (low levels of implementation, but significantly more widely adopted by clothing brands than supermarkets or furniture companies; only one furniture company offers this service), free Wi-Fi (low levels of implementation, with supermarkets being at the top with approximately 30% of companies offering free Wi-Fi), and provision of electronic devices to sales associates (a more common practice in the furniture sector and almost non-existent in supermarkets).
4.1.5. Integrated fulfilment
The results show no significant differences between the availability of cross-channel gift cards and reserve online and pay offline services. Both services are far from being widely adopted across all three sectors. The results for the other three elements indicate significant differences, with higher levels of implementation of both BOPIS and BORIS among clothing brands than furniture companies and supermarkets–in that order–, whereas the possibility to shop offline and deliver to a given address goes in the opposite direction, implemented more often among furniture brands than supermarkets and clothing brands, respectively. This result may be associated with the nature of the products and the difficulty of picking up some furnishing products in the store due to size and weight.
4.1.6. Integration of customer care services
There are no differences across all sectors in the way consumers may access customer care services at any given moment along the shopping process using the phone, chat and instant messaging to address issues that happen in any available channel. This absence of differences may be explained by different reasons: the widespread availability of contact phone, and the lower implementation degrees of chat and instant messaging technologies, respectively. However, there are significant differences in the use of social networks for customer services purposes – all clothing brands but one allow consumers to contact using this channel, compared to nearly half of the furniture brands and supermarkets – and e-mail, which is also prevalent among clothing brands, is mostly implemented in the furniture sector but rarely offered by supermarkets.
4.2. Digital transformation
As explained earlier, the analysis of indicators of digital transformation was applied to both single-channel and omnichannel operating companies and brands. In this case, the only indicator of digital transformation for which the analysis finds no significant differences across sectors is the availability of mobile application; around one-third of the brands and companies in each sector offer this service.
The situation changes radically when we observe the availability of a webpage and contact e-mail: all furniture and clothing brands have a webpage (three furniture brands do not offer e-mail contact address, however) but, surprisingly, 43% of the supermarkets do not have any digital presence and are therefore missing an opportunity to create brand awareness and provide prospect customers with means to interact with the company. The implementation of synchronous contact touchpoints, such as chats and instant messaging, is less prevalent in the furniture and clothing sectors (fewer than 50% of brands have implemented them), and virtually non-existent across supermarkets. Interestingly, chats seem to be preferred over instant messaging in the clothing sector but the situation is the opposite in the furniture sector.
Regarding the use of social networks, there is a higher degree of implementation in the clothing sector: all brands are present on Facebook and Instagram, and most also have a presence on Twitter, YouTube and Pinterest. Furniture companies seem to have widely adopted some social media platforms (Facebook, Twitter and Instagram), while half also have a presence on YouTube and fewer than half have a Pinterest presence. Supermarkets have a very low rate of adoption of social media platforms, even in the case of the most popular social media networks among consumers (Facebook, Twitter and Instagram); more precisely, barely half of the companies have presence in these platforms, while only a selected few have a YouTube or Pinterest channel set up for the brand.
Finally, clothing brands also are leading the implementation of customer-oriented digital services, such as customer data management and online billing (all brands offer the former and most of them also offer the latter). Furniture brands seem to be catching up rapidly (few companies do not have these services). In this case, supermarkets are again lagging, and basically only those that operate in two or more channels (around 30% of them) offer these services.
5. Discussion of results
5.1. Overall channel integration
In answering RQ1, with some exceptions (such as integrated promotion) the analysis indicates a medium-to-low degree of channel integration across most indicators; this shows that achieving omnichannel operation is still far from being a reality for most companies. The average channel integration level of companies and brands in the clothing sector is 58.5 out of 100, compared to 47 and 48.5 in the furniture and grocery sectors, respectively. The results do not deviate much from those found in specialized industry reports, with the top 10 out of 125 leading retailers and brands scoring between 66% and 73% using alternative omnichannel indices, while half of the retailers and brands having adopted less than 50% of best practice functionality (FitforCommerce, Citation2020); these results are similar to those in other European countries (Holst & Blicher, Citation2020).
In the case of clothing companies, the average integration level is similar to the 60% integration level found in Acquila-Natale and Chaparro-Peláez (Citation2020) study. However, that study also included footwear, sportswear and luxury companies, with turnover higher than 1 billion euro. Therefore, our results suggest that companies are progressively adapting their service offering to omnichannel operation. For example, one of the two leading brands, Abercrombie and Fitch, which scored 63% of channel integration level in the above-mentioned study, now reaches a score of 92.6%.
Notably, the companies that achieve higher integration levels correspond to the top companies across each sector. This finding seems to confirm that, as in the case of services, larger companies are better prepared for the transition to digital customer-centric strategies and omnichannel retailing, leveraged by higher access to financial resources, investment capabilities and innovation (Chaparro-Peláez et al., Citation2020). This result has relevant implications for the research on omnichannel operation among SMEs: given that top retailers present higher integration levels, their data could be used as reference or target values in the creation of more precise channel integration indices (Shnorr, Citation2020), against which SMEs could compare to detect areas of improvement.
In answering RQ2, a high-level view of the results of this study provides a nuanced assessment of the current state of omnichannel retailing across the furniture, grocery and clothing sectors. For instance, regarding the number of channels used by the different brands and companies, the results show that leading furniture and clothing brands mostly operate in at least two channels – mostly physical and web stores – with some having also adopted mobile as a sales channel. In this regard, all the clothing brands have at least a dual-channel configuration. Supermarkets are much slower to embrace omnichannel operation, with only 26.9% operating in two or more channels. There are also significant differences in the degree of channel integration across sectors, but in this case the differences are more pronounced when comparing clothing brands to companies in the other two sectors. However, and as mentioned in Section 4.1, the study should probably require a larger sample size to confirm the non-significant differences found between supermarkets and clothing and apparel brands.
5.2. Indicators by group
5.2.1. Customer touchpoints
Clothing brands have been fast to serve multiple channels, understanding that customer journeys can now start and end in different channels, with customers jumping from one channel to another at their convenience. Home furnishing companies seem to have started embracing this new paradigm, but only a few supermarkets have acknowledged that the distribution of sales per channel is changing as consumer habits change, confirming the slow adoption of omnichannel in grocery (Eriksson et al., Citation2019).
While there seems to be a consensus that physical stores still have an important role to play, retailers that do not attend both the online and offline channels are at peril (Acquila-Natale et al., Citation2020), which gives a competitive edge to a small fraction of the supermarkets. Von Briel (Citation2018) suggested that moving from individual channels to integrated touchpoints will make each individual point of contact important; for example, the web as a major touchpoint, with physical stores providing unique sensory shopping experiences and mobile web and apps serving as a portal for showrooming.
Regarding the implementation of mobile apps, the explanation of the results may be related to the fact that multi-brand retailing is more typical in the furniture and clothing sectors than supermarkets, and thus given less importance by the former; nonetheless, it may represent a missed opportunity to engage with and foster loyalty from prospect customers, with the added benefits of obtaining richer customer data (Vyas, Citation2020).
5.1.2. Channel consistency
The findings from this research suggest that brands are aware of the importance of offering a consistent presence in the channels they operate, even though supermarkets and furniture still have room to improve in this area. While synchronization of products can be progressively achieved by digitalization of the brand’s catalogue, companies find it more difficult to establish synchronized prices and promotions in these two sectors because of the costs associated with outbound logistics, unless they are willing to sacrifice their sales margins in online sales. Therefore, vendors should consider how customers’ price sensitivity about their channel offering could affect their performance (Han et al., Citation2001; Wakefield & Inman, Citation2003).
5.1.3. Integrated promotion
Most vendors seem to understand that the online channel may be used as a means of driving offline traffic. However, a minority of companies are missing an opportunity to promote their online channel in physical stores, which might lead to disengagement from omnichannel shoppers. Companies in this situation should be aware of this, as the implementation of this element does not incur a high cost for the company.
5.1.4. Integrated access to information
Except for order tracking – and integrated loyalty programs, in the case of supermarkets – most companies fall short in this dimension. Whereas other dimensions are more tightly related to the reconfiguration of business processes, integrated access to information is strongly associated with the incorporation of information technologies to such processes. Therefore, the results might reflect that omnichannel operation strategies are being implemented in different phases, first by trying to adapt day-to-day operations to multiple channel configurations, and then by implementing IT-supported services to improve customer shopping experience; this way of deploying an omnichannel perspective could reflect a more traditional-retailing mindset, which might reduce the effectiveness of what should be customer-oriented strategies based on enriched customer data but with a high impact in internal processes (for example, integrated stock, shopping history), in line with Bianch et al. (Citation2016). The results also seem to reinforce the conclusions found regarding the low levels of development of mobile apps in furniture and clothing brands. The lack of mobile apps makes it difficult to implement product scanning and represents a missed opportunity to foster loyalty among customers when combined with the lack of integrated loyalty programs, which could also be related to the existence of multi-brand retailers, as mentioned above.
5.1.5. Integrated fulfilment
The non-significant differences – cross-channel gift cards, and reserve online and pay offline – refer to services that have low implementation levels. The significant differences seem to confirm, from a wider channel integration perspective, the disparities between sector and adopted business logistics models found in Marchet et al. (Citation2018) and the differences in outbound logistics configuration between food and non-food companies (Buldeo Rai et al., Citation2019). The results also show a gap between online and omnichannel retailing: while it is estimated that around 80% of e-tailers offer more than one delivery option and 62% offer more than one return option (Zarei et al., Citation2020), the present study provides a lower adoption rate of multiple options for delivery and returns, or at least a dependence on the type of product.
The nature of the product in each sector further explains the findings from this study. Basically, there are two main options for last-mile transport logistics: home delivery or consumer pick-up. Given the size and quantity of products in each purchase, it seems logical that furniture companies have so far focused on home delivery, while clothing companies make use of their physical stores to handle delivery and returns. Additionally, storing, picking and arranging home deliveries of groceries is more complex and expensive than it is for other products such as fashion (Wollenburg et al., Citation2018).
Nonetheless, omnichannel retailers should combine both options in their last-mile logistics, as convenience in receiving and returning items is the most important salient customer’s attitudinal belief (Zarei et al., Citation2020). Further, retailers, and especially supermarkets, should also be aware that click-and-collect gross margins are lower than in-store margins, partly due to the increased labour costs (Bazaarvoice, Citation2020), and should therefore carefully revise the impact of implementing this delivery option.
5.1.6. Integration of customer care services
The findings from this study are evidence of the fast diffusion pace of social media among fashion brands (Ananda et al., Citation2017), the sector that has most rapidly embraced social media, initially for marketing purposes but lately also as sales channels. Considering the wide adoption of social media platforms by consumers, supermarkets and furniture retailers should consider harnessing the capabilities of these new channels not only for promotional purposes, but also to foster customer relationship and engagement, as well as to leverage their capabilities to perform market intelligence activities (Ananda et al., Citation2016). However, creating a company profile is not enough; the effective implementation of a social media strategy also requires allocating the necessary resources and assessing the actions that leverage a company’s distinctive capabilities.
6. Conclusion
Traditional brick-and-mortar retailers are aware of the need to deploy and implement omnichannel strategies, but little is known about the extent to which they are actually executing this transition, which makes it difficult to identify key areas of improvement.
To address this research gap, the present study analysed the current state of channel integration and digital transformation of three relevant retailing sectors: home furnishing, groceries and clothing and apparel. The contributions derived from the findings of the study are relevant for theory and practice. From a theoretical standpoint, this study extends Acquila-Natale and Chaparro-Peláez (Citation2020) framework of channel integration indicators and Chaparro-Peláez et al. (Citation2020) set of indicators of digital transformation to allow for comparisons across different industries. The differences found across several indicators suggest that future research in omnichannel retailing should consider the sector under study, as the degree of implementation of omnichannel elements may vary largely depending on the distinctive features of each industry. From a managerial view, the study reveals that most retailers seemingly do not take integral and holistic approaches to implement omnichannel operation; retailers are adapting day-to-day activities to multiple-channel operation first, losing the opportunity to build integral and satisfactory customer shopping experiences at their core. In particular, most retailers seem to be especially lacking in the creation of long-term, customer-bonding services that may provide richer customer data and foster loyalty, such as mobile apps.
The present study has certain limitations. Most notably, the research covers only three sectors in a single country; while the results suggest that the situation may be similar to that in comparable contexts, such as other European countries, further confirmation of the findings from this study would be necessary. Second, the study only focuses on leading retailers, and thus provides a biased view of the three industries under analysis. Nonetheless, the results, combined with other findings in academic research and industry reports, suggest that channel integration levels among SMEs are generally lower than those found in this study. Further research is needed to determine the size of the gap between large and small companies, in order to provide a more comprehensive view of omnichannel retailing. Third, the study offers a view of omnichannel retailing from the customer’s perspective, but omnichannel retailing and the digital transformation of companies go beyond the relationship between end customers and the brand, and also include the reconfiguration of internal processes supported by Industry 4.0 technologies, which were beyond the scope of this study. A complete analysis of omnichannel retailing would require combining both. Fourth, even though the authors have attempted to update all collected information during the COVID-19 pandemic, we acknowledge that the study may fail to capture all the changes that companies have undergone since the pandemic outbreak after each data collection point. The pandemic has not only accelerated the conversion of new online shoppers, but also convinced a large majority to continue to purchase online, a shift that is likely to be permanent, transforming consumer behaviour well into the future (Bazaarvoice, Citation2020). Therefore, it is expected that many of the companies included in the analysis will continue to develop their omnichannel strategies, and therefore this study only offers a one-time snapshot of the current state of affairs. Longitudinal studies could greatly help understand the real effect of the pandemic on the digital transformation of these companies.
Disclosure statement
No potential conflict of interest was reported by the authors.
References
- Acquila-Natale, E., & Chaparro-Peláez, J. (2020). The long road to omni-channel retailing: An assessment of channel integration levels across fashion and apparel retailers. European Journal of International Management, 14(6), 999. https://doi.org/10.1504/EJIM.2020.110562
- Acquila-Natale, E., Hernández-García, Á., Iglesias-Pradas, S., & Chaparro-Peláez, J. (2020). Stay or switch? Investigating lock-in effect in multi-channel apparel retailing. Economics and Business Letters, 9(4), 298–305. https://doi.org/10.17811/ebl.9.4.2020.298-305
- Adivar, B., Hüseyinoğlu, I. Ö. Y., & Christopher, M. (2019). A quantitative performance management framework for assessing omnichannel retail supply chains. Journal of Retailing and Consumer Services, 48(May), 257–269. https://doi.org/10.1016/j.jretconser.2019.02.024
- Ailawadi, K. L., & Farris, P. W. (2017). Managing multi- and omni-channel distribution: Metrics and research directions. Journal of Retailing, 93(1), 120–135. https://doi.org/10.1016/j.jretai.2016.12.003
- Allied Market Research. (2019). Furniture market by type, distribution channel (supermarkets & hypermarkets, specialty stores, e-commerce, and others), and region: Global opportunity analysis and industry forecast, 2018–2025. https://www.alliedmarketresearch.com/furniture-market
- Ananda, A. S., Hernández-García, Á., Acquila-Natale, E., & Lamberti, L. (2019). What makes fashion consumers “click”? Generation of eWoM engagement in social media. Asia Pacific Journal of Marketing and Logistics, 31(2), 398–418. https://doi.org/10.1108/APJML-03-2018-0115
- Ananda, A. S., Hernández-García, Á., & Lamberti, L. (2015). Social media marketing in Italian luxury fashion [Paper presentation]. 5th Annual International Workshop on Luxury Retail, Operations and Supply Chain Management.
- Ananda, A. S., Hernández-García, Á., & Lamberti, L. (2016). N-REL: A comprehensive framework of social media marketing strategic actions for marketing organizations. Journal of Innovation & Knowledge, 1(3), 170–180. https://doi.org/10.1016/j.jik.2016.01.003
- Ananda, A. S., Hernández-García, Á., & Lamberti, L. (2017). SME fashion brands and social media marketing: From strategies to actions. International Journal of Web Based Communities, 13(4), 468–498. https://doi.org/10.1504/IJWBC.2017.10008795
- Azoth Analytics. (2020). Global Online Grocery Market - Analysis By Delivery method (Home Delivery, Click and Collect), Product Type, Generation, By Region, By Country (2020 Edition): Market Insight, Competition and Forecast (2020–2025).
- Bain & Company. (2020). Omnichannel strategy boosts fashion company. Bain & Company. https://www.bain.com/client-results/omnichannel-strategy-boosts-fashion-company/
- Bazaarvoice. (2020). Research report: Supermarkets 2025. https://www.bazaarvoice.com/resources/supermarkets-2025-research-report
- Beck, N., & Rygl, D. (2015). Categorization of multiple channel retailing in multi-, cross-, and omni-channel retailing for retailers and retailing. Journal of Retailing and Consumer Services, 27, 170–178. https://doi.org/10.1016/j.jretconser.2015.08.001
- Bell, D. R., Gallino, S., & Moreno, A. (2014). How to win in an omnichannel world. MIT Sloan Management Review, 56(1), 45–53.
- Bianch, R., Cermak, M., & Dusek, O. (2016). More than digital plus traditional: a truly omnichannel customer experience. McKinsey & Company.
- Briedis, H., Harris, T., Pacchia, M., & Ungerman, K. (2019, August). Ready to “where: getting sharp on apparel omnichannel excellence. McKinsey & Company, 1–7. https://www.mckinsey.com/industries/retail/our-insights/ready-to-where-getting-sharp-on-apparel-omnichannel-excellence
- Briedis, H., Kronschnabl, A., Rodriguez, A., & Ungerman, K. (2020). Adapting to the next normal in retail: The customer experience imperative. McKinsey & Company. https://www.mckinsey.com/industries/retail/our-insights/adapting-to-the-next-normal-in-retail-the-customer-experience-imperative.
- Buldeo Rai, H., Verlinde, S., Macharis, C., Schoutteet, P., & Vanhaverbeke, L. (2019). Logistics outsourcing in omnichannel retail. International Journal of Physical Distribution & Logistics Management, 49(3), 267–286. https://doi.org/10.1108/IJPDLM-02-2018-0092
- Chaparro-Peláez, J., Acquila-Natale, E., Hernández-García, Á., & Iglesias-Pradas, S. (2020). The Digital Transformation of the Retail Electricity Market in Spain. Energies, 13(8), 2085. https://doi.org/10.3390/en13082085
- Danzinger, P. N. (2020). COVID shutdowns crushed home furnishings and furniture stores. The squeeze will continue. Forbes. https://www.forbes.com/sites/pamdanziger/2020/08/30/covid-shutdowns-crushed-home-furnishings-and-furniture-stores-the-squeeze-will-continue
- de la Ballina Ballina, F. J. (1999). La investigación por pseudocompra: Interesantes aplicaciones para el Sector comercio. Investigación y Marketing, 64, 27–33.
- Dennis, S. (2018). E-commerce may be only 10% of retail, but that doesn’t tell the whole story. Forbes. https://www.forbes.com/sites/stevendennis/2018/04/09/e-commerce-fake-news-the-only-10-fallacy/
- Domański, R. (2021). How to measure omnichannel? Marketing indicator-based approach–Theory fundamentals. LogForum, 17(3), 373–385. http://doi.org/10.17270/J.LOG.2021.610
- eInforma (2020). Ranking Nacional de Empresas. https://ranking-empresas.eleconomista.es/
- Eriksson, E., Norrman, A., & Kembro, J. (2019). Contextual adaptation of omni-channel grocery retailers’ online fulfilment centres. International Journal of Retail & Distribution Management, 47(12), 1232–1250. https://doi.org/10.1108/IJRDM-08-2018-0182
- Eurostat. (2020). E-commerce statistics for individuals – Statistics explained. https://ec.europa.eu/eurostat/statistics-explained/index.php?title=E-commerce_statistics_for_individuals
- FashionUnited. (2020). Global fashion industry statistics – International apparel. https://fashionunited.com/global-fashion-industry-statistics
- Field, A. (2013). Discovering statistics using IBM SPSS Statistics (4th ed.). Sage.
- Finn, A. (2001). Mystery shopper benchmarking of durable-goods chains and stores. Journal of Service Research, 3(4), 310–320. https://doi.org/10.1177/109467050134004
- FitforCommerce. (2020). Omnichannel report idex 2020. https://www.fitforcommerce.com/items/index2020-media/
- Fitzgerald, M., Kruschwitz, N., Bonnet, D., & Welch, M. (2014). Embracing digital technology: A new strategic imperative. MIT Sloan Management Review, 55(2), 1–16.
- Friendly, M. (1994). Mosaic displays for multi-way contingency tables. Journal of the American Statistical Association, 89(425), 190–200. https://doi.org/10.1080/01621459.1994.10476460
- Gómez, M., González-Díaz, B., Martín-Consuegra, D., & Molin, A. (2017). How do offline and online environments matter in the relational marketing approach?. Economic Research-Ekonomska Istraživanja, 30(1), 368–380. https://doi.org/10.1080/1331677X.2017.1311224
- Grand View Research. (2020). Food & grocery retail market size, share & trends analysis report by product (packaged food, unpackaged food), by distribution channel, by region, and segment forecasts, 2020–2027. https://www.grandviewresearch.com/industry-analysis/food-grocery-retail-market
- Han, S., Gupta, S., & Lehmann, D. R. (2001). Consumer price sensitivity and price threshold. Journal of Retailing, 77(4), 435–456. https://doi.org/10.1016/S0022-4359(01)00057-4
- Holst, K., & Blicher, S. S. (2020). Impact omnichannel index 2020.
- Hübner, A., Wollenburg, J., & Holzapfel, A. (2016). Retail logistics in the transition from multi-channel to omni-channel. International Journal of Physical Distribution & Logistics Management, 46(6/7), 562–583. https://doi.org/10.1108/IJPDLM-08-2015-0179
- Intelligence, M. (2020). Apparel market – Growth, trends and forecasts (2020–2025). https://www.mordorintelligence.com/industry-reports/apparel-market
- Kirk, R. E. (1996). Practical significance: A concept whose time has come. Educational and Psychological Measurement, 56(5), 746–759. https://doi.org/10.1177/0013164496056005002
- Liu, X., Lan, H., & Song, G. (2018). An evaluation model of omni-channel retail logistics service integration level. ACM International Conference Proceeding Series, 80–85. https://doi.org/10.1145/3288155.3288187
- Lorenzo-Romero, C., Andrés-Martínez, M. E., & Mondéjar-Jiménez, J. A. (2020). Omnichannel in the fashion industry: A qualitative analysis from a supply-side perspective. Heliyon, 6(6), e04198. https://doi.org/10.1016/j.heliyon.2020.e04198
- Manser Payne, E., Peltier, J. W., & Barger, V. A. (2017). Omni-channel marketing, integrated marketing communications and consumer engagement: A research agenda. Journal of Research in Interactive Marketing, 11(2), 185–197. https://doi.org/10.1108/JRIM-08-2016-0091
- Marchet, G., Melacini, M., Perotti, S., Rasini, M., & Tappia, E. (2018). Business logistics models in omni-channel: A classification framework and empirical analysis. International Journal of Physical Distribution & Logistics Management, 48(4), 439–464. https://doi.org/10.1108/IJPDLM-09-2016-0273
- MarketLine. (2020). Global apparel retail. https://store.marketline.com/report/ohmf10437–global-apparel-retail-5
- Martínez Caraballo, N. (2008). Midiendo la satisfacción del cliente y la calidad del servicio: “Mystery shopping”, compra fantasma o seudocompra. Estudios Sobre Consumo, 83, 69–78.
- McDonald, M. P., & Rowsell-Jones, A. (2012). The Digital Edge: Exploiting Information & Technology for Business Advantage. Stamford, CT: Gartner. Inc.
- Mckechnie, D. S., Grant, J., & Bagaria, V. (2007). Observation of listening behaviors in retail service encounters. Managing Service Quality: An International Journal, 17(2), 116–133. https://doi.org/10.1108/09604520710735155
- McMahon, D. (2020a). New front doors: Customer journey management. Furniture World Magazine, 150(4), 8–16.
- McMahon, D. (2020b). New front doors to home furnishings retail. Furniture World Magazine, 150(3), 10–19.
- Meyer, D., Zeileis, A., & Hornik, K. (2006). The Strucplot framework: Visualizing multi-way contingency tables with vcd. Journal of Statistical Software, 17(3), 1–48. https://doi.org/10.18637/jss.v017.i03
- Patil, I. (2018). ggstatsplot: “ggplot2” Based Plots with Statistical Details. CRAN. https://doi.org/10.5281/zenodo.2074621
- Patti, C. H., van Dessel, M. M., & Hartley, S. W. (2020). Reimagining customer service through journey mapping and measurement. European Journal of Marketing, 54(10), 2387–2417. https://doi.org/10.1108/EJM-07-2019-0556
- Peltola, S., Vainio, H., & Nieminen, M. (2015). Key factors in developing omnichannel customer experience with finnish retailers. In F. Fui-Hoon Nah & C.-H. Tan (Eds.), HCI in business. HCIB 2015 (pp. 335–346). Springer. https://doi.org/10.1007/978-3-319-20895-4_31
- Piotrowicz, W., & Cuthbertson, R. (2019). Last mile framework for omnichannel retailing. Delivery from the customer perspective. In Exploring omnichannel retailing (pp. 267–288). Cham, Switzerland: Springer. https://doi.org/10.1007/978-3-319-98273-1_12
- Reis, J., Amorim, M., Melão, N., & Matos, P. (2018). Digital transformation: A literature review and guidelines for future research. Advances in Intelligent Systems and Computing, 745, 411–421. https://doi.org/10.1007/978-3-319-77703-0_41
- Rigby, D. (2011, December). The future of shopping. Harvard Business Review, 1–9.
- Rusanen, O. (2019). Crafting an omnichannel strategy: Identifying sources of competitive advantage and implementation barriers. In Exploring omnichannel retailing (pp. 11–46). Springer. https://doi.org/10.1007/978-3-319-98273-1_2
- Ryu, M. H., Cho, Y., & Lee, D. (2019). Should small-scale online retailers diversify distribution channels into offline channels? Focused on the clothing and fashion industry. Journal of Retailing and Consumer Services, 47, 74–77. https://doi.org/10.1016/j.jretconser.2018.09.014
- Salesforce. (2020). State of the connected customer (4th ed.). https://www.salesforce.com/resources/research-reports/state-of-the-connected-customer
- Shnorr, Z. (2020). Integral assessment of retail digitalization. In Economic and Social Development: Book of Proceedings, July, 33–39.
- Total Retail. (2020). 2020 top 100 omnichannel retailers. https://mytotalretail.tradepub.com/free/w_defa618
- Ulas, D. (2019). Digital transformation process and SMEs. Procedia Computer Science, 158, 662–671. https://doi.org/10.1016/j.procs.2019.09.101
- van Gelder, K. (2020). Global furniture market size from 2020 to 2027. https://www.statista.com/statistics/977793/furniture-market-value-worldwide/
- von Briel, F. (2018). The future of omnichannel retail: A four-stage Delphi study. Technological Forecasting and Social Change, 132, 217–229. https://doi.org/10.1016/j.techfore.2018.02.004
- Vyas, A. (2020). How mobile apps are redefining customer loyalty. https://www.linkedin.com/pulse/how-mobile-apps-redefining-customer-loyalty-abhi-vyas
- Wakefield, K. L., & Inman, J. J. (2003). Situational price sensitivity: The role of consumption occasion, social context and income. Journal of Retailing, 79(4), 199–212. https://doi.org/10.1016/j.jretai.2003.09.004
- Weinswig, D. (2019). Omnichannel in Europe today lessons from leading retailers. https://coresight.com/innovators/omnichannel-in-europe-today-lessons-from-leading-retailers
- Wilson, A. M. (1998). The use of mystery shopping in the measurement of service delivery. The Service Industries Journal, 18(3), 148–163. https://doi.org/10.1080/02642069800000037
- Wollenburg, J., Hübner, A., Kuhn, H., & Trautrims, A. (2018). From bricks-and-mortar to bricks-and-clicks. International Journal of Physical Distribution & Logistics Management, 48(4), 415–438. https://doi.org/10.1108/IJPDLM-10-2016-0290
- Ye, Y., Lau, K. H., & Teo, L. K. Y. (2018). Drivers and barriers of omni-channel retailing in China: A case study of the fashion and apparel industry. International Journal of Retail & Distribution Management, 46(7), 657–689. https://doi.org/10.1108/IJRDM-04-2017-0062
- Zarei, M. M., Agudo-Peregrina, Á. F., & Ponce-Cueto, E. (2020). Choosing the delivery and return method in purchases: The effect of situational factors in omni-channel contexts. Economic Research-Ekonomska Istraživanja, 33(1), 2120–2137. https://doi.org/10.1080/1331677X.2019.1596825
- Zarei, M. M., Chaparro-Pelaez, J., & Agudo-Peregrina, Á. F. (2020). Identifying consumer’s last-mile logistics beliefs in omni-channel environment. Economic Research-Ekonomska Istraživanja, 33(1), 1796–1812. https://doi.org/10.1080/1331677X.2020.1760914
- Zeileis, A., Meyer, D., & Hornik, K. (2007). Residual-based shadings for visualizing (conditional) independence. Journal of Computational and Graphical Statistics, 16(3), 507–525. https://doi.org/10.1198/106186007X237856
Appendix A:
List of companies & brands included in the study
Table A1. List of companies included in the study categorized by sector.
Appendix B:
Association plots of channel integration and digital transformation indicators
Figure B1. Association plots of customer touchpoints indicators.
Source: Authors.
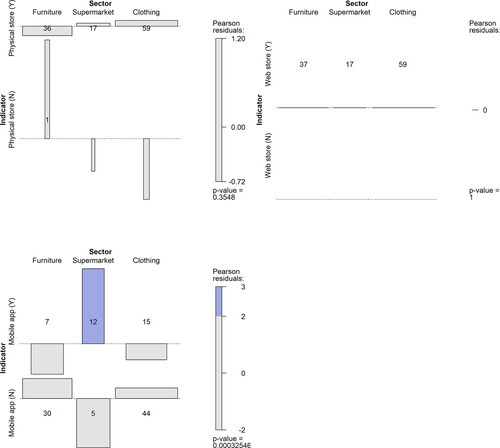
Figure B2. Association plots of channel consistency indicators.
Source: Authors.
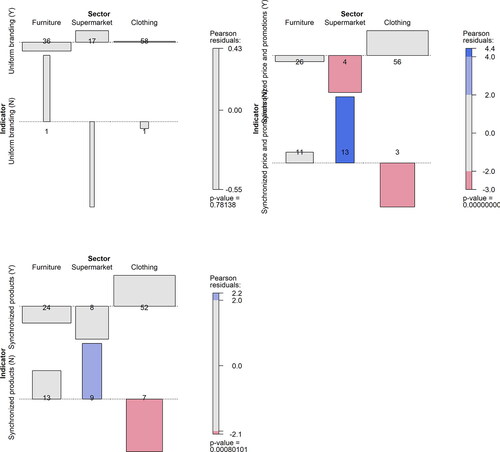
Figure B3. Association plots of integrated promotion indicators.
Source: Authors.
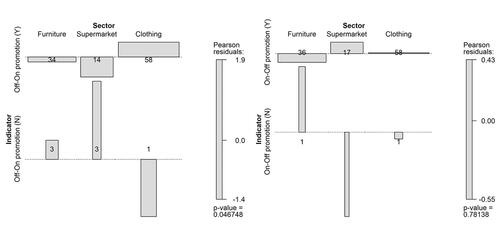
Figure B4. Association plots of integrated access to information indicators.
Source: Authors.
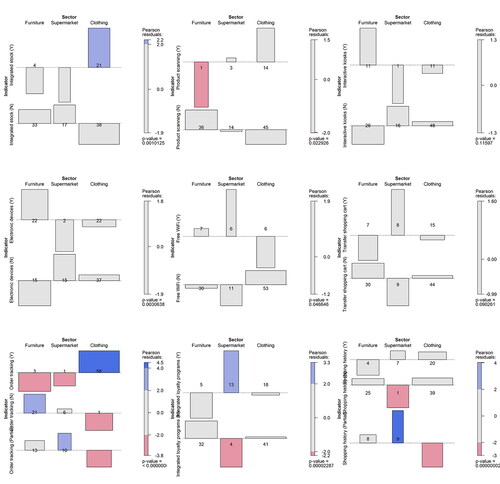
Figure B5. Association plots of integrated fulfilment indicators.
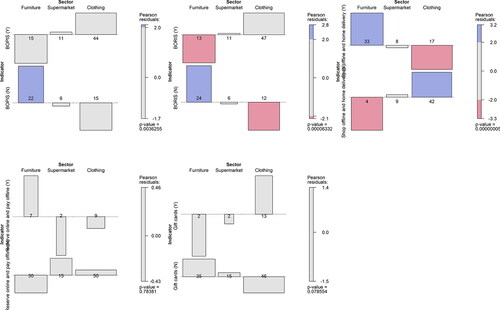
Figure B6. Association plots of integrated customer services indicators.
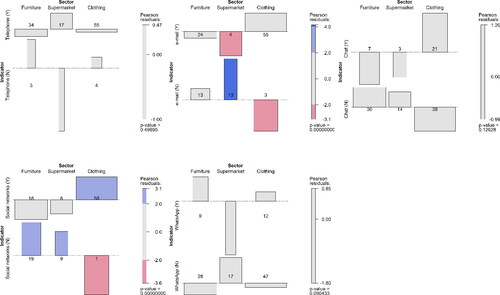
Figure B7. Association plots of digital transformation indicators.