
 ?Mathematical formulae have been encoded as MathML and are displayed in this HTML version using MathJax in order to improve their display. Uncheck the box to turn MathJax off. This feature requires Javascript. Click on a formula to zoom.
Abstract
This study attempts to empirically estimate the interdependence between COVID-19, tourism market, oil prices, and sustainable climate in United States. In doing so, we employ an advanced Morlet’s wavelet approach, namely, Wavelet coherence transform (WCT), Partial and Multiple Wavelet Coherence and found a strong co-movement between variables, which is varied across the time scales, indicating the initial, peak, and after peak effect of COVID-19 on tourism market, oil prices, and carbon emissions using daily data from 6 March 2020 to 6 August 2020. The visuals of WCT exhibit a cyclic (anti-cyclic) relationship between tourism and oil prices, suggesting a strong positive (negative) co-movement in the shorter and longer (medium) period. Tourism and carbon emissions possess a strong positive co-movement across all periods except in the medium run; however, the intensity of this movement is higher in the very short-run compared to medium and longer-run. The results reveal an anti-cyclic association between COVID-19 and tourism, and COVID-19 is leading tourism with strong negative co-movements. Finally, the results describe that carbon emissions and COVID-19 are anti-cyclical and display a positive causality in the shorter run. These results offer valuable guidelines for all stakeholders.
1. Introduction
On 31 December 2019, the Wuhan Municipal Health Commission reported several respiratory symptoms cases (ECDC (European Center for Disease Prevention & Control), 2020). In 10 days, similar cases were reported from Japan, South Korea, and Thailand alongside other regions of China (WHO, Citation2020a). In a few weeks, it became clear that the world was facing one of the most dangerous epidemics of history. To prevent the transmission of the virus, all over the world strong precautions were put into effect, which mainly targeted social distancing and limitation of social mobility. Despite all these efforts, the virus kept spreading, and till the end of August 2020, more than 23 million patients and 800,000 deaths have been reported across the globe (WHO, Citation2020b). Besides, the restrictions used for the fight against the virus have had pronounced impacts on the global economy. Even though no sector was immune, it was the tourism and travel industry that suffered the most. Apart from that, it affects the dynamics of carbon neutrality across globe, particularly in the U.S. While struggling with the problems triggered by the COVID-19 epidemic, the global economy was also hit by oil price shocks (Shahzad et al., Citation2021; Umar et al., Citation2021). In March 2020, the oil price experienced the most significant drop since the Gulf war. Although COVID-19 caused many socio-economic problems, early studies provide evidence that it has reduced the pressure on the environment. The aforementioned developments have created an urgent need to investigate the possible linkages from COVID-19 to tourism, oil prices, and environmental sustainability.
Because of the rapid spread of COVID-19 and the alarming increase in infected cases and deaths, governments had to enforce many precautions, such as border shutdowns, community lock-downs, restrictions of unnecessary travel and mobility, quarantine, shelter-in-place orders, and campaigns of self-isolation/social distancing (Khan, Razzaq, et al. Citation2021; Yu et al., Citation2021). Although these measures slowed down the spread of the virus, they caused the global economy to deteriorate. Social isolation policy led to a significant reduction in industrial production, consumption, utilisation of services, and international trade. With the economy coming to a standstill, concerns in the society about job security raised, public confidence eroded, and expectations about the prospects of the economy worsened. In this process, all sectors have been negatively affected (Fernandes, Citation2020). For example, imposed restrictions on face-to-face education affected more than 900 million learners (UNESCO, Citation2020). Reduction in consumption led to a 20% price drop in agricultural commodities prices. The volatility of financial markets increased significantly, and many stock markets experienced historical price falls (Gormsen & Koijen, Citation2020). These developments fuelled the fears of financial collapse, recession, and possibly economic depression. The detrimental effects of COVID-19 are comparable with the Global Financial Crisis or even wars. As a reference to the gravity of the situation, this period has been named as ‘Coronanomics’ (Eichengreen, Citation2020), ‘Black Swan’ (Petro, Citation2020), and the ‘Great Compression’ (Harvey, Citation2020).
Several recent studies explore the impact of COVID-19 on financial and economic markets. Among those studies, Rizvi et al. (Citation2020) exposed COVID-19 impact on high/low risk in terms of size and investment strategy. Mirza, Naqvi, et al. (Citation2020) examined mutual funds stability and their niche investments in social enterprises. Similarly, Yarovaya et al. (2020) confirmed that during the COVID-19 pandemic, the equity funds that were ranked higher in human capital efficiency outpaced their counterparts. Mirza, Rahat, et al. (Citation2020) found that tax deferrals are significant solutions amid set of modest worsening in economic conditions. In case of aggravating business shocks, there should be hybrid provision through debt and equity to avoid a breakdown. Rizvi et al. (Citation2020a) estimated a substantial loss in market valuations of all sectors due to an increase in cost of equity and decline in sales volume. Similar outcomes are endorsed by Yarovaya et al. (Citation2021), where they showed a significant deterioration in asset quality across exposure types, institutional size, and countries’ profile. These studies echoed a substantial impact of COVID-19 on business and financial markets.
Although no sector has been immune to COVID-19 spread, the effect of the pandemic on the travel-tourism industry (Sönmez et al., Citation2020) and the accommodations sector is devastating (AHLA, Citation2020; Wu et al., Citation2021). In addition to international and in-country travel restrictions, every kind of large gathering, including sporting events, conferences were banned in order to decelerate the spread of the virus. These sanctions caused an abrupt drop in demand for the products of the tourism industry, increased uncertainty about the future, and have left the industry vulnerable (Nguyen & Coca-Stefaniak, Citation2020). Although there are different estimations and projections about the impact of COVID-19 on the tourism industry, all of them point to a catastrophic situation. As of April 15, 80% of the hotel rooms were empty in the U.S., and airlines cut their workforce by 90% (Donthu & Gustafsson, Citation2020). According to estimates of UNWTO (Citation2020), the global drop in international tourist arrivals is close to 80%, which causes a loss of U.S.$1.2 trillion and more than 100 million job losses in the sector. WTTC. (Citation2020) estimated 75 million jobs loss and more than 2.1 trillion U.S. dollar loss in the turnover of the industry. Compared to September 11, the impact of COVID-19 is seven times larger, which represents the largest historical decline. Given that the tourism industry is the biggest employer globally and the leading industry for several countries (UNWTO, Citation2020), it is inevitable that these losses will have long-lasting adverse effects on the economy. Hence, it is vital to document the impact of COVID-19 on the tourism industry and propose policy recommendations to alleviate the problems urgently.
As the economy grappled with the effects of the epidemic, another shock came from the oil market. The oil price has always been volatile, and it reacts to global problems quite abruptly. For example, in 2008, oil prices ranged between $145 and $30. Although, for a few years following the Global Financial Crisis, there was relative stability in the oil market, before the COVID-19 epidemic, the oil market was already facing several challenges from both supply and demand side. Refinery capacity increases, vehicle efficiency measures, more intense use of alternative energy sources, and geopolitical problems were already affecting the oil market. However, COVID-19, similar to financial crises, added a significant amount of uncertainty to the oil market. Since the global financial crisis for the first time, global oil demand has contracted in the first quarter of 2020. On February 20, oil prices began to drop drastically and went below the 20$band on April 20. More interestingly, for the first time, the U.S. oil futures contract became negative, which means that ‘some traders paid buyers to take oil off their hand’ (IEA, Citation2020). Although following May, with the help of a gradual normalisation period and the end of the price war between Russia and Saudi Arabia, oil prices began to recover progressively, they are still below the pre-COVID-19 period, and uncertainty in the oil market has not disappeared (Mi et al., Citation2021).
Historically, the primary aim of the nations was to increase their production capacity and national wealth. However, for the last several decades, owing to the growing environmental problems, mainly global warming, and the overuse of natural resources, the new challenge has become sustainable economic growth (Ullah et al., Citation2020). A positive relationship between economic growth and environmental degradation, especially for the early phase of economic development, has been documented by many researchers. A higher growth rate requires intense use of energy, which has been satisfied primarily with fossil fuels. According to the Intergovernmental Panel on Climate Change (IPCC, Citation2014), fossil fuel use is responsible for 78% of the increase in GHG emissions between 1970 and 2010. Although the standard model links the energy use and environmental pollution through economic growth, a relatively more recent strand of literature takes into account the role of energy prices as well (Apergis & Gangopadhyay, Citation2020). There is a lot of empirical evidence that high oil prices limit the use of oil, create an incentive for alternative energy sources, adoption of more energy-efficient technologies, and hence contribute to the environmental protection (Dong et al., Citation2017; Saboori et al., Citation2016). The recent study of Li et al. (Citation2019) also confirms that higher energy prices lessen environmental degradation for the case of China. Recent price movements in the oil market provide a suitable framework to test the relationship between oil prices and air pollution.
The relationship between tourism, environment and energy use is another research topic that attracts the attention of researchers for a long time (An et al., Citation2020; Khan, Rehman, et al., Citation2021; Razzaq et al., 2021; Citation2021a; Rehman & Sohag, Citation2021). In their early study, Tabatchnaia-Tamirisa et al. (Citation1997) investigated the role of tourists on energy use in Hawaii by using input-output analysis. Their findings show that about 60% of total energy and fuel use is due to tourist arrivals. Also, they claim that because of the different intensity of energy use of domestic and foreign tourists, an increase in the proportion of international tourists will increase energy use. The recent developments show that both the increasing number and the mix of tourist arrivals to Hawaii will affect energy use significantly. The change in the country’s energy use will also have an impact on air pollution.
COVID-19 has significantly slowed social and economic life. Less social mobility and economic activity resulted in a reduction in the need for energy use. Based on this, it is suggested that despite all the damage it has caused in the socio-economic sphere, COVID-19 may positively affect the environment. Empirical results obtained by some recent studies support the idea that the only desirable outcome of COVID-19 may be its contribution to environmental quality (Mahato et al., Citation2020; Mandal & Pal, Citation2020; Razzaq et al., Citation2020). Zambrano-Monserrate et al. (Citation2020) claim that social distancing leads to reductions in greenhouse gas emissions globally. This positive effect is even more intense in densely populated areas. Pata (Citation2020) investigated the impact of COVID-19 on PM2.5 emissions for eight U.S. cities and found evidence that the epidemic alleviated pollution. However, there is also a possibility that oil prices, which drop significantly due to the COVID-19, could increase global oil demand. Most academic research so far has used data for the first phase of the outbreak, which can be characterised by an extreme economic recession. During this period, the low energy price was not sufficient to increase energy demand. Therefore, with the renormalisation period, the preliminary empirical findings might change. All these factors point a multifaceted and highly engaging relationship between oil price, air pollution, and COVID-19, which is worth further investigation.
Hawaii is a well-known tourist centre. Tourism has been the backbone of modern Hawaii’s economy and is the most critical sector for GDP growth, private investment, and employment generation (DBEDT, Citation2014). Tourism is a success story for Hawaii. For both the number of visitors and spending, there was an eighth consecutive year of record growth since 2011 (HTA, Citation2019a). In 2019 about 10.5 million visitors spent $17.75 billion and contributed to $2.07 billion in state tax revenue. In 2009, 134.000 jobs were supported by the tourism industry; as of 2019, this number increased to 216.000 (HTA, Citation2019b). Since 2012, hotels reported full occupancy. Due to its success in tourism, at the end of 2017, the unemployment rate of Hawaii reduced to 2%, the lowest ever recorded in any U.S. state (UHERO, Citation2018).
However, following the COVID-19 outbreak, Hawaii had to make a decision to protect the public health, and on March 21, announced that visitors must quarantine for 14 days. Although this decision helped Hawaii to preserve human life, the economic cost of the decision was devastating. The accommodation and food services industry in Hawaii took a very hard hit. As of August 27, tourist arrivals and hotel occupancy rates declined more than 90% compared to 2019 figures, which led to a skyrocket of unemployment. In the tourism relates sectors, there were tremendous job losses where more than 50,000 jobs were eliminated (DBEDT, Citation2020a). According to the report of the Economic Research Organization at the University of Hawaii (UHERO, Citation2020), the state deficit is far worse than the Great Depression level. Although Hawaii started its reopening process in June, there has been no significant improvement. It is predicted that it will take several years for Hawaii to reach its 2019 level in tourism (DBEDT, Citation2020b).
In this study, we examine the post pandemic interlinkages between tourism markets, oil prices, and climate in United States. Our research will have several contributions to the literature. Given the detrimental effects of the epidemic on the tourism industry, there are efforts to document these effects. Naturally, this strand of research in its early stage, and most of the research is in the form of case studies or depends on simple descriptive statistics (Zenker & Kock, Citation2020). Some other studies apply more informative research methods; however, early studies have limited data, which does not cover the reopening process. Hence, although these studies provide important insight into the preliminary effect of the epidemic, they have limited use in general. Our data cover the period until the end of August 2020, which provides information for both the immediate post-crisis and reopening periods. It is important because the effect of COVID-19 on air pollution might differ in time due to the reasons given above. Also, we use the time and frequency domain approach, which provides rich information about the relationship between the variables under investigation and has greater policy relevance.
Apart from significant theoretical contribution, this study utilises novel empirical methodology popularised as ‘partial and multiple wavelet coherence’ (PMW). This approach offers complete and diverse insights into the time and frequency domain association among the model parameters, which provides rich information through frequency-level disintegration (Aguiar-Conraria et al., Citation2008). Besides, the PMW estimator possesses exceptional strength in traditional time-series frameworks, particularly for non-stationary series (Roueff & Von Sachs, Citation2011). Finally, the PMW estimator visualises the degree of association among the model parameters, integrates the dynamic linkages over time, and the lead-lag position of variables in short, medium, and long periods. The data and methodology we employed enable us to put forward a detailed picture of the investigated relationships and provide meaningful policy recommendations.
The rest of the study is organised as follows: Chapter two explains data and methodology; chapter three covers results and discussion, while chapter four provides policy implications and conclusion.
2. Material and methods
2.1. Data
This study uses daily data of tourist arrival, air quality (emissions), oil prices and the number of COVID-19 cases that are sourced from the Hawaii Tourism department (H.Gov, Citation2020)1, federal research bank (Fred, Citation2020)2, environmental protection agency (EPA, 2020)3, and United States facts (US, Citation2020)4. Tourist arrival captures tourism growth, oil prices proxy the economic shocks, air quality index (carbon emissions measure) capture the level of environmental pollution discourse Ozone and PM 2.5, while the number of COVID-19 cases represents the intensity and scale of this pandemic. The data of each series has transformed in log return starting from March 6, 2020, to August 06, 2020. reports the descriptive statistics and correlation matrix. All model variables possess a positive mean, and AQI shows maximum return value amongst other model variables. Tourist arrivals show a higher standard deviation that confirms higher volatility in tourism, followed by COVID-19. The Jarque-Bera (JB) test statistics and probabilities values reject the null hypothesis of the normal distribution for all data series at a 1% significance level, indicating that tourism, oil prices, air quality, and COVID-19 are not normally distributed. The correlation statistics suggest that oil prices, AQI, and tourism are positively correlated while oil and AQI are negatively correlated at a 10% level of significance. Since our data has confirmed non-normality, thus correlation statistics might provide misleading outcomes that were calculated based on mean effect.
Table 1. Results of descriptive statistics and correlation.
2.2. Methodology
2.3. The wavelet coherence (WC)
To draw the dynamic link between two-time series, the wavelet coherence approach is prominently utilise based on a bivariate structure. Initially, we pronounce cross wavelet power (CWP) and cross wavelet transform (CWT) to provide a rational explanation of wavelet coherence. The empirical framework of CWT between two-time series i.e., x (t) and y (t) is popularised by Torrence and Compo (1988).
2.4. The Continuous Wavelet Transform (CWT), Partial Wavelet Transform (PWT), and Multiple Wavelet Coherence (MWC)
Initially, this study applies Continuous Wavelet Coherence to point out the variation in given series such as tourism (TOR), air quality index (AQI), oil prices (Oil), and COVID-19 (COVID) against the different time and frequency scales. Moreover, the PWC approach enables to integrate the wavelet coherence between two variables and
by simultaneously removing the impact of the third variable
Last, this study also applies Multiple Wavelet Coherence (MWC) to visualise co-movement or multicorrelation between variables across different time scales. The detailed derivation and formulation of wavelet approaches can be found in Sharif et al. (Citation2020, Citation2017), Raza et al. (Citation2019) and Torrence and Compo (Citation1998).
3. Results and discussion
Before moving to the analysis of Wavelet coherence visual depiction, it is imperative to affirm the stationarity level of model variables. In doing so, we have applied both augmented Dickey-Fuller (ADF) and Zivot and Andrews (Citation1992) (ZA) unit root tests. ZA unit root test is superior to ADF based on the consideration of structural break in time series. From , the results of ZA and ADF tests show that all variable series are non-stationary at level while turns stationary at the first difference at a 1% level of significance. Furthermore, the ZA unit root highlights structural breaks in all model variables, suggesting structural changes in data series. Apart from structural breaks, the JB statistics highlighted that the model variables are not normally distributed. Thus; traditional empirical methods failed to integrate all these complexities. In compliance, this paper employs a novel Marvel Wavelet Transformation Method, which efficiently deals with these issues and produces robust estimates.
Table 2. Results of unit root test.
3.1. Wavelet correlation
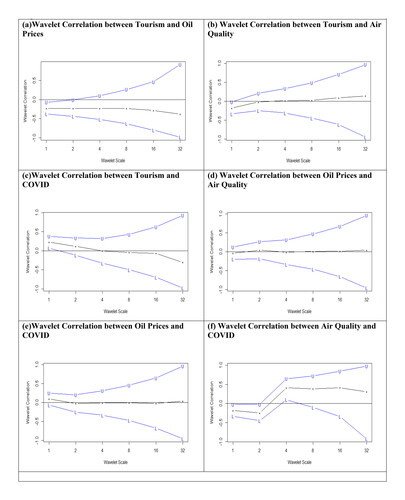
represents the findings of the Wavelet Correlation between tourism, oil prices, air quality, and COVID in Hawaii. represents a steady negative association between tourism and oil prices in the shorter, medium, and longer periods, however, in very longer period the negative effect turns more pronounced. Figure1b illustrates a negative correlation between tourism and AQI in the shorter-run, while this effect turns zero in the medium run and gained positive values from longer to very longer run. signifies a diminishing positive correlation between tourism and COVID in a shorter-period, while an increasingly negative relationship is observed from medium to longer-period. This indicates that at the initial level of COVID, tourists may serve as virus transmission channels, however after worsening the situation both variables counteract each other in the longer-run due to stringency measures in Hawaii State. portrays almost zero correlation between oil prices and AQI in the shorter, medium, and longer run. From , results show no correlation between oil prices and COVID except marginal positive decreasing (increasing) correlation in the shorter-run (longer-run). visualise that, Wavelet correlation between AQI and COVID, indicating a decreasing negative correlation in very shorter-run (1-2), increasing positive correlation between shorter run (2-4), a positive constant correlation between shorter to longer run (4-16), and lastly diminishing positive correlation from longer to very longer-run. This implies that at the initial level of COVID air pollution decreases due to restricted economic activities, however, in the medium and longer run the stringency measures gradually relax that boost halted economic activities, energy consumption, and related emissions.
Figure 1. Results of wavelet correlation between TOR, OIL, AQI, COVID.
Wavelet Scale represent 1,2,4,8,16,32 for short, very short, medium, long, and very long run.
Source: Authors estimations and drawing.
3.2. Continuous Wavelet Transform (CWT)
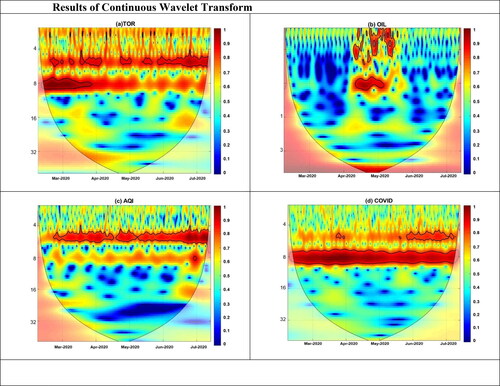
The study further employs Continuous Wavelet transform to demonstrate the movement of each data series in 3 D contour graphs include; time, frequency, and colour band. The CWT illustrates the association between the concerned variables based on MODWT. From 2, we observe diverse characteristics of TOR, AQI, Oil prices, and COVID in different time-frequency domains. reflects a constant variation in a shorter period (4-8) across multiple small contours spread from March to July, while there is no significant variation in tourism in the longer-run across all months. shows significant variation in shorter-run (1-8) spread over small red contours in the month of May. Except for May, there is no significant variation in oil prices in any period and time-frequency domain. This attributes to the peak time of COVID when oil prices are fluctuated significantly due to negligible demand across the globe. show significant variation in AQI and COVID in shorter run (4-8) in a patch spread across the whole-time domain starts from March to July. The overall visuals of CWT show that the model variables are inherited with distinct variations across different time and frequency scales. This suggests employing appropriate techniques that efficiently draw the direction, movement, and coherence at a diverse time and frequency scale.
Figure 2. Results of continuous wavelet transform.
Note: X-axis represents the time whereas, Y-axis shows the period (in days). The thick black contour represents the 5% significance level against the red noise.
Source: Authors estimations and drawing.
3.3. Results of Wavelet Coherence Transform (WCT)
The results of Wavelet Coherence Transform show diverse outcomes. visualise a strong positive co-movement between tourism and oil prices in shorter period (1-4 period), where both variables are in phase, representing a cyclic effect where variables lead each other (upward right and downward right tilt arrows) in multiple isles located across the whole-time horizon. In the medium run (4-8 period), oil prices lead tourism (anti-phase) and show negative movement (downward left tilt arrows) for the month of March. On the other hand, oil prices lead (lag) tourism, locate at in-phase (out of phase) in May-2020 (July-2020), and display a positive (negative) movement with tourism (upward right (left) tilt arrows). In the long-run and very longer run (8-16 and 16-32 period), three islands are in-phase (upward right tilt arrows) suggesting that oil prices leading tourism with positive co-movement mainly from the month of March 2020 to May 2020. Concluding, in the shorter and medium run, both variables lead each other and illustration both positive and negative co-movement, however in the long-run oil prices lead and possess a positive association with tourism across whole time spam.
Figure 3. Results of wavelet coherence transform.
Note: X-axis represents the time whereas, Y-axis shows the period (in days). The thick black contour represents the 5% significance level against the red noise.
Source: Authors estimations and drawing.
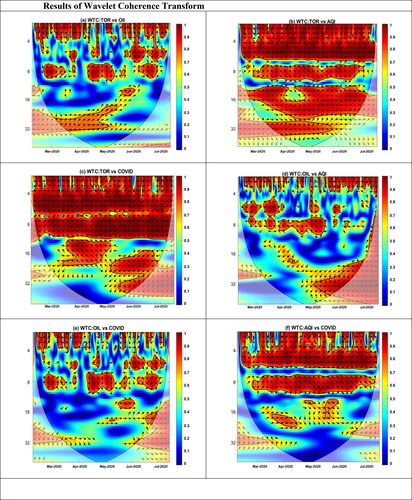
In the shorter and longer period (1-4 and 8-16), represent two large islands expand from March to July, mainly suggests a strong positive co-movement (horizontal, upward/downward arrows) between Tourism and AQI across the whole-time horizon. In the medium run (4-8 period), tourism lead AQI (anti-cyclic) and shows negative co-movement (upward left tilt arrows) for the month of March to July. This indicates that tourism and AQI possess a strong positive co-movement across all periods except medium run, whereas the intensity of this movement is higher in very short-run as compare to medium and longer-run.
In the shorter and medium period (1-4 and 4-8), visualise a large island representing that COVID is leading tourism with strong negative co-movements (horizontal/downward arrows)) across all time spam from March to July. In a longer and very longer period (8-16 and 16-32), anti-cyclic effect is observed and tourism is leading (lagging) COVID with negative co-movement (upward/downward left tilt arrows) mainly from March to May (May to July) in two islands. Overall, results show diverse co-movement across different time frequencies and highlighting that COVID is leading tourism in the shorter and medium run with a strong negative association. In the longer-run at initial phases of COVID (March to April) tourism lead COVID with negative co-movement while in the later period of COVID (May to July), tourism lag COVID with a negative association. These results indicate the impact of lock-down, border, and air space closure to prevent COVID-19 in Hawaii, which significantly reduces the number of tourist visitors at that particular time. However, in the longer run, this negative effect is weakening due to relaxation in lock-down measures across the globe.
displays a strong negative co-movement (downward/upward left tilt and horizontal arrows) between oil and AQI, showing an anti-cyclical effect in shorter run across multiple islands from March to July. A similar outcome is observed in the medium run (4-8) from March to May, however, oil prices are leading (lagging) AQI in medium-run (shorter-run). In very longer run (16-32), one island ranged from May to July also shows negative co-movement and AQI mainly lead oil prices. The overall results report a strong negative co-movement between oil prices and tourism and in the shorter-medium run oil prices lead AQI while in the longer-run AQI lead oil prices.
From , oil prices and COVID are cyclical and shows a strong positive co-movement (upward/downward right tilt arrows) in shorter-run (1-4) across different island spread over the whole-time horizon. In shorter-run both variables lead each other across different islands. In three islands located at the rightest edge of medium rum (4-8), a negative (positive) causality is observed from June to July and COVID leading (lagging) oil prices. In the same period, a positive (negative) causality is observed between oil prices and COVID from the month of March (May-June) in two islands located on most left of the y-axis. The results show significant variation across different time and frequency scales, implying that higher volatility in oil prices is attributed to lower and halted economic activities during peak COVID time. In the medium run, COVID negatively lead oil prices, this was the peak time of COVID, when stringent lock-down was in place to contain the spread of virus.
From , AQI and COVID are anti-cyclical and exhibit a positive causality (upward right tilt arrows) in the shorter-run (1-4) across all time horizon starts from March to July. However, in the medium-run, COVID is lagging AQI and shows a strong negative causality from March to July. This is mainly attributed to the peak time period of COVID, which curtail economic activities and closure of cross-border tourism, causing a significant reduction in environmental pollution. Moreover, in the longer and very longer run, two islands show a weak positive causality (horizontal, downward right tilt arrows) for the month April and June, suggesting that easing lock-down measures, revival of economic activities, and respective energy and fuel consumption caused to increase pollution.
3.4. Results of partial and multiple wavelet coherence
Multiple and partial wavelet techniques are similar to full and partial correlation that helps to identify the resulting wavelet coherence between two-time series before and after eliminating the influence of their common dependence. In the real world the relationship between two variables is augmented by other variables, particularly in wake of COVID-19; where tourism, oil prices, and AQI have mutual coherence; thus, to integrate the same we apply both Partial wavelet coherence (PWC) and Multiple wavelet coherence (MWC). The primary findings reveal a significant coherence between the series at different time-frequency combinations.
represents PWC between oil price and tourism while controlling for AQI. A few small and two large red-coloured contours can be observed in the frequency bands 1-4 and 4-8 periods respectively, indicating short-run (medium run) coherence between oil prices and tourism for the month of March, April, June, and July (March and July). The contours are embodied with red colour which is scaled on a vertical correlation bar; red colour denotes higher intensity of coherence relationship while blue colour shows lower intensity. The overall results of PWC show that there is a weak and insignificant impact (coherence) of (between) oil prices on (and) tourism in the longer run. visualises the outcome, where the effect of AQI is incorporated while estimating coherence between oil prices and tourism. After incorporating AQI impact in MWC, the results show a strong (moderate) coherence in shorter and medium period (1-4 and 4-8) (long and longer period 8-16, 16-32). Interestingly, strong coherence among variables is observed both in the short-run and log-run across the whole-time spam starts from March to July. Unlike PWC, the results of MWC confirm the relevance of AQI to establishing the impact of AQI on tourism.
Figure 4. Results of partial and multiple wavelet coherence.
Note: X-axis represents the time whereas, Y-axis shows the period (in days). The thick black contour represents the 5% significance level against the red noise.
Source: Authors estimations and drawing.
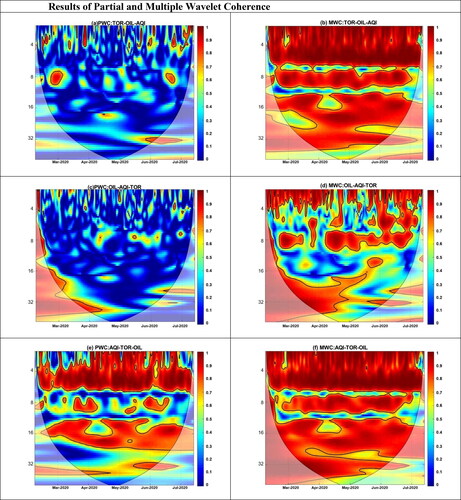
Figure 4. Continued.
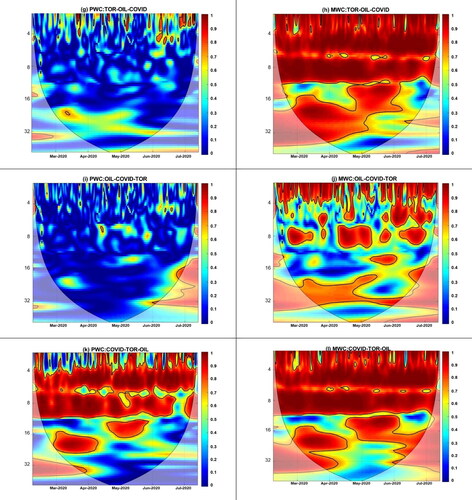
Figure 4. Continued.
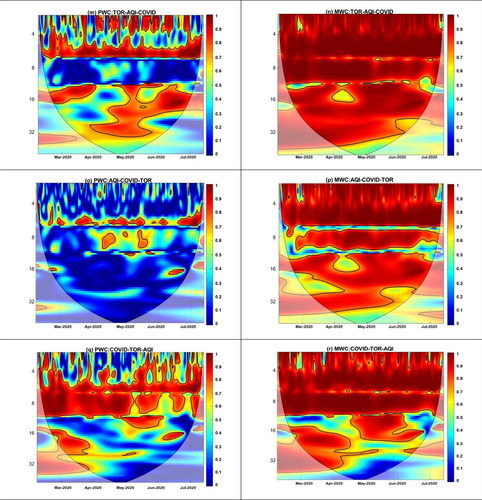
Figure 4. Continued.
, show the PWC between AQI and oil prices by treating tourism constant. The visuals confirm that AQI has no significant impact on oil prices in all periods except very small island (black lined red contour) in shorter period (1-4) for the month of May and July. After considering tourism in establishing the co-movement between AQI and oil prices, shows a strong impact of AQI on oil prices in shorter (1-4) and medium run (4-8) across the whole-time horizon. Unlike shorter and medium run, the coherence between AQI and oil prices are only pronounced from April to May in longer run (16-32) and the intensity of this relationship turns weaker (0.7) when moving rightwards unlike the short run where this correlation gains maximum score (0.90) in relationship matrix.
portrays the impact of tourism on AQI by considering oil prices constant. The image confirms a strong (moderate) coherence between both variables in shorter period (1-4) (longer period 8-16) from March to July. In the medium run (8-16) tourism impact AQI in three significant islands for the month of April and June. visualise that oil prices stimulate the correlation between tourism and AQI in shorter, medium, long, and very longer run (1-4,4-8,8-16,16-32) across all months. The overall results suggest that tourism strongly affect AQI only in the shorter run, however after considering oil prices into tourism-AQI relationship, a strong coherence is observed across all time frequencies and time domain.
displays the PWC between oil prices and tourism while cancelling out the effect of COVID. A week negligible impact of oil prices on tourism is observed in the shorter-run (1-4), mainly in the month of April to July. In the medium and longer run, no coherence is observed across the entire time horizon accept a small island located in period 16-32 for the month of March. represents a strong coherence (impact) between (of) oil prices and (on) tourism in the presence of COVID in MWC. After integrating COVID impact, the results display a strong coherence in shorter and medium period (1-4 and 4-8) across all months. In the long and very longer run (8-16, 16-32), a large island spread from March to July shows moderate coherence between oil prices and tourism. Concludingly, COVID stimulates the impact of oil prices on tourism, which is mainly ascribed to the economic shocks of COVID-19. In the peak time of COVID, tourism and oil prices both fluctuate amid raising lock-down measures and reducing economic activities.
shows a week (negligible) coherence between COVID and oil prices mainly in shorter and medium run represented by very small island for the month of April and July. However, after including tourism impact in COVID-OIL relationship, confirm strong coherence between COVID and oil prices in shorter period (1-4) across different island spread over the whole-time horizon start from March to July. In the medium run (4-8), three main contours represent strong co-movement for the month of March, May, and July, while longer run (16-32) reflect moderate correlation for the month of April to June. This indicates that coherence between COVID and oil prices is drove by tourism, highlighting the relevance of tourism industry in defining Hawaii’s COVID impact on other socio-economic indicators.
l demonstrates the impact of tourism on COVID with and without incorporating oil prices in MWC and PWC, respectively. Both visuals indicate that in shorter (1-4) and medium run (4-8), a strong co-movement is observed between tourism and COVID from March to July, while longer run confirms moderate coherence in two islands for the month of April and June. Overall, tourism effect COVID and the integration of oil prices in this relationship overstress this impact.
establishes the impact of AQI on tourism while considering COVID constant. The visuals portray a strong coherence between AQI and tourism mainly in the medium run (4-8) across all months in a hill shape series. In the longer and very longer run, the impact of AQI on tourism is weaker in two islands spread from March to June. In MWC, the COVID significantly alters the relationship between AQI and tourism. After considering COVID impact, shows a strong positive correlation between AQI and tourism in shorter, medium, and longer run for all time periods (March to July). The dense island portrays that COVID is an exogenous shock that amends the intensity of the prevailing relationship between tourism and AQI.
shows an insignificant and week impact of COVID on AQI in a shorter and very longer run across all months except medium run (4-8), where small islands show coherence between COVID and AQI by considering tourism constant. On the other hand, portrays that tourism significantly alters the relationship between COVID and AQI across shorter, medium, and longer run which is spread over all months in three main horizontal islands. These results highlight that tourism plays a pivotal role in establishing the relationship between COVID and AQI. This is mainly attributed to the economic structure of Hawaii where 60% of the industry, employment, and economic activities are driven by tourism. Thus, it is imperative to add tourism as a moderating variable in establishing any relationship in Hawaii.
shows a strong (moderate) coherence between tourism and COVID mainly in medium (shorter) run spread over root-shape contours from the month of March to July. In the longer run, a moderate impact of tourism on COVID is observed only in the month of March and June in two oval shape islands. After incorporating AQI in establishing the impact of tourism on COVID, depict a very strong co-movement between tourism and COVID in shorter, medium, and longer run for all months. In the very longer run, two contours show moderate correlation mainly for the month of April and June. Concludingly, AQI has greater relevance while estimating the association between tourism and COVID, suggesting that in the presence of AQI the impact of tourism turns stronger. Although tourism can affect COVID due to social connection, and movement of people, however, this ratio is further intensity in the presence of AQI because COVID is a respiratory disease and significantly affected by air pollution (Razzaq et al., Citation2021).
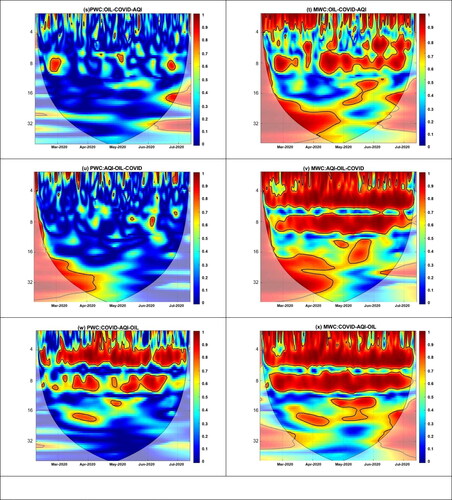
indicate no partial coherence between oil prices and COVID except March and July in the medium run. Contrarily, represents a strong coherence between the same covariates in the presence of AQI in MWC function, which can be observed in the shorter and medium run. shows the same pattern, where oil prices have a negligible impact on AQI. However, visualise a strong coherence between oil prices and AQI in the shorter and medium run across all time domain. demonstrates a moderate coherence between COVID and AQI in small patches across the shorter and medium run. However, after integrating oil pricing in established COVID-AQI relationship, displays strong coherence in two thick islands spread over the whole-time horizon in the medium and shorter run.
The overall results confirm the mutual dependency of relationship and interestingly COVID-19 significantly alters the coherence (co-movements and causality) between different pairs of covariates in our model. These results reiterate the relevance of PWC and MWC to marking COVID-19 and tourism impact on different model variables in diverse pairs and time-frequency scales.
4. Policy recommendations
The empirical results yield substantial policy inferences that set out the foundation for a resilient tourism-based economy in Hawaii. Although global stringency measures lead Hawaii’s tourism industry on its verge, lost 58.7 per cent of total jobs and cost millions to the economy; however, it possesses an impression of lower environmental pollution. Taking the same perspective, our primary results imply that there is a murky relationship between COVID-19, tourism, and ambient air pollution. Without taking an integrative view, a sequester measure and policies are hard to enforce. Thus, our results suggest that Hawaii and other tourism-based economies should introduce green tourism that saves ecology, such as sustainable and green energy solutions, energy-efficient vehicles, promote cycling in tourist destinations, tourist awareness and training at source, and green hotel management. This can help to minimise air pollution that emerged from conventional ways of energy consumption (He et al., Citation2021), which helps to improve the immune system of local inhabitants to fight with respiratory diseases like COVID-19. Recent scientific research proves that the permanent exposure in higher pollution weakens respiratory organs, thus possess a higher death threat from viruses, possess countless loss to society and the economy (Razzaq et al., Citation2020). Unlike other business operations on a virtual interface, it is highly recommended to introduce virtual tourism based on virtual and augment reality. This can help to sustain the tourism-based economy in an uneven situation and help to minimise tourism carbon footprints. Moreover, diversification of the tourism-based economy is also imperative in Hawaii, such as shifting a focus toward agriculture, green cultivations, and related Agri industries, fishing, and marine business can compensate tourism losses whilst help to achieve sustainable ecology. Recently, several countries like Nepal and Pakistan launched green employment projects “Green Wager Initiative” to cultivate billions of trees that can be helpful to counter pooping unemployment and pave the way towards sustainability. Concludingly, tackling environmental pollution is an alternative policy of easing lock-down and minimizing pandemic shocks.
5. Conclusion
The outbreak of COVID-19 changed economies, societies, and human life. Global travel restrictions hamper the travel and tourism industry most amongst others. Hawaii, being a tourism-based economy needs attention to visualise the effects of this pandemic on tourism and other drivers of sustainability such as air quality. Considering the same, this study analyses the dynamic relationship between tourism, oil prices, air quality, and COVID-19 in the U.S. state ‘Hawaii’. This research employs advance Morlet’s wavelet approaches namely; continuous wavelet, wavelet coherence transforms, Partial, and Multiple Wavelet Coherence to analyses the daily data from 6 March 2020 to 3 August 2020. This Wavelet-based power spectrum is considered a superior method because it decomposes the variable time series into a number of time frequencies and produces results explicit to these frequencies
The wavelet base results expose co-movement and coherence among model covariates spread over time and frequencies horizon. The wavelet decomposition (WD) portrays a steady (strong) negative association between tourism and oil prices in short, medium, and long (very long) period. This heterogeneity is persistent in Tourism and AQI correlations, where a negative (positive) correlation is observed in the shorter-run (longer-very longer run). Interestingly tourism shows diminishing positive (increasing negative) correlation with COVID in the shorter-run (medium to longer-run), indicating the different phases of COVID and respective stringency measures across the U.S. states. The correlation between COVID and oil prices shows a marginal positive decreasing (increasing) correlation in very short-run (long-run). Finally, COVID and AQI visualising a decreasing negative correlation in very short-run, a positive constant correlation between short to long run and diminishing positive correlation from longer to very longer-run. This dynamicity is mainly attributed to halted socio-economic, transportation, and industrial activities at different phases of COVID. Moreover, easing in lock-down spur energy and fuel consumption, caused higher emissions, and vice versa.
Furthermore, the results reiterate a remarkable wavelet coherence and rigorous lead and lag associations among variables in frequency and time domain. Primarily, the variables show strong co-movement, which is varied across the time scales, indicating the initial, peak, and after peak effect of COVID-19 on tourism, oil prices, and air quality. The results of the Wavelet Coherence Transform show a cyclic (anti-cyclic) effect between tourism and oil prices, suggesting a strong positive (negative) co-movement in the shorter and longer (medium) period. Tourism and AQI possess a strong positive co-movement across all periods except in the medium run; however, the intensity of this movement is higher in the very short-run as compare to medium and longer-run. The visual of WCT further reveals the anti-cyclic effect between COVID and tourism, and COVID is leading tourism with strong negative co-movements. The results of WCT further confirm that AQI and COVID are anti-cyclical and display a positive causality in the shorter-run. However, in the medium-run, COVID is lagging AQI and shows a strong negative causality from March to July. This is mainly attributed to the peak time period of COVID, which curtail economic activities and closure of cross-border tourism, causing a significant reduction in environmental pollution. The visuals of multiple wavelet coherence re-affirm that tourism, oil prices, air quality, and COVID-19 significantly moderate the co-movement of each pair. Moreover, the results from partial wavelet coherence imply that COVID-19 lead (lag) tourism reduction in the shorter and medium run (longer-run).
References
- Aguiar-Conraria, L., Azevedo, N., & Soares, M. J. (2008). Using wavelets to decompose the time–frequency effects of monetary policy. Physica A: Statistical mechanics and its Applications, 387(12), 2863–2878.
- AHLA. (2020). Economic impact of the hotel industry showcases potential negative impact of Coronavirus pandemic. American Hotel and Lodging Association, Fact Sheet: Oxford Travel Industry Impact Study.
- An, H., Razzaq, A., Haseeb, M., & Mihardjo, L. W. (2020). The role of technology innovation and people’s connectivity in testing environmental Kuznets curve and pollution heaven hypotheses across the Belt and Road host countries: New evidence from Method of Moments Quantile Regression. Environmental Science and Pollution Research, 1–17.
- Apergis, N., & Gangopadhyay, P. (2020). The asymmetric relationships between pollution, energy use and oil prices in Vietnam: Some behavioural implications for energy policy-making. Energy Policy, 140, 111430. https://doi.org/10.1016/j.enpol.2020.111430
- Department of Business, Economic Development & Tourism Research & Economic Analysis (DBEDT). (2020a). COVID-19 & Hawaii’s economy. https://dbedt.hawaii.gov/economic/covid19/
- Department of Business, Economic Development & Tourism Research & Economic Analysis (DBEDT). (2020b). DBEDT quarterly tourism Forecast forecast. http://dbedt.hawaii.gov/visitor/tourism-forecast/
- Department of Business, Economic Development, and Tourism (DBEDT). (2014). State of Hawaii data book 2011: A statistical abstract. DBEDT Research and Economic Analysis Division, Statistics and Data Support Branch.
- Dong, F., Long, R., Bian, Z., Xu, X., Yu, B., & Wang, Y. (2017). Applying a Ruggiero three-stage super-efficiency DEA model to gauge regional carbon emission efficiency: Evidence from China. Natural Hazards, 87(3), 1453–1468. https://doi.org/10.1007/s11069-017-2826-2
- Donthu, N., & Gustafsson, A. (2020). Effects of COVID-19 on business and research. Journal of bBusiness Researchresearch, 117, 284–289. https://doi.org/10.1016/j.jbusres.2020.06.008
- ECDC (European Center for Disease Prevention and Control). (2020). https://www.ecdc.europa.eu/sites/default/files/documents/Communicable-disease-threats-report-29-aug-2020.pdf
- Economic Research Organization at University of Hawaii (UHERO). (2020). How can the state government restore fiscal balance? By James Mak, Robert D. Ebel, and Carl Bonham Bonham. https://uhero.hawaii.edu/wp-content/uploads/2020/06/HowCanTheStateGovernmentRestoreFiscalBalance3.pdf
- Eichengreen, B. (2020). Coronanomics 101: Which policy tools will contain the economic threat of COVID-19? World Economic Forum. https://www.weforum.org/agenda/2020/03/coronavirus-economics/
- Fernandes, N. (2020). Economic effects of coronavirus outbreak (COVID-19) on the world economy. IESE Business School Working Paper No. WP-1240-E. Available at SSRN https://ssrn.com/abstract=3557504 or http://dx.doi.org/10.2139/ssrn.3557504
- Gormsen, N. J., & Koijen, R. S. (2020). Coronavirus: Impact on stock prices and growth expectations. University of Chicago, Becker Friedman Institute for Economics Economics. Working Paper, (2020-22).
- Harvey, A. C. (2020). The economic and financial implications of COVID-19 (April 3, 2020). The Mayo Center for Asset Management at the University of Virginia Darden School of Business and the Financial Management Association International Virtual Seminars Series. https://www.darden.virginia.edu/mayo-center/events/virtualspeaker-series
- Hawai’i Tourism Authority (HTA). (2019a). Annual visitor research report. https://www.hawaiitourismauthority.org/media/5062/2019-annual-report-final-for-posting.pdf
- Hawai’i Tourism Authority (HTA). (2019b). Fact sheet. https://www.hawaiitourismauthority.org/media/4167/hta-tourism-econ-impact-fact-sheet-december-20
- He, X., Mishra, S., Aman, A., Shahbaz, M., Razzaq, A., & Sharif, A. (2021). The linkage between clean energy stocks and the fluctuations in oil price and financial stress in the US and Europe? Evidence from QARDL approach. Resources Policy, 72, 102021. https://doi.org/10.1016/j.resourpol.2021.102021
- Intergovernmental Panel on Climate Change (IPCC). (2014). Climate change 2014: Synthesis report. In R. K. Pachauri & L. A. Meyer (Eds.), Contribution of working groups I, II and III to the Fifth Assessment Report of the Intergovernmental Panel on Climate Change. IPCC.
- International Energy Agency (IEA). (2020). Oil 2020 report. https://www.iea.org/reports/oil-2020
- Khan, I., Rehman, F. U., Pypłacz, P., Khan, M. A., Wiśniewska, A., & Liczmańska-Kopcewicz, K. (2021). A dynamic linkage between financial development, energy consumption and economic growth: Evidence from an asymmetric and nonlinear ARDL model. Energies, 14(16), 5006. https://doi.org/10.3390/en14165006
- Khan, S. A. R., Razzaq, A., Yu, Z., Shah, A., Sharif, A., & Janjua, L. (2021). Disruption in food supply chain and undernourishment challenges: An empirical study in the context of Asian countries. Socio-Economic Planning Sciences, 101033.
- Li, K., Fang, L., & He, L. (2019). How population and energy price affect China’s environmental pollution? Energy Policypolicy, 129, 386–396. https://doi.org/10.1016/j.enpol.2019.02.020
- Mahato, S., Pal, S., & Ghosh, K. G. (2020). Effect of lock-down amid COVID-19 pandemic on air quality of the megacity Delhi, India. Science of the Total Environment, 139086.
- Mandal, I., & Pal, S. (2020). COVID-19 pandemic persuaded lock-down effects on environment over stone quarrying and crushing areas. Science of the Total EnvironmentEnvironment, 732, 139281. https://doi.org/10.1016/j.scitotenv.2020.139281
- Mi, C., Huang, Y., Fu, C., Zhang, Z., & Postolache, O. (2021). Vision-based measurement: actualities and developing trends in automated container terminals. IEEE Instrumentation & Measurement Magazine, 24(4), 65–76. https://doi.org/10.1109/MIM.2021.9448257
- Mirza, N., Naqvi, B., Rahat, B., & Rizvi, S. K. A. (2020). Price reaction, volatility timing and funds' performance during Covid-19funds’ performance during Covid-19. Finance rResearch lLetters, 36, 101657. 101657x. https://doi.org/10.1016/j.frl.2020.101657
- Mirza, N., Rahat, B., Naqvi, B., & Rizvi, S. K. A. (2020). Impact of Covid-19 on corporate solvency and possible policy responses in the EU. The Quarterly Review of Economics and Finance, https://doi.org/10.1016/j.qref.2020.09.002
- Nguyen, T. H. H., & Coca-Stefaniak, J. A. (2020). Coronavirus impacts on post-pandemic planned travel behaviours. Annals of Tourism Research, 86.
- Pata, U. K. (2020). How is COVID-19 affecting environmental pollution in US cities? Evidence from asymmetric Fourier causality test. Air Quality, Atmosphere & Health, 13(10), 1149–1155.
- Petro, G. (2020). The Coronavirus tsunami: What’s to come for US retail. Forbes. https://www.forbes.com/sites/gregpetro/2020/03/20/the-coronavirus-tsunamiwhats-to-come-for-us-retail/#128e4da6609d
- Raza, S. A., Shah, N., & Sharif, A. (2019). Time frequency relationship between energy consumption, economic growth and environmental degradation in the United States: Evidence from transportation sector. Energy, 173, 706–720. https://doi.org/10.1016/j.energy.2019.01.077
- Razzaq, A., Sharif, A., Ahmad, P., & Jermsittiparsert, K. (2021a). Asymmetric role of tourism development and technology innovation on carbon dioxide emission reduction in the Chinese economy: Fresh insights from QARDL approach. Sustainable Development, 29(1), 176–193. https://doi.org/10.1002/sd.2139
- Razzaq, A., Sharif, A., Aziz, N., Irfan, M., & Jermsittiparsert, K. (2020). Asymmetric link between environmental pollution and COVID-19 in the top ten affected states of US: A novel estimations from quantile-on-quantile approach. Environmental ResearchResearch, 191, 110189. https://doi.org/10.1016/j.envres.2020.110189
- Razzaq, A., Sharif, A., Najmi, A., Tseng, M. L., & Lim, M. K. (2021). Dynamic and causality interrelationships from municipal solid waste recycling to economic growth, carbon emissions and energy efficiency using a novel bootstrapping autoregressive distributed lag. Resources, Conservation and Recycling, 166, 105372. https://doi.org/10.1016/j.resconrec.2020.105372
- Rehman, F. U., & Sohag, K. (2021). The response of wheat productivity to climate patterns: Evidence from Pakistani districts. Climate Change Economics, 2150009. https://doi.org/10.1142/S2010007821500093
- Rizvi, S. K. A., Mirza, N., Naqvi, B., & Rahat, B. (2020). Covid-19 and asset management in EU: A preliminary assessment of performance and investment styles. Journal of Asset Management, 21(4), 281–291. https://doi.org/10.1057/s41260-020-00172-3
- Rizvi, S. K. A., Yarovaya, L., Mirza, N., & Naqvi, B. (2020a). The impact of COVID-19 on valuations of non-financial European firms (October 5, 2020). Available at SSRN: https://ssrn.com/abstract=3705462 or http://dx.doi.org/10.2139/ssrn.3705462
- Roueff, F., & Von Sachs, R. (2011). Locally stationary long memory estimation. Stochastic Processes and their Applications, 121(4), 813–844.
- Saboori, B., Al-Mulali, U., Bin Baba, M., & Mohammed, A. H. (2016). Oil-induced environmental Kuznets curve in organization of petroleum exporting countries (OPEC). International Journal of Green Energy, 13(4), 408–416. https://doi.org/10.1080/15435075.2014.961468
- Shahzad, F., Yannan, D., Kamran, H. W., Suksatan, W., Nik Hashim, N. A. A., & Razzaq, A. (2021). Outbreak of epidemic diseases and stock returns: An event study of emerging economy. Economic Research-Ekonomska Istraživanja, 1–20. https://doi.org/10.1080/1331677X.2021.1941179
- Sharif, A., Aloui, C., & Yarovaya, L. (2020). COVID-19 pandemic, oil prices, stock market, geopolitical risk and policy uncertainty nexus in the US economy: Fresh evidence from the wavelet-based approach. International Review of Financial Analysis, 70, 101496. https://doi.org/10.1016/j.irfa.2020.101496
- Sharif, A., Saha, S., & Loganathan, N. (2017). Does tourism sustain economic growth? Wavelet-based evidence from the United States. Tourism Analysis, 22(4), 467–482. https://doi.org/10.3727/108354217X15023805452022
- Sönmez, S., Apostolopoulos, Y., Lemke, M. K., & Hsieh, Y. C. J. (2020). Understanding the effects of COVID-19 on the health and safety of immigrant hospitality workers in the United States. Tourism mManagement pPerspectives, 35, 100717.
- Tabatchnaia-Tamirisa, N., Loke, M. K., Leung, P., & Tucker, K. A. (1997). Energy and tourism in Hawaii. Annals of Tourism Research, 24(2), 390–401. https://doi.org/10.1016/S0160-7383(97)80008-4
- Torrence, C., & Compo, G. P. (1998). A practical guide to wavelet analysis. Bulletin of the American Meteorological Society, 79(1), 61–78. https://doi.org/10.1175/1520-0477(1998)079<0061:APGTWA>2.0.CO;2
- Ullah, S., Chishti, M. Z., & Majeed, M. T. (2020). The asymmetric effects of oil price changes on environmental pollution: Evidence from the top ten carbon emitters. Environmental Science and Pollution Research, 27, 29623–29635. https://doi.org/10.1007/s11356-020-09264-4
- Umar, M., Xu, Y., & Mirza, S. S. (2021). The impact of Covid-19 on Gig economy. Economic Research-Ekonomska Istraživanja, 34(1), 2284–2296. https://doi.org/10.1080/1331677X.2020.1862688
- UNESCO. (2020). Educational disruption and response. https://plus.google.com/+UNESCO. COVID-19https://en.unesco.org/themes/education-emergencies/coronavirus-school-closures
- University of Hawaii Economic Research Organization (UHERO). (2018). Not much lift from tax cuts in Hawaii’s Soaring Economy. http://uhero.hawaii.edu/assets/18Q1_StateUpdate_Public.pdf
- UNWTO. (2020, May). UNWTO World Tourism Barometer. (Vol. 18, Issue 2, May 2020). UNWTO.
- World Health Organization. (2020a, January 20). Teleconference of the R&D Blueprint GCM. Pneumonia of unknown etiology in Wuhan China. https://www.who.int/blueprint/priority-diseases/key-action/20-01-2020-nfr-gcm.pdf?ua=1
- World Health Organization. (2020b). https://www.who.int/docs/default-source/coronaviruse/situation-reports/20200824-weekly-epi-update.pdf?sfvrsn=806986d1_4
- WTTC. (2020). Latest research from WTTC. World Travel & Tourism Council (WTTC). Available from: https://www.wttc.org/about/media-centre/press-releases/press-releases/2020/latest-research-from-wttc-shows-an-increase-in-jobs-at-risk-in-travel-and-tourism/.
- Wu, B., Jin, C., Monfort, A., & Hua, D. (2021). Generous charity to preserve green image? Exploring linkage between strategic donations and environmental misconduct. Journal of bBusiness Researchresearch, 131, 839–850. https://doi.org/10.1016/j.jbusres.2020.10.040
- Yarovaya, L., Mirza, N., Abaidi, J., & Hasnaoui, A. (2021). Human capital efficiency and equity funds’ performance during the COVID-19 pandemic. International Review of Economics & Finance, 71, 584–591. https://doi.org/10.1016/j.iref.2020.09.017
- Yarovaya, L., Mirza, N., Rizvi, S. K. A., & Naqvi, B. (2020a). COVID-19 pandemic and stress testing the eurozone credit portfolios(October 5, 2020). Available at SSRN: https://ssrn.com/abstract=3705474 or http://dx.doi.org/10.2139/ssrn.3705474
- Yu, Z., Razzaq, A., Rehman, A., Shah, A., Jameel, K., & Mor, R. S. (2021). Disruption in global supply chain and socio-economic shocks: A lesson from COVID-19 for sustainable production and consumption. Operations Management Research, 1–16.
- Zambrano-Monserrate, M. A., Ruano, M. A., & Sanchez-Alcalde, L. (2020). Indirect effects of COVID-19 on the environment. Science of the Total EnvironmentEnvironment, 728, 138813. https://doi.org/10.1016/j.scitotenv.2020.138813
- Zenker, S., & Kock, F. (2020). The coronavirus pandemic–A critical discussion of a tourism research agenda. Tourism mManagement, 81, 104164.
- Zivot, E., & Andrews, D. W. K. (1992). Further evidence on the great crash, the oil-price shock, and the unit-root hypothesis. Journal of Business and Economic Statistics, 10, 251–270. https://doi.org/10.2307/1391541
Other online References
- EPA. (2020). Environmental Protection Agency. https://www.epa.gov/outdoor-air-quality-data/air-data-daily-air-quality-tracker.
- FRED. (2020). Federal Reserve Bank. https://fred.stlouisfed.org/tags/series?t=oil
- H.Gov. (2020). State Government Hawaii. https://dbedt.hawaii.gov/visitor/daily-passenger-counts/international-passenger-counts/
- US. (2020). US Facts. https://usafacts.org/visualizations/coronavirus-covid-19-spread-map/